Start with these Economy graphics
Newest source-labelled pages in this topic, with source blocks and data tables attached.
Graphics archive
GDP, trade, productivity, income, industrial structure and national-accounts graphics that explain Taiwan’s macro engine.
Newest source-labelled pages in this topic, with source blocks and data tables attached.
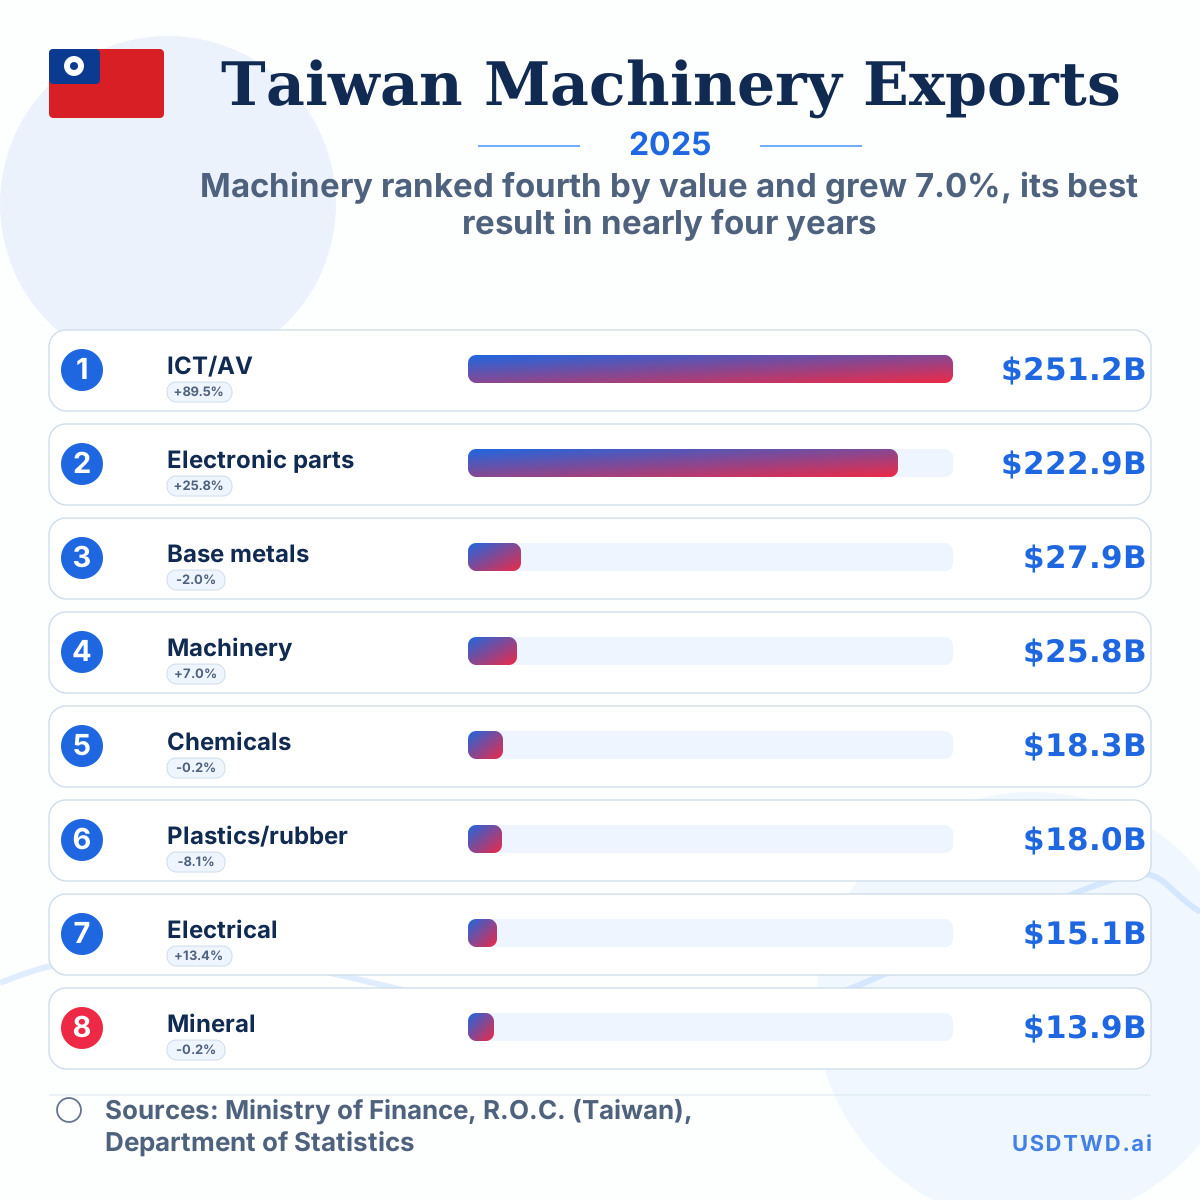
Machinery ranked fourth by value and grew 7.0%, its best result in nearly four years
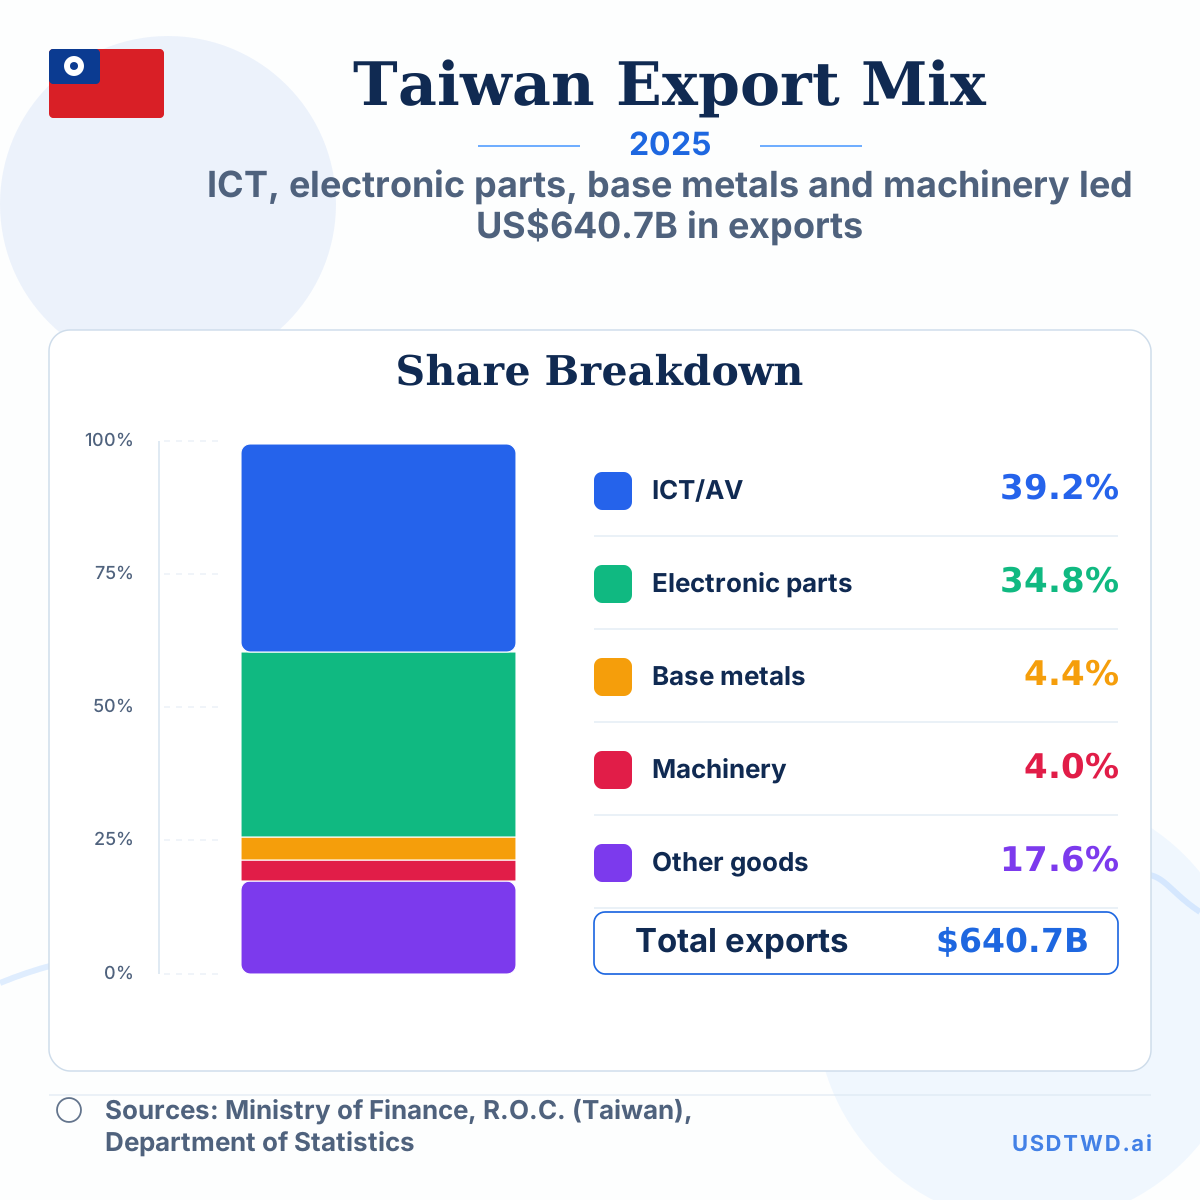
ICT, electronic parts, base metals and machinery led US$640.7B in exports
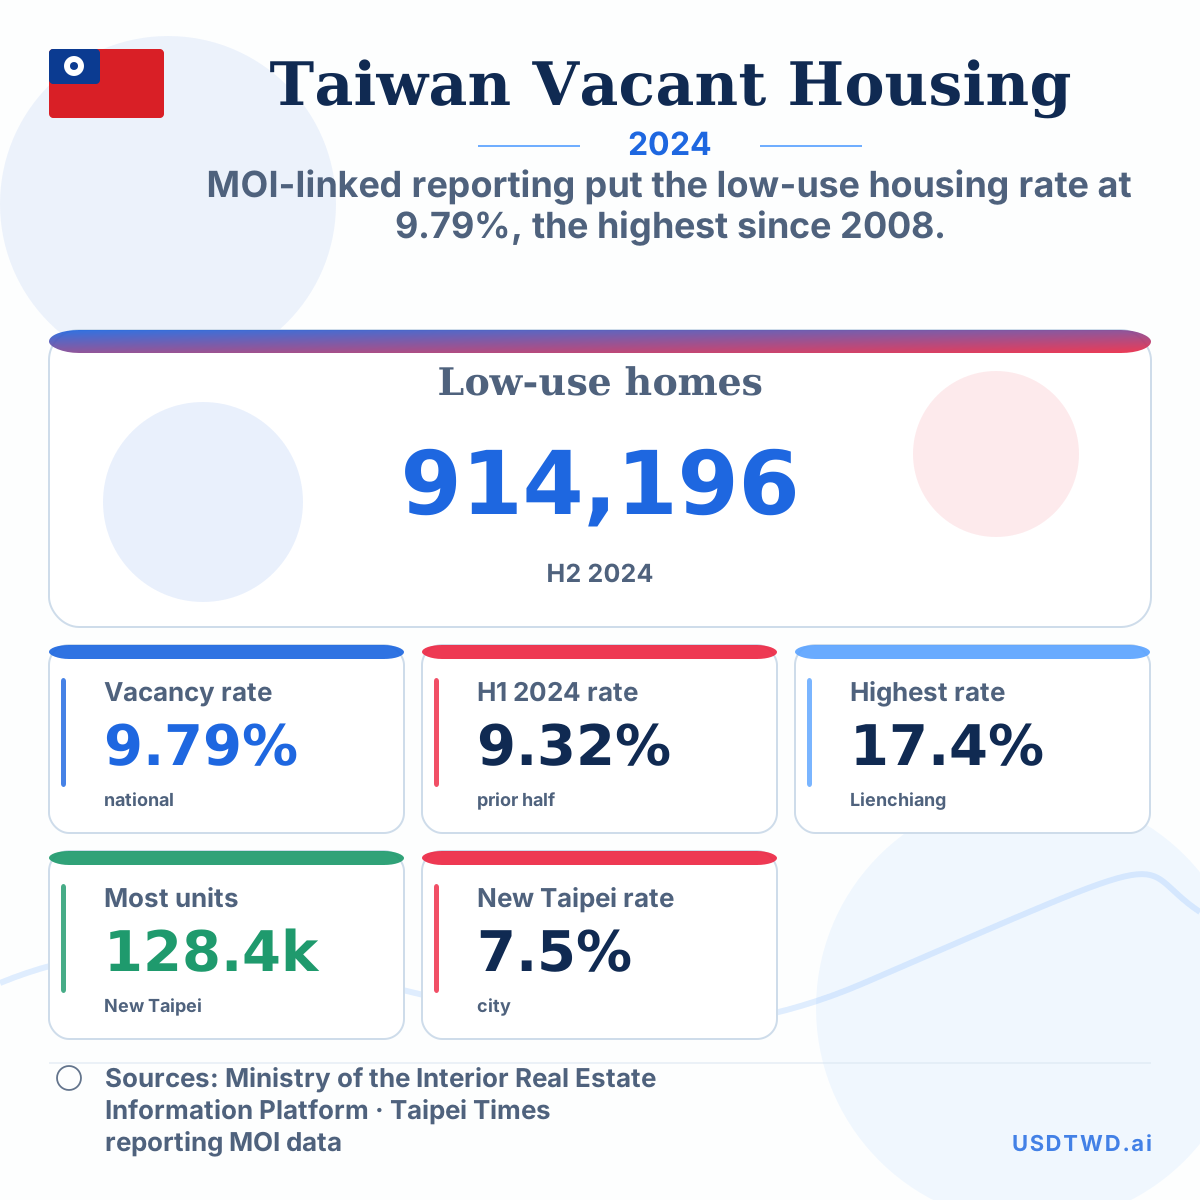
MOI-linked reporting put the low-use housing rate at 9.79%, the highest since 2008.
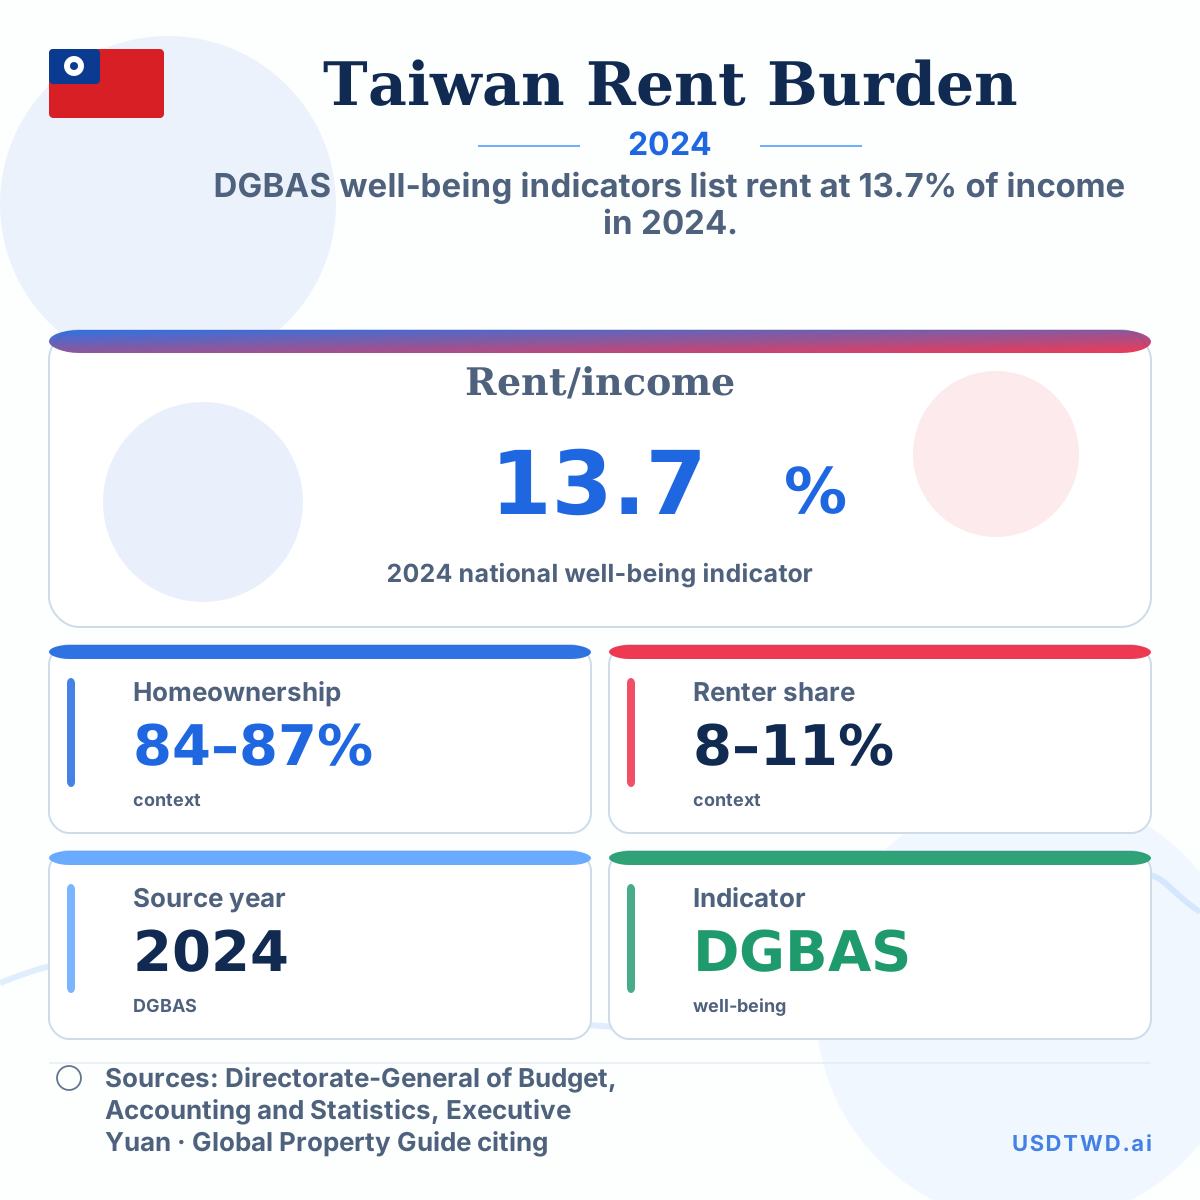
DGBAS well-being indicators list rent at 13.7% of income in 2024.
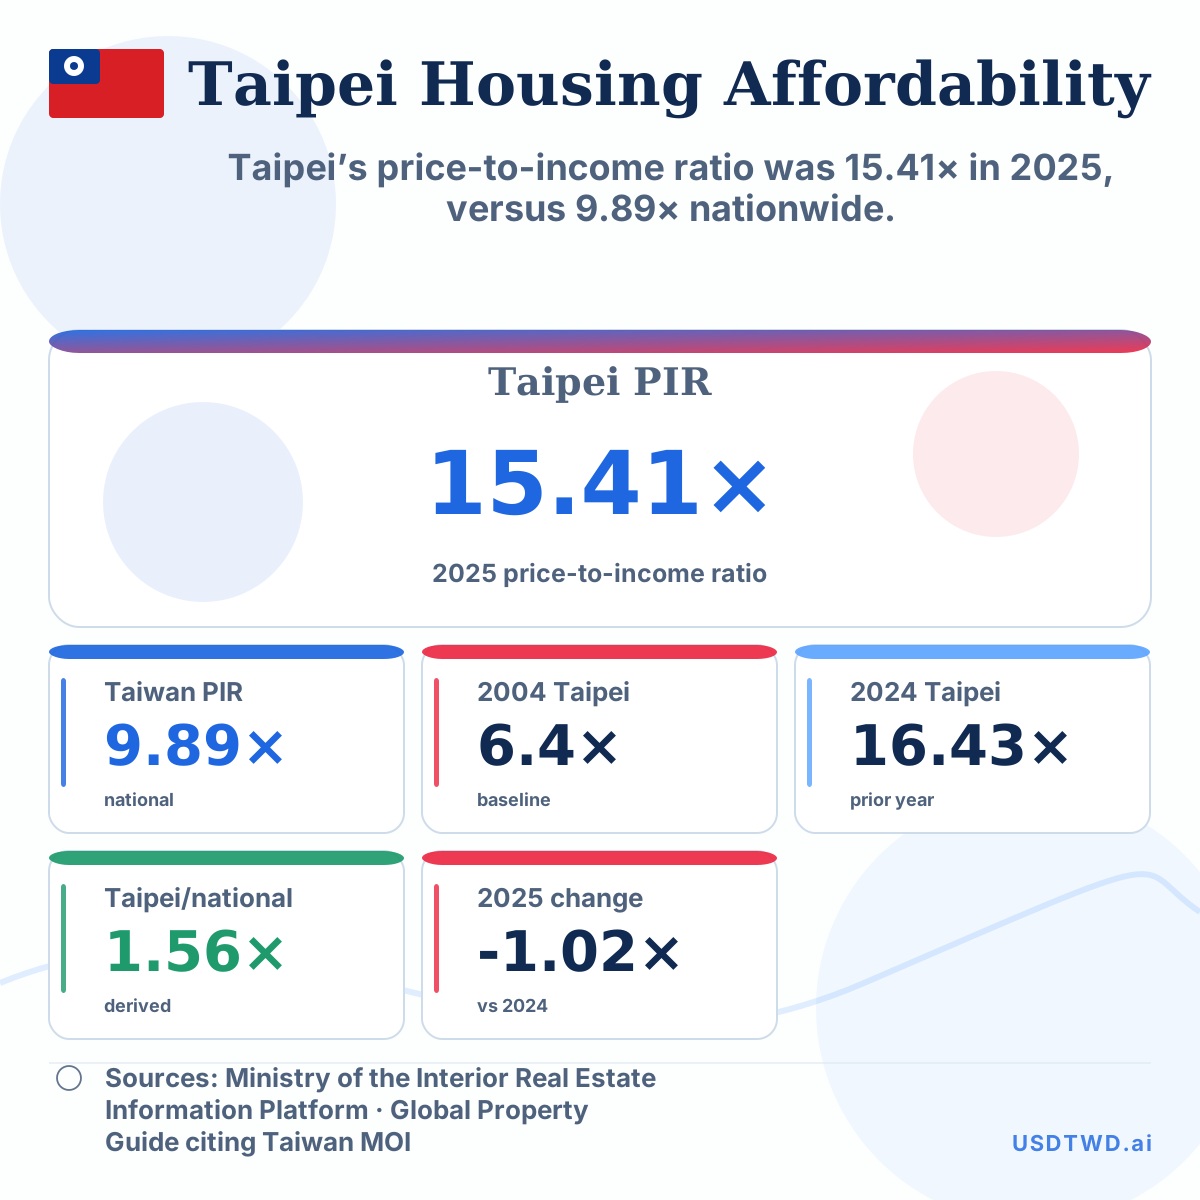
Taipei’s price-to-income ratio was 15.41× in 2025, versus 9.89× nationwide.
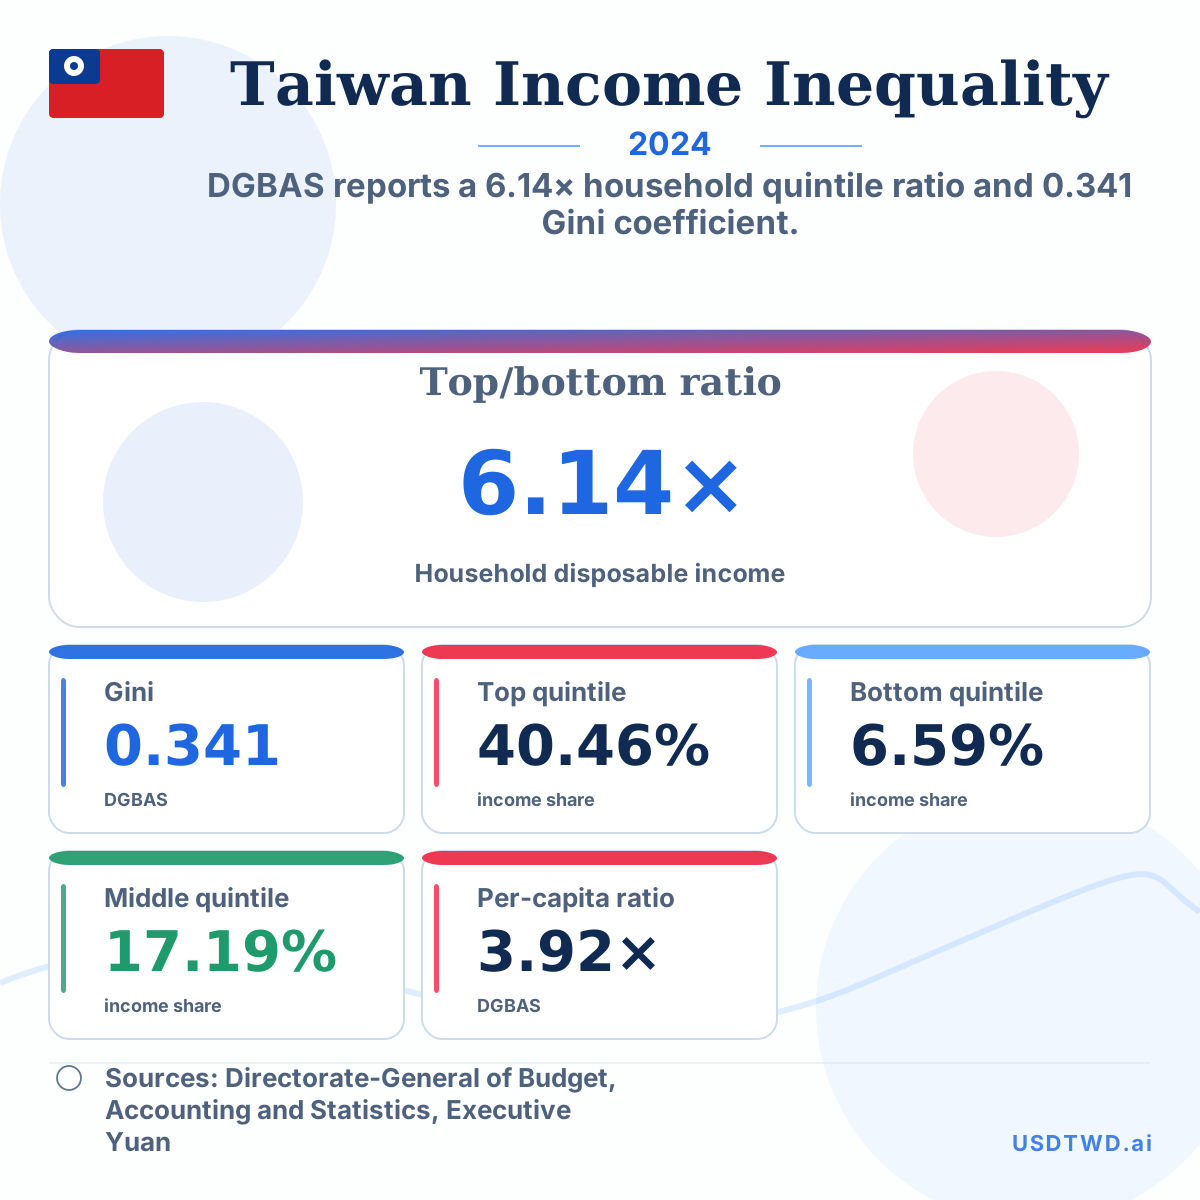
DGBAS reports a 6.14× household quintile ratio and 0.341 Gini coefficient.
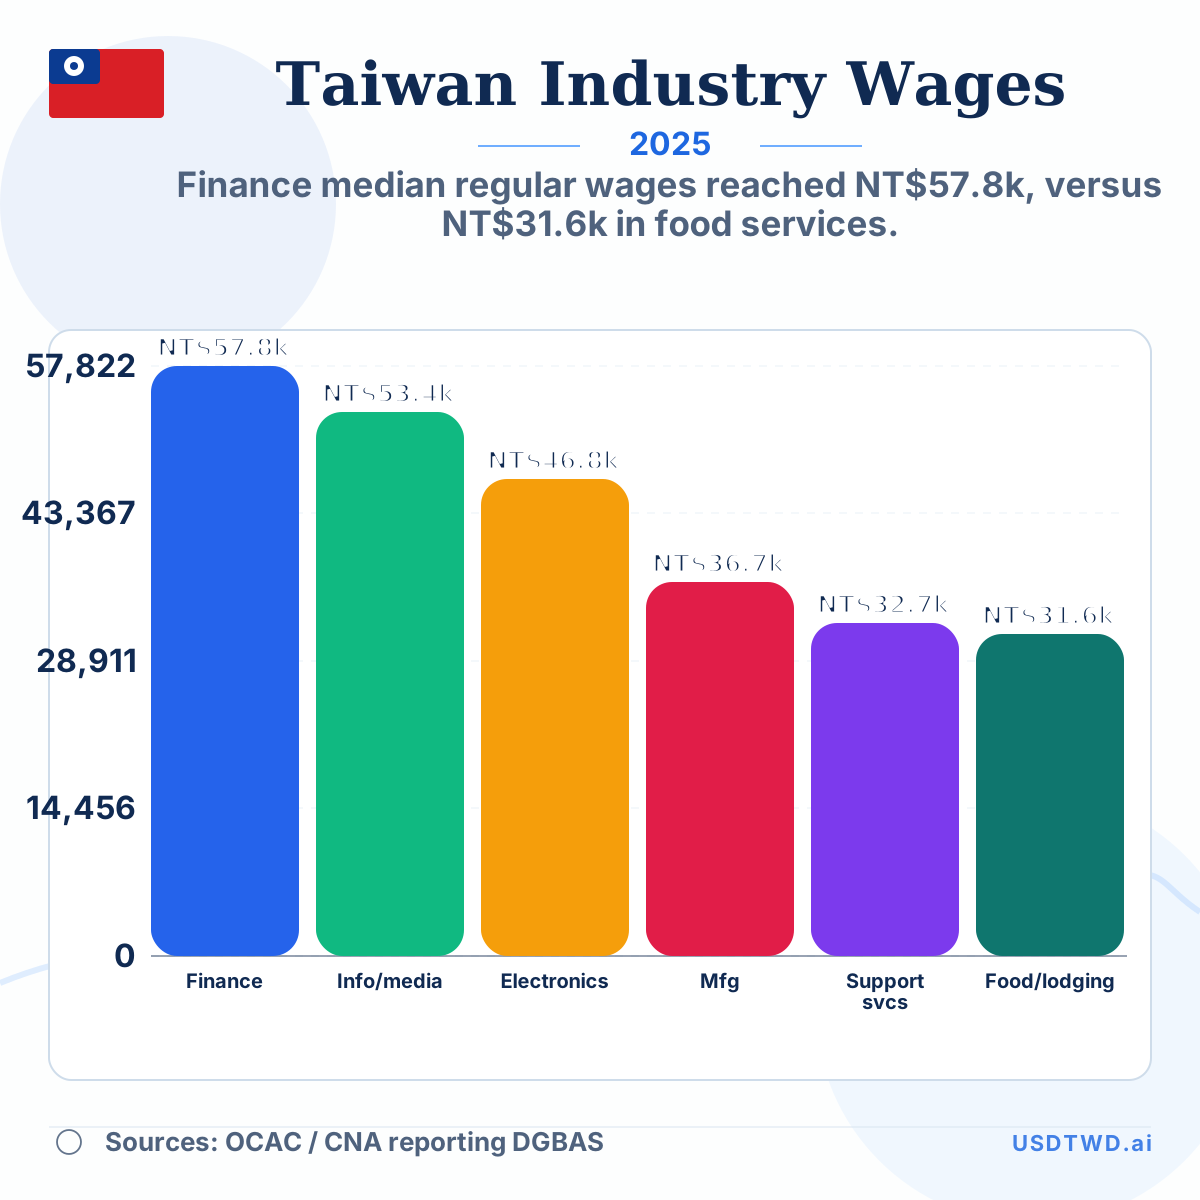
Finance median regular wages reached NT$57.8k, versus NT$31.6k in food services.
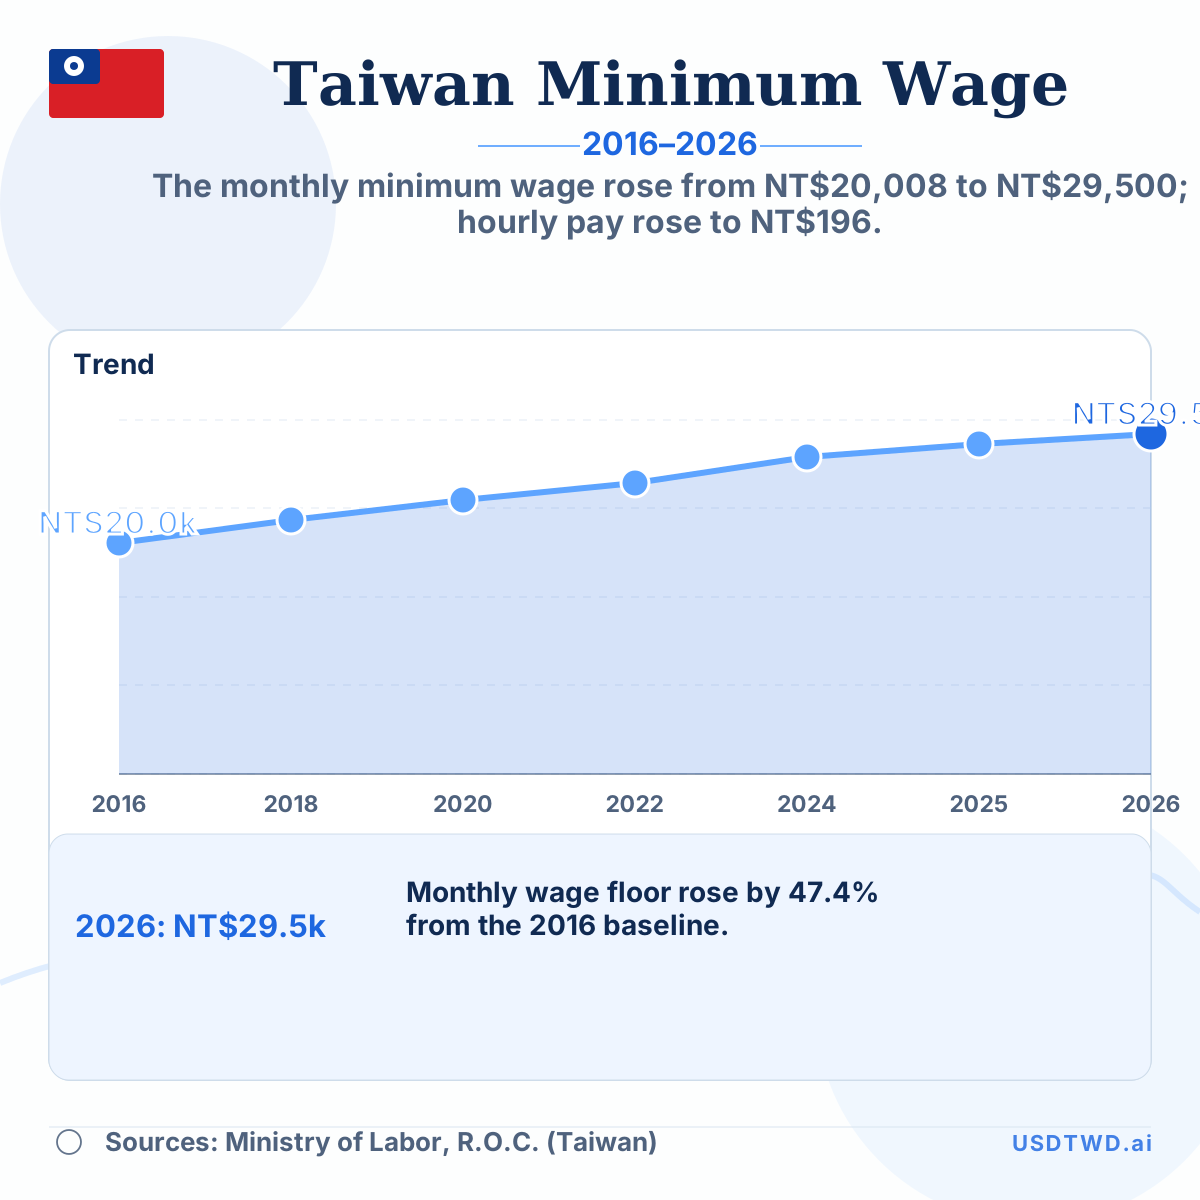
The monthly minimum wage rose from NT$20,008 to NT$29,500; hourly pay rose to NT$196.
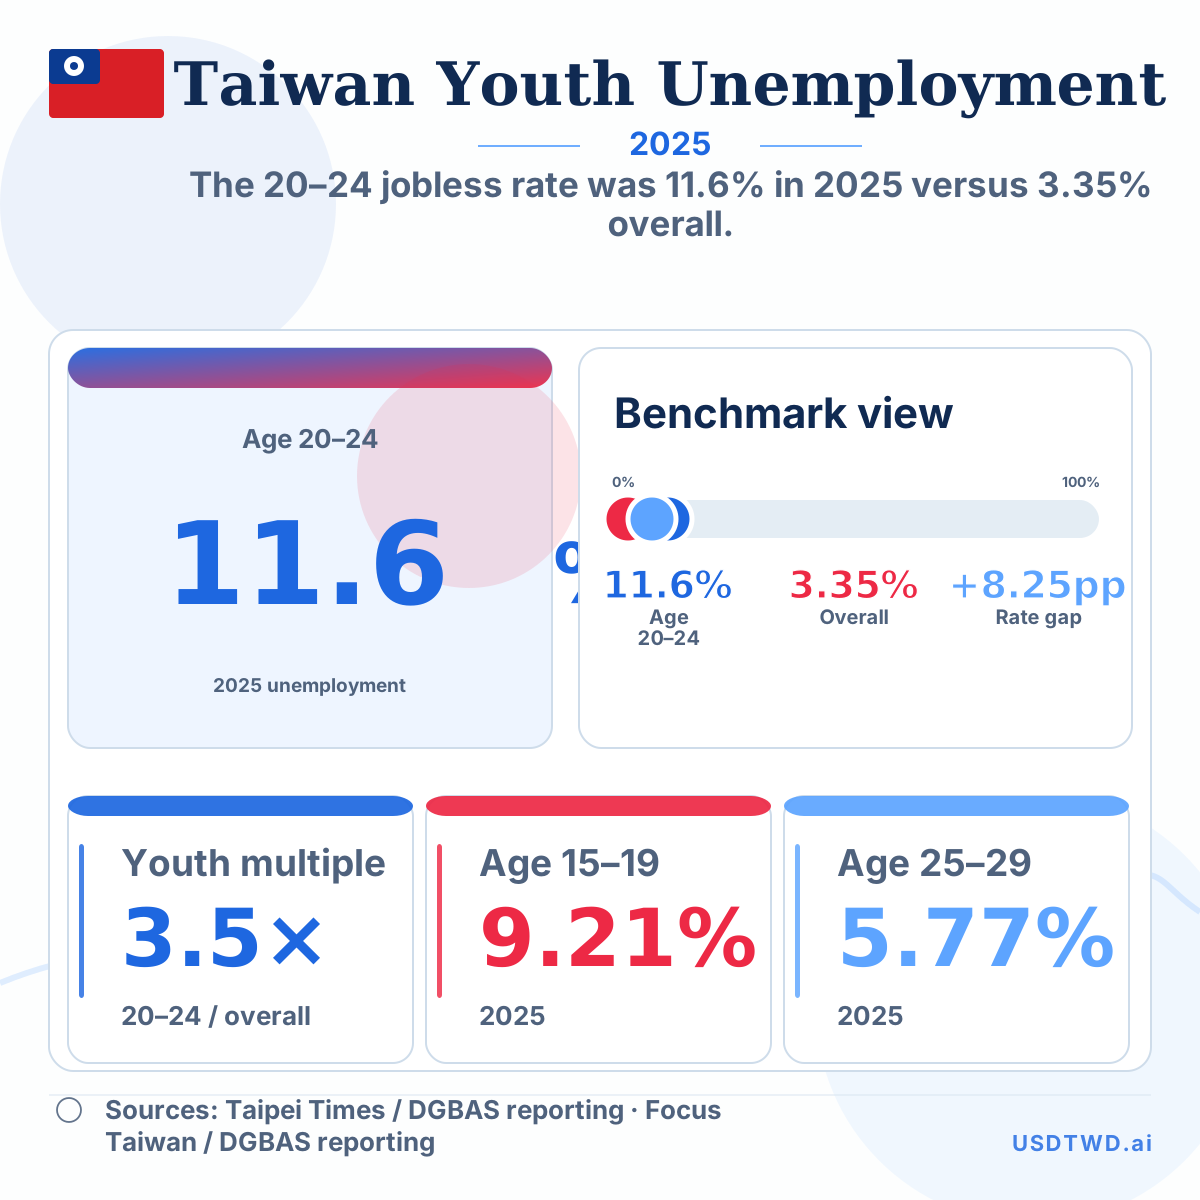
The 20–24 jobless rate was 11.6% in 2025 versus 3.35% overall.
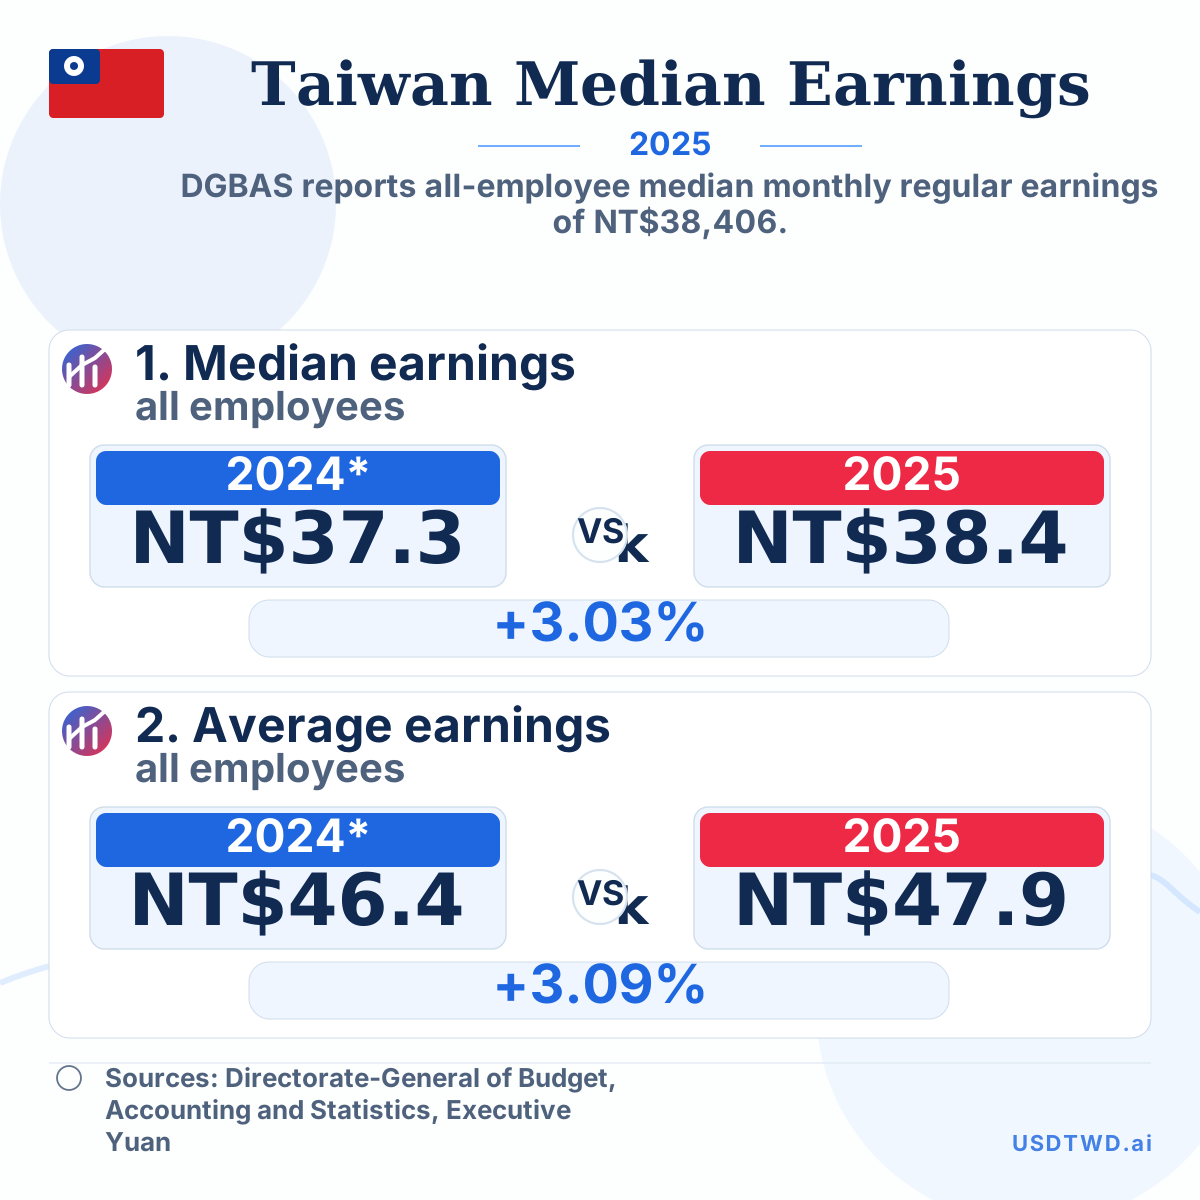
DGBAS reports all-employee median monthly regular earnings of NT$38,406.