Start with these Economy graphics
Newest source-labelled pages in this topic, with source blocks and data tables attached.
Graphics archive
GDP, trade, productivity, income, industrial structure and national-accounts graphics that explain Taiwan’s macro engine.
Newest source-labelled pages in this topic, with source blocks and data tables attached.
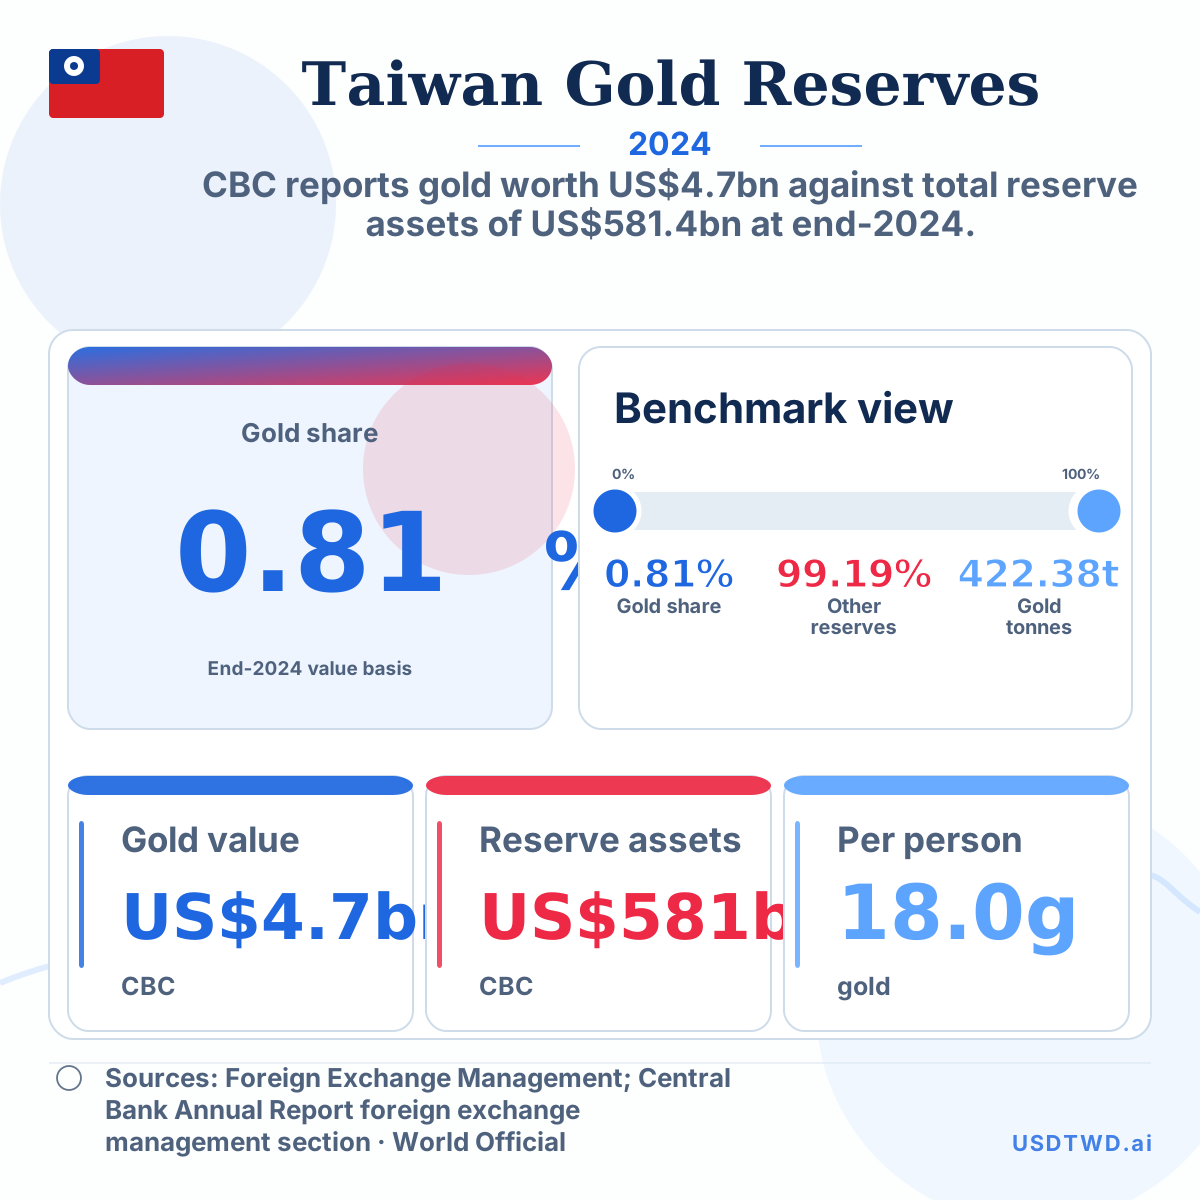
CBC reports gold worth US$4.7bn against total reserve assets of US$581.4bn at end-2024.
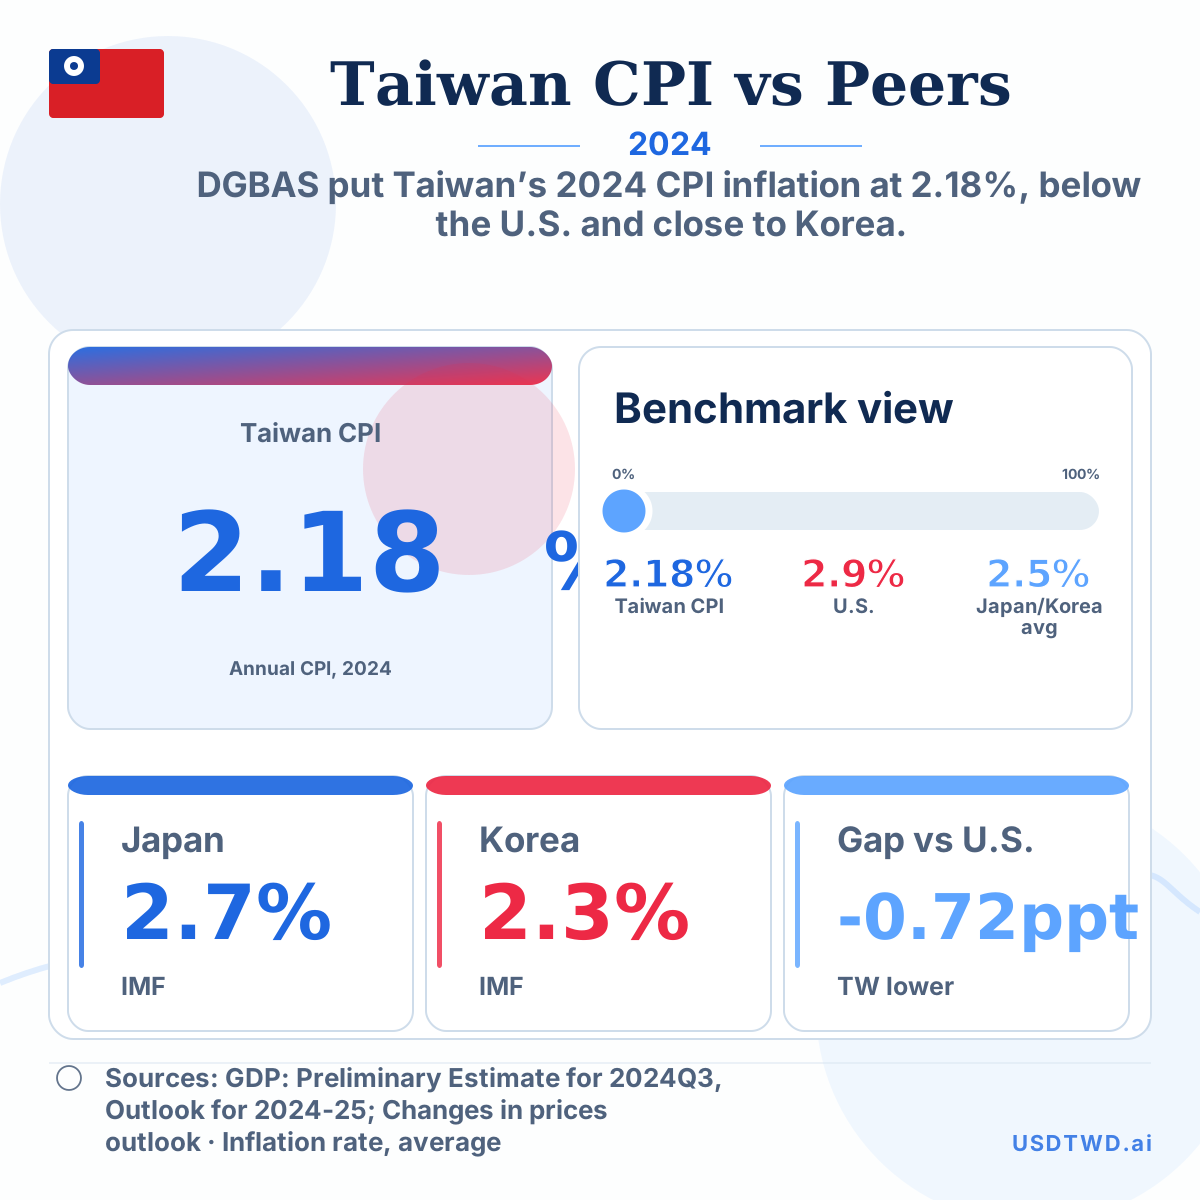
DGBAS put Taiwan’s 2024 CPI inflation at 2.18%, below the U.S. and close to Korea.
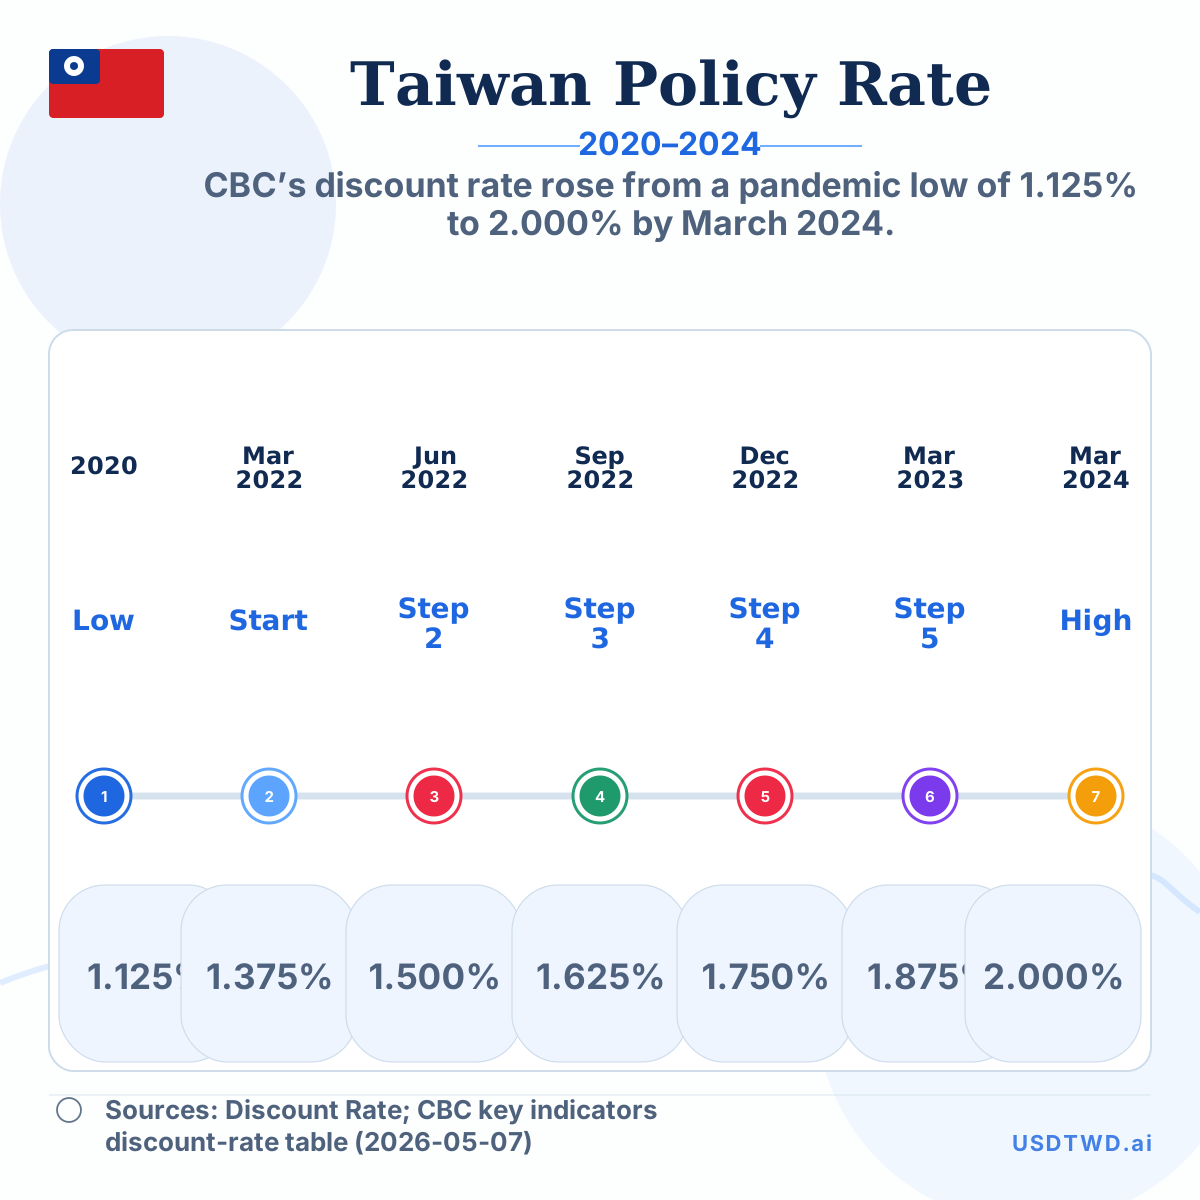
CBC’s discount rate rose from a pandemic low of 1.125% to 2.000% by March 2024.
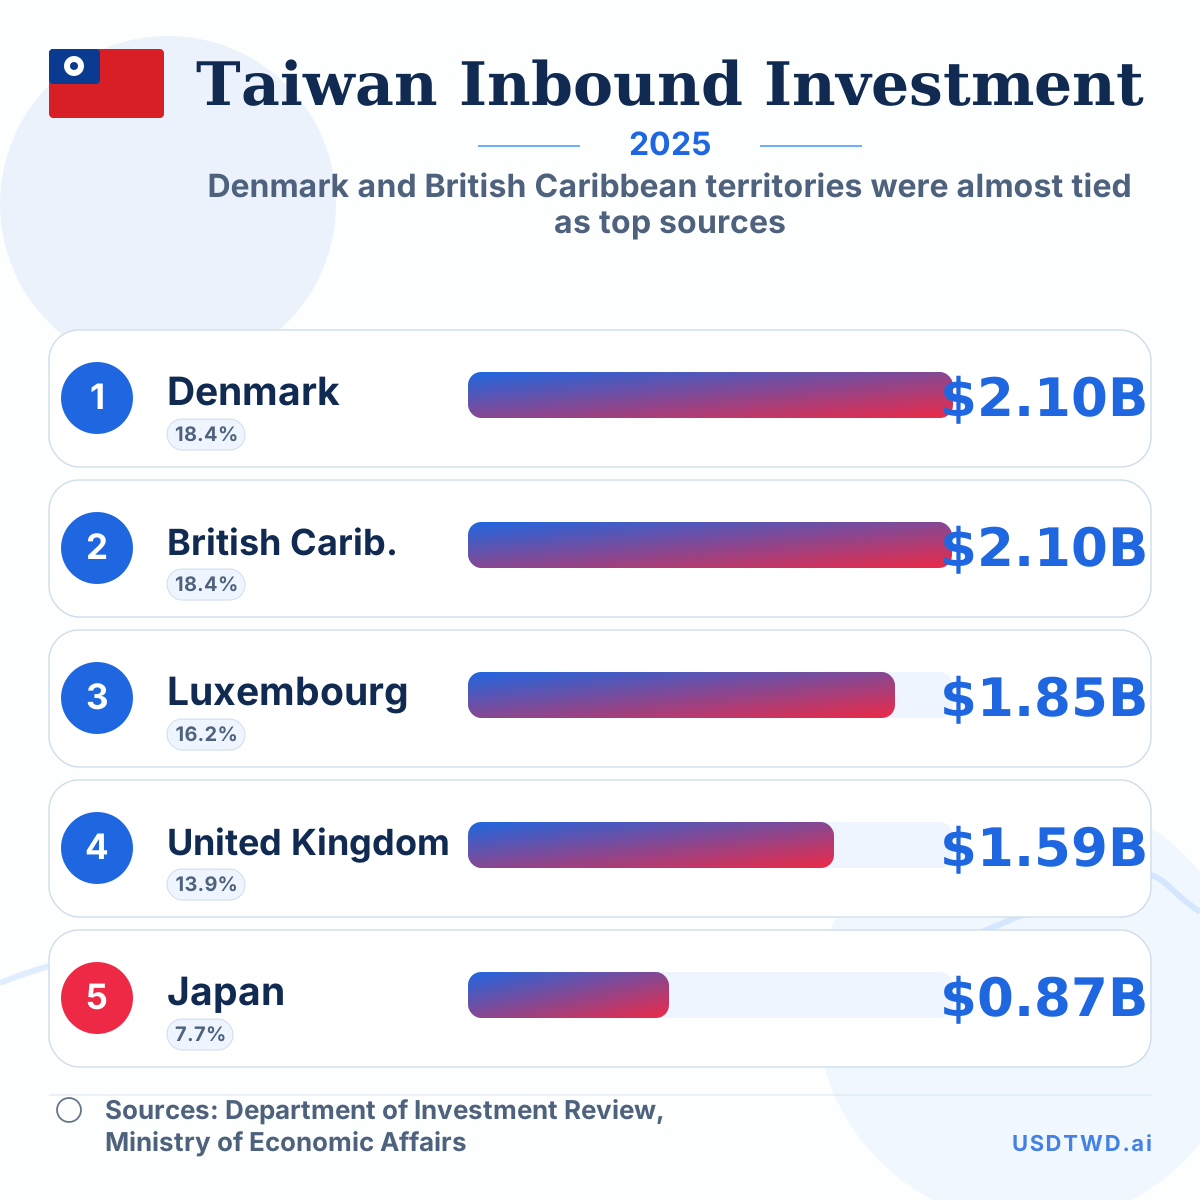
Denmark and British Caribbean territories were almost tied as top sources
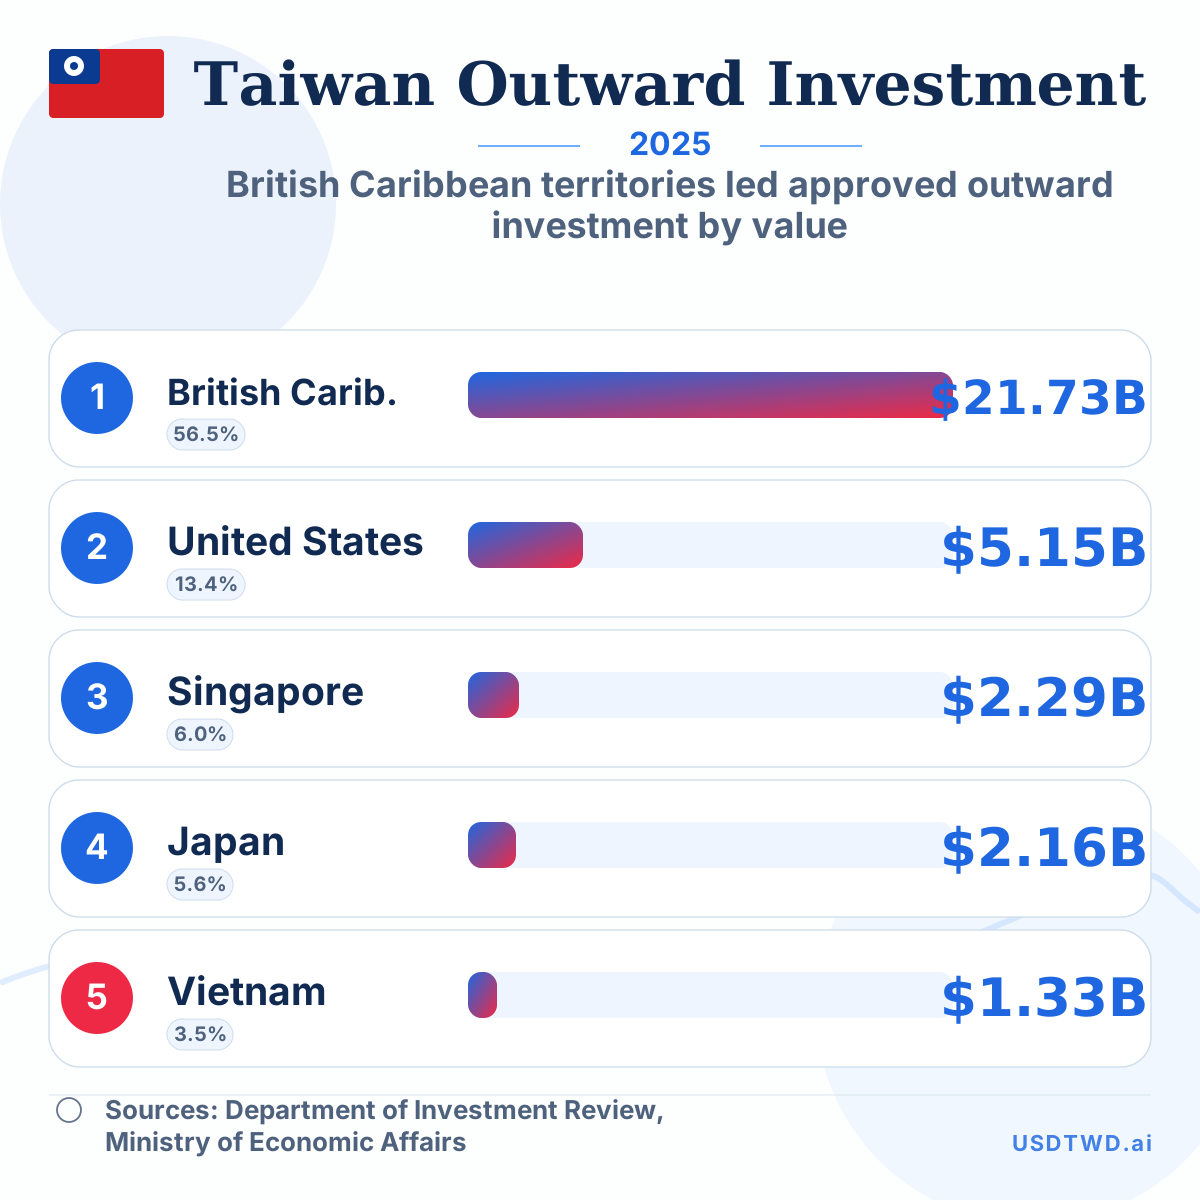
British Caribbean territories led approved outward investment by value
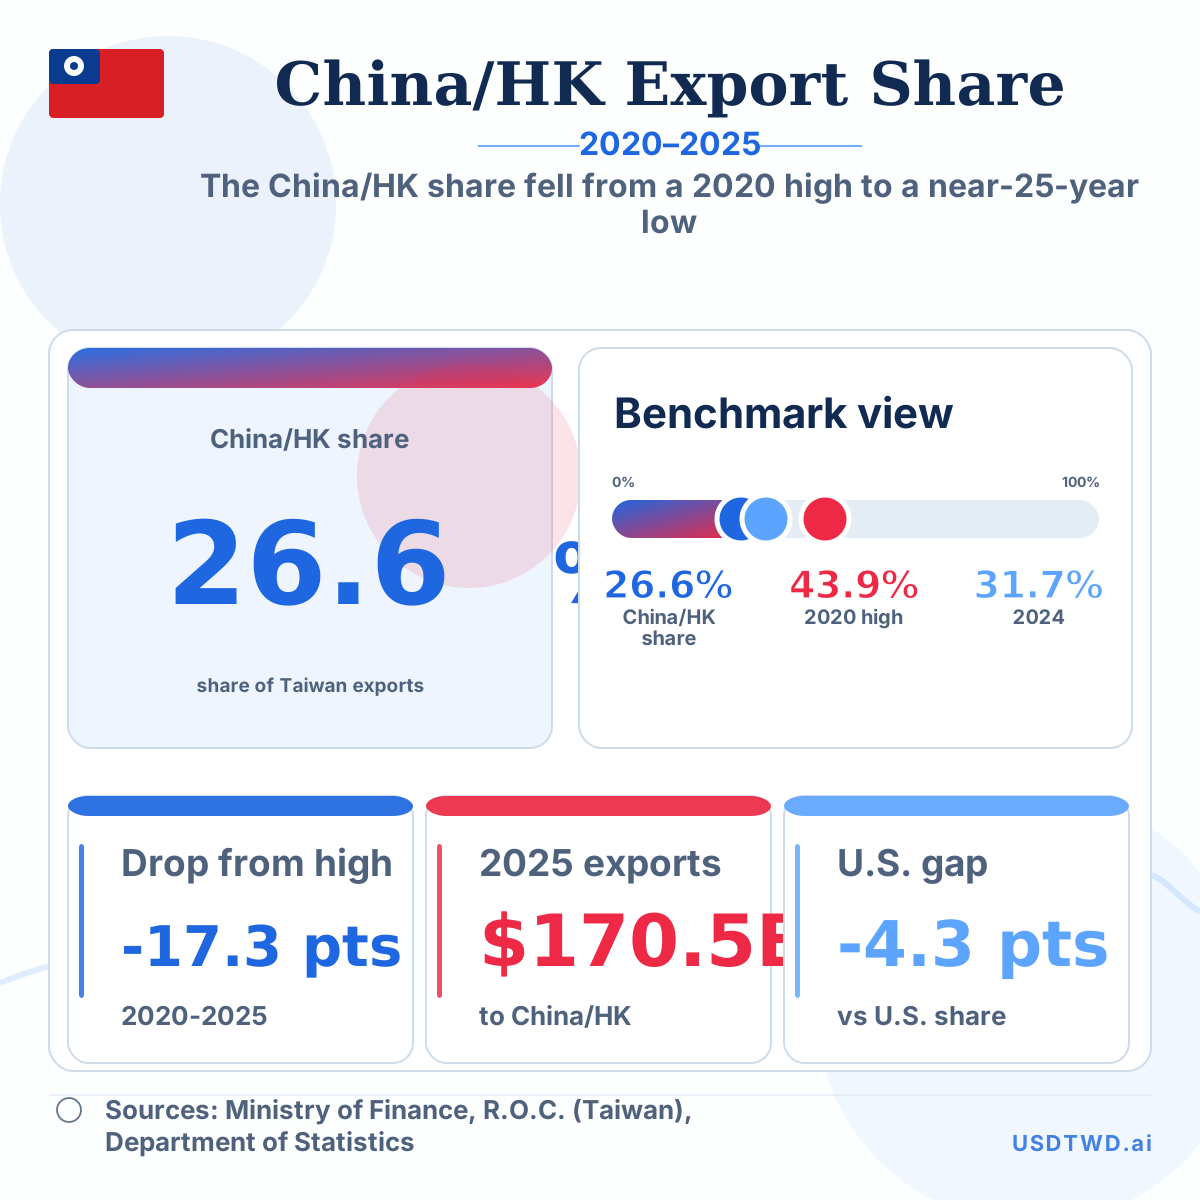
The China/HK share fell from a 2020 high to a near-25-year low
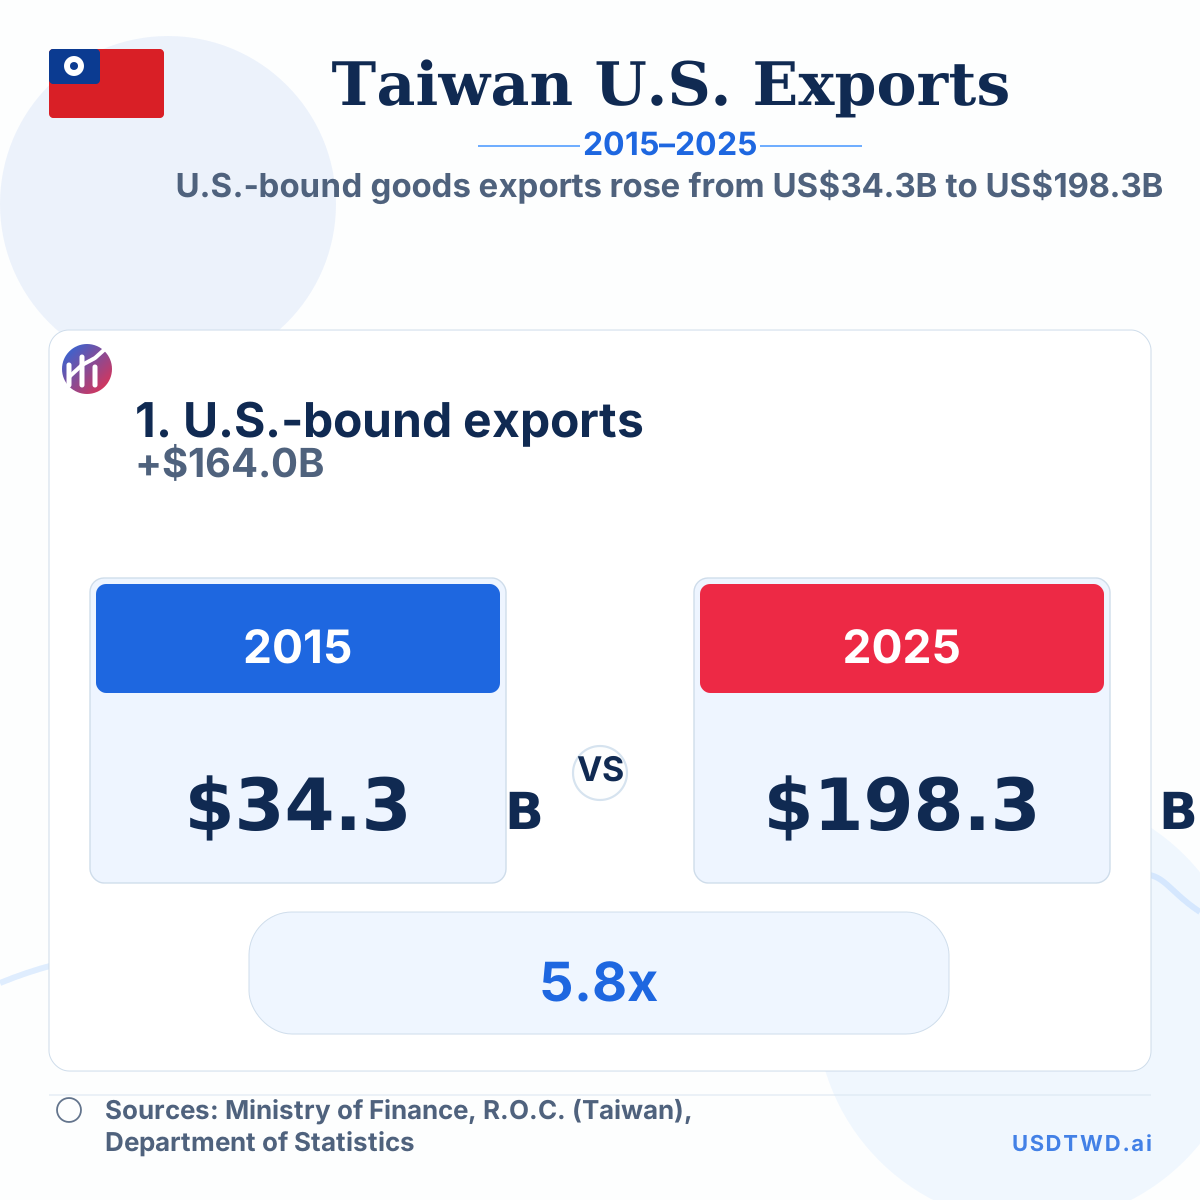
U.S.-bound goods exports rose from US$34.3B to US$198.3B
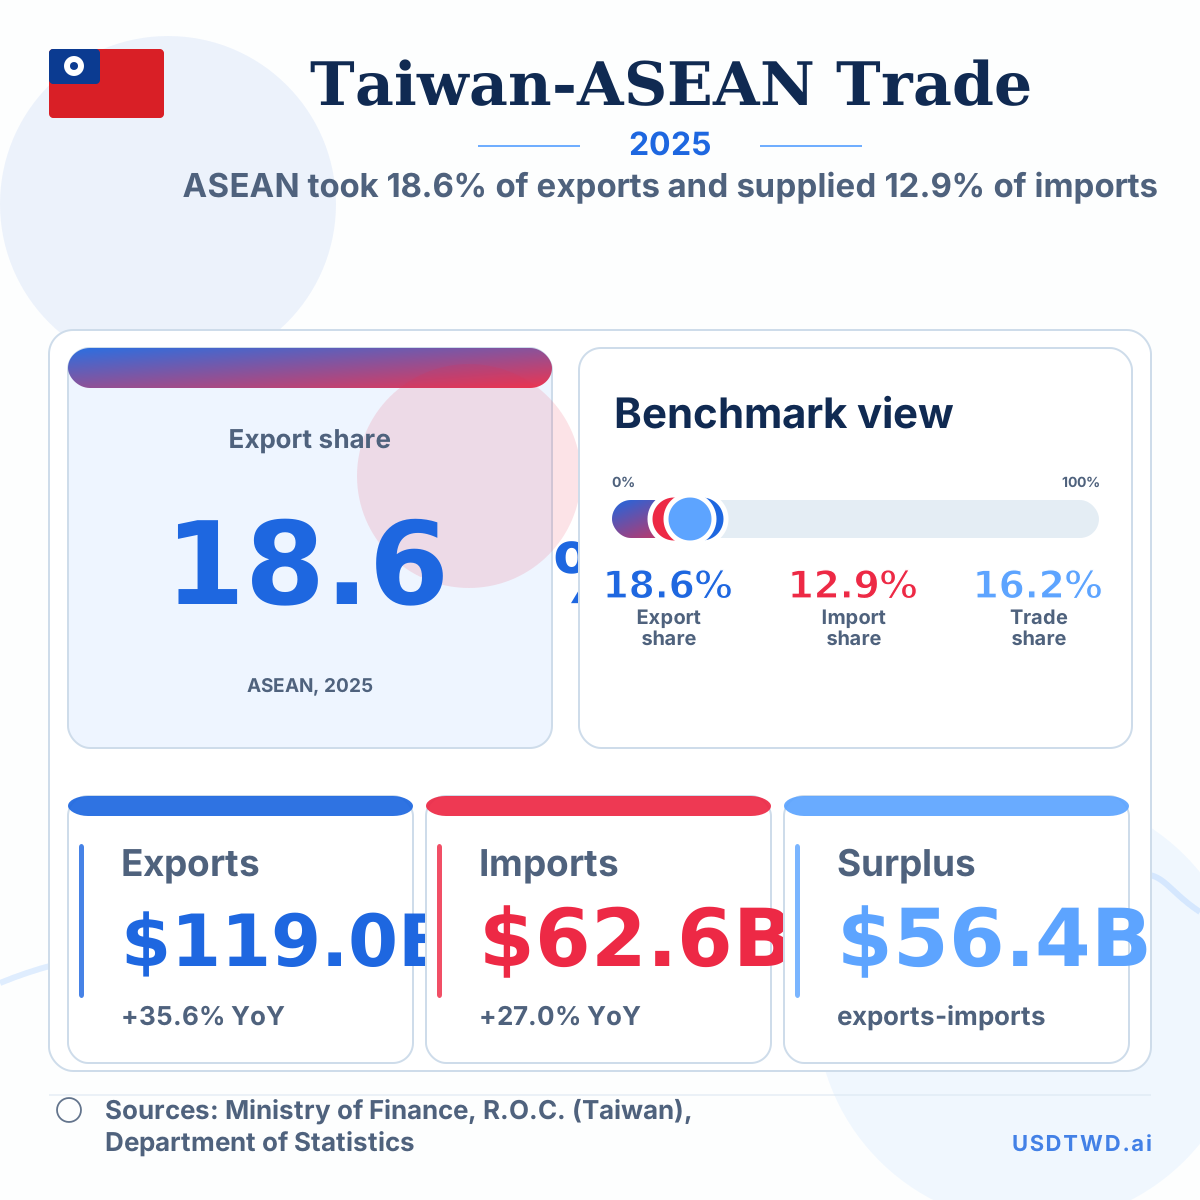
ASEAN took 18.6% of exports and supplied 12.9% of imports
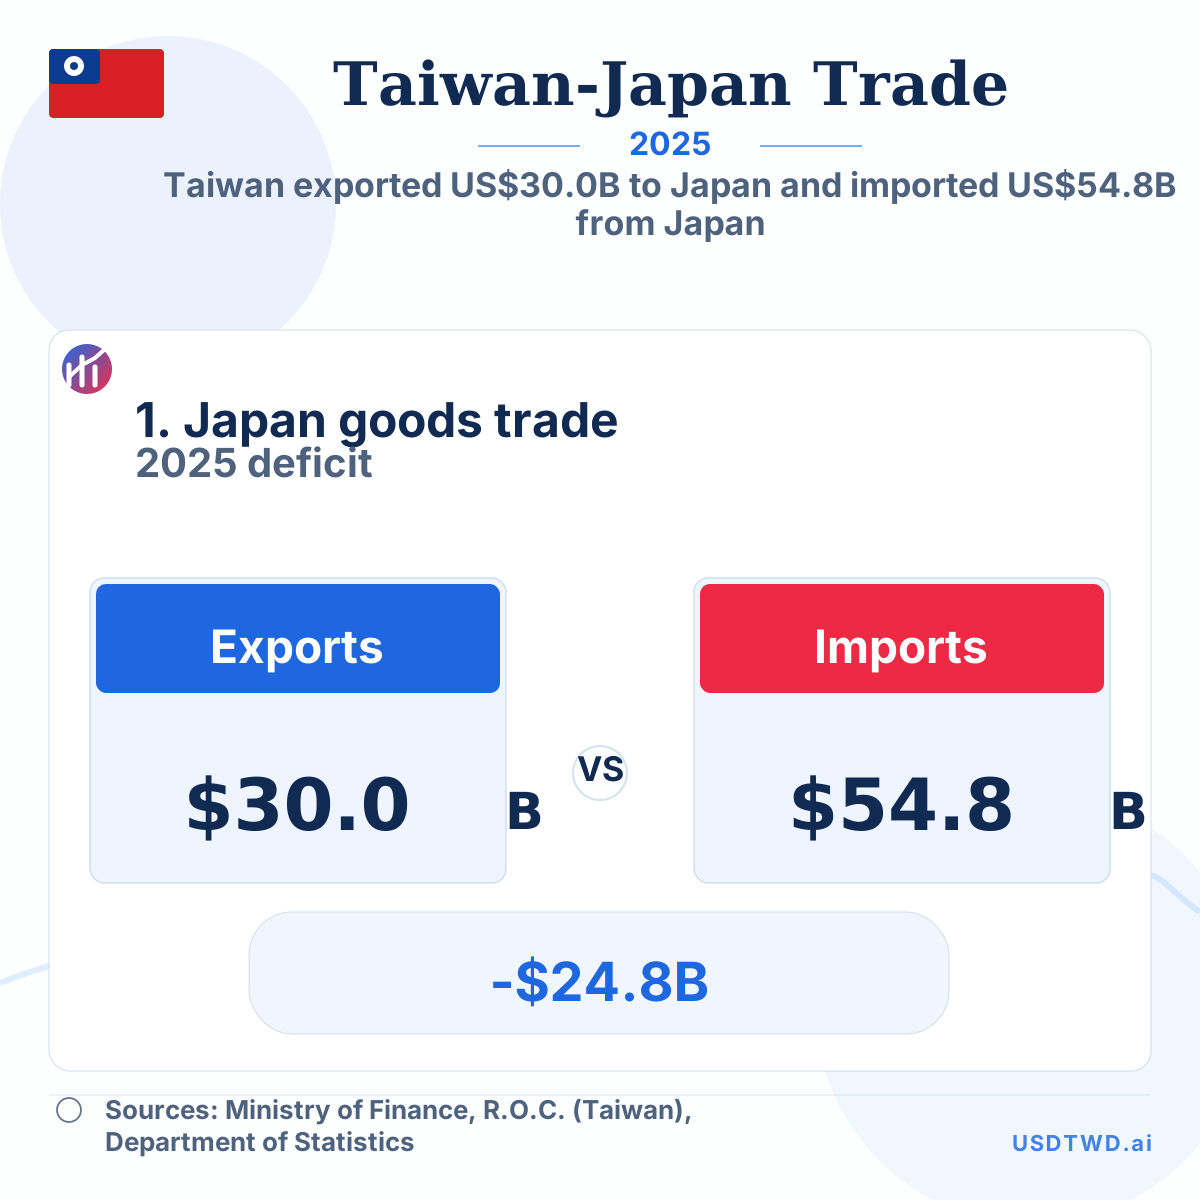
Taiwan exported US$30.0B to Japan and imported US$54.8B from Japan
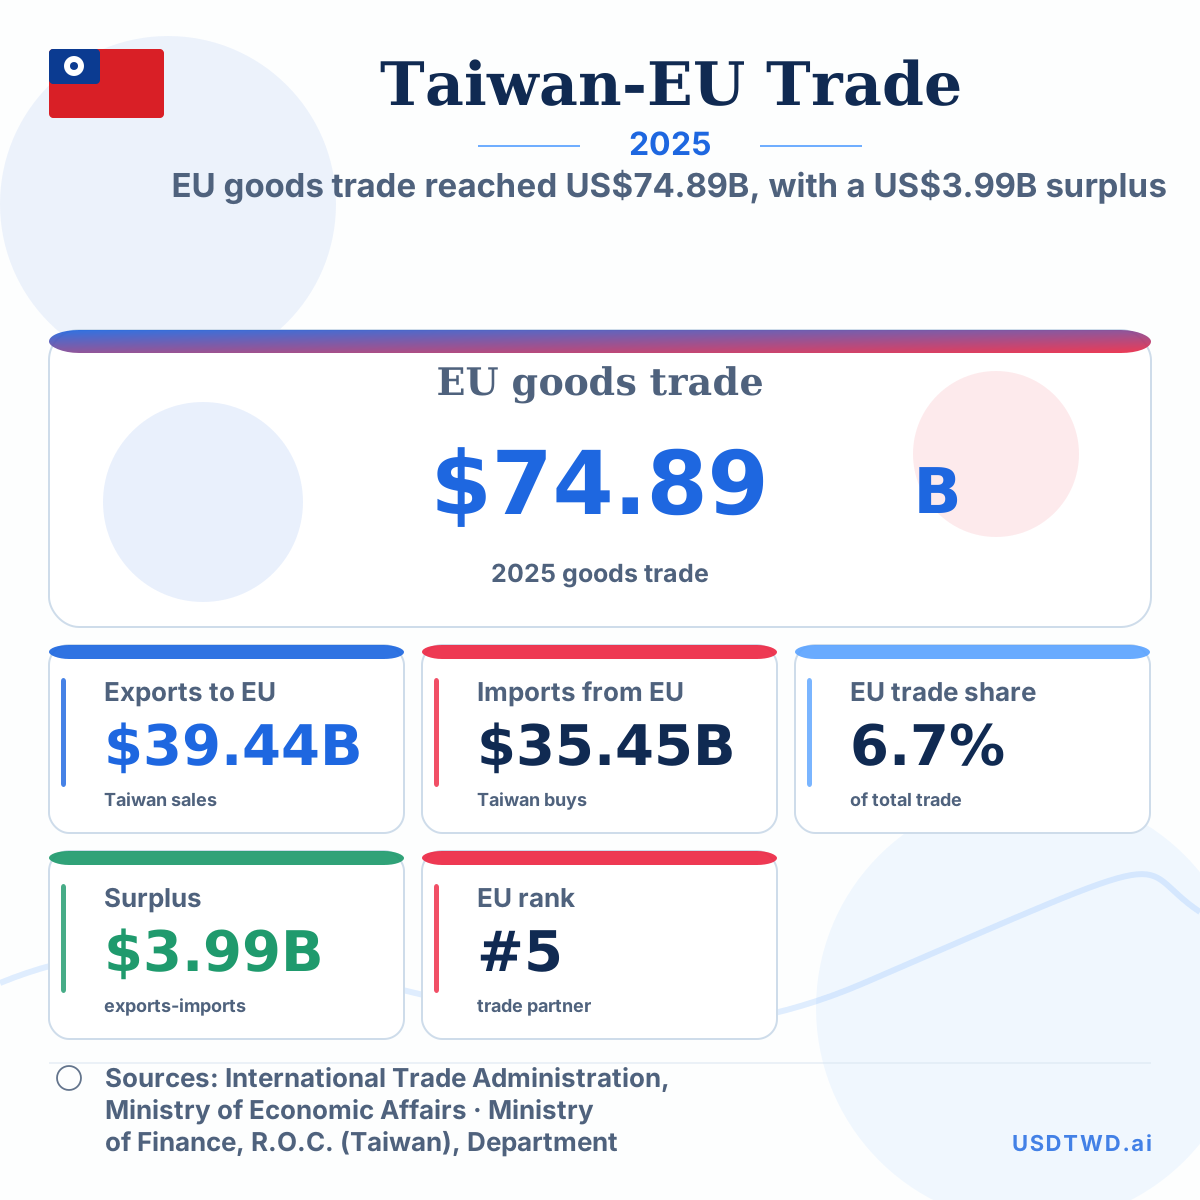
EU goods trade reached US$74.89B, with a US$3.99B surplus