Start with these Economy graphics
Newest source-labelled pages in this topic, with source blocks and data tables attached.
Graphics archive
GDP, trade, productivity, income, industrial structure and national-accounts graphics that explain Taiwan’s macro engine.
Newest source-labelled pages in this topic, with source blocks and data tables attached.
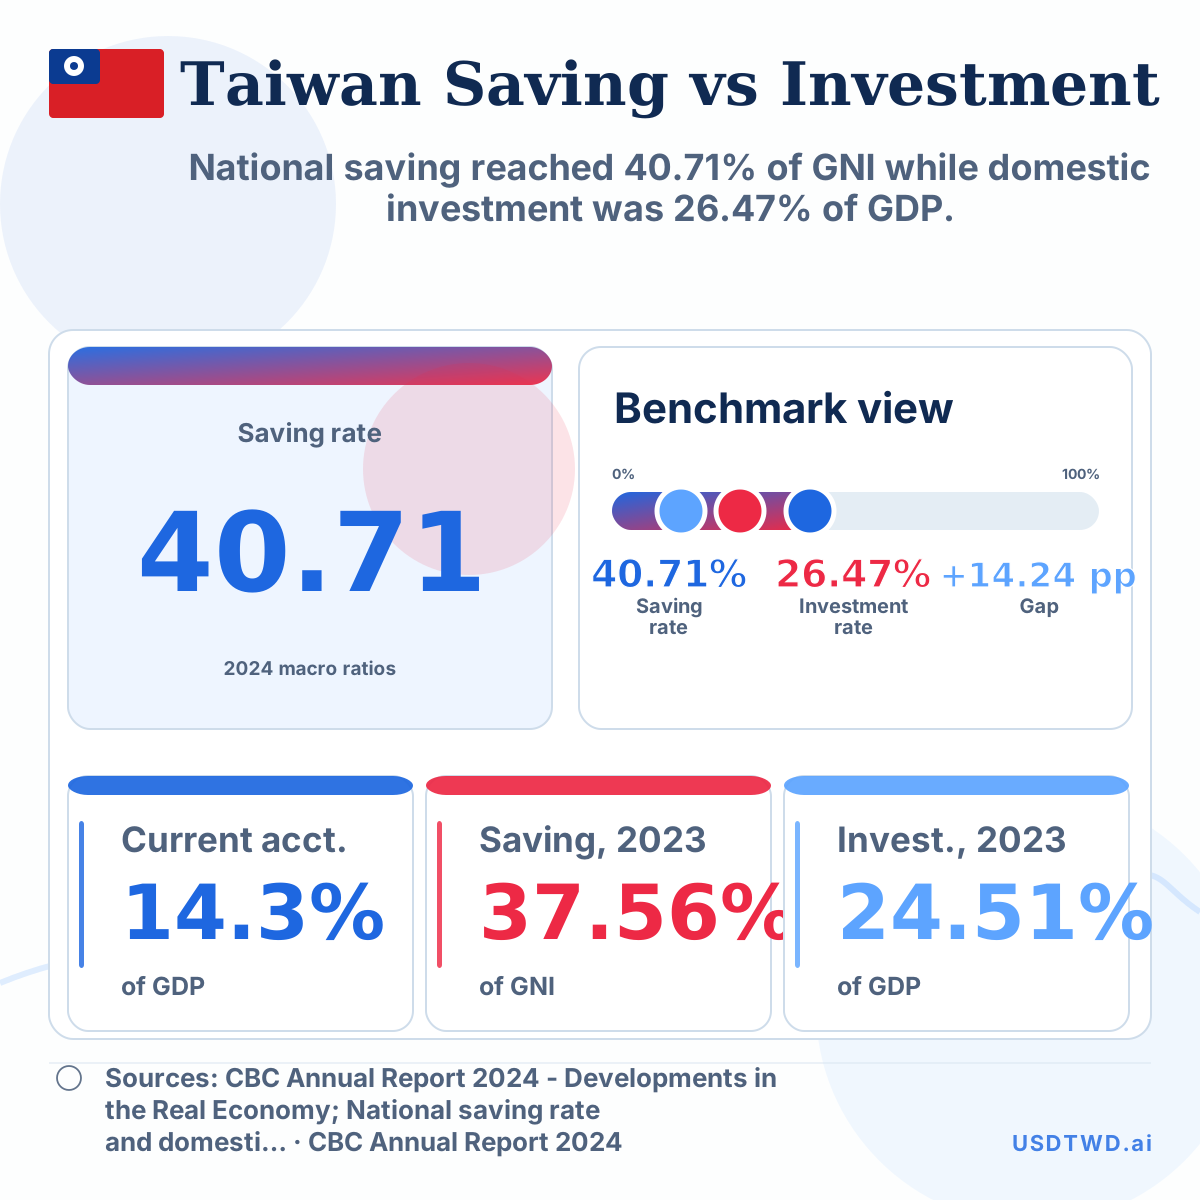
National saving reached 40.71% of GNI while domestic investment was 26.47% of GDP.
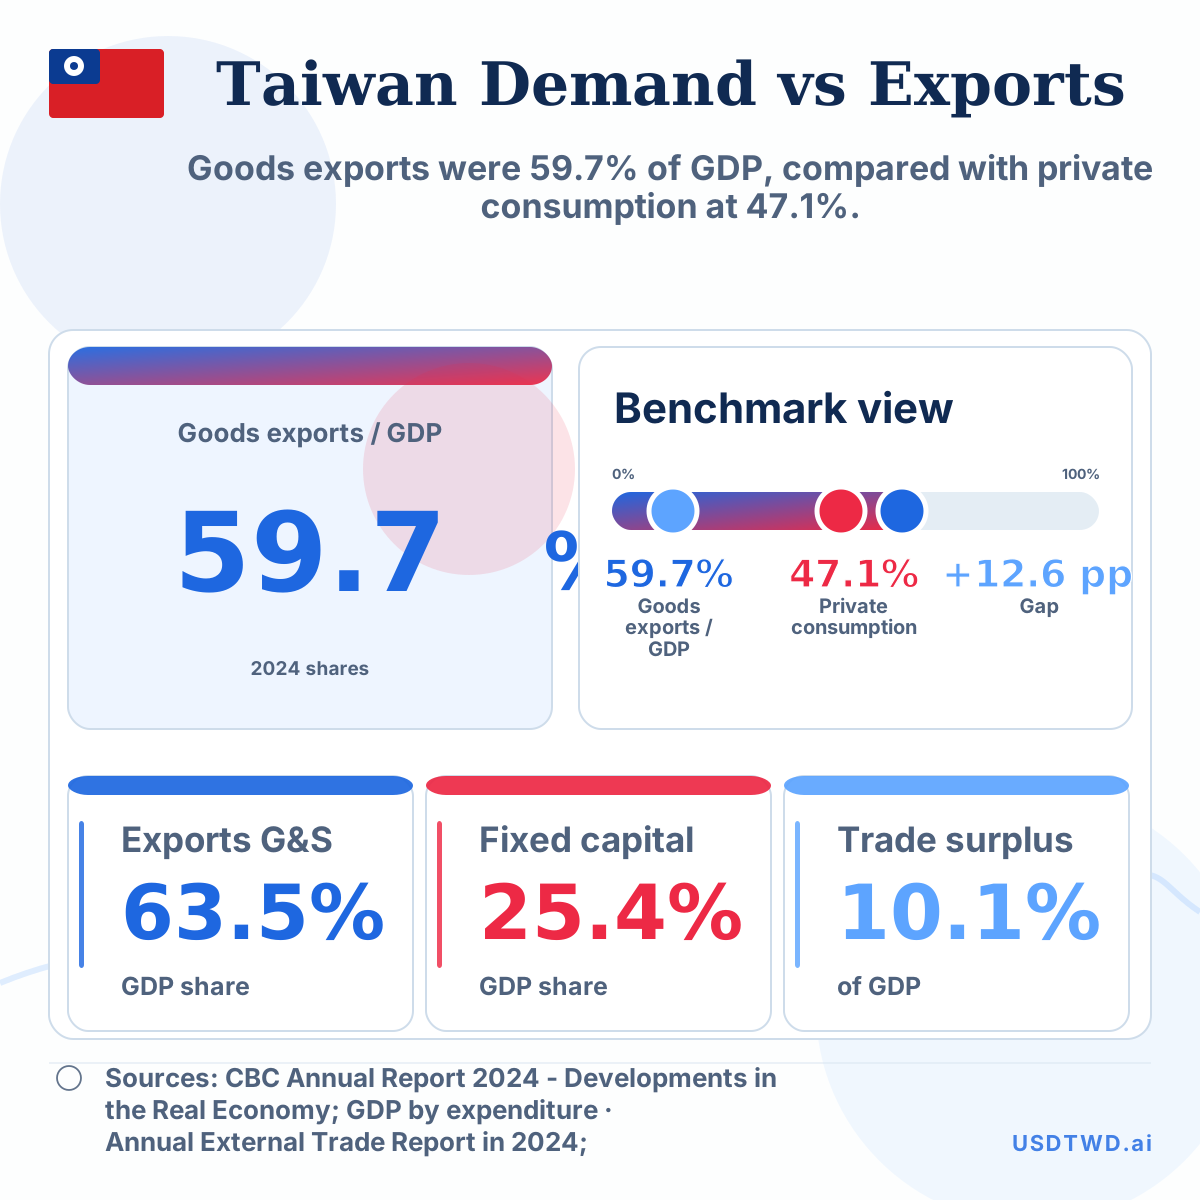
Goods exports were 59.7% of GDP, compared with private consumption at 47.1%.
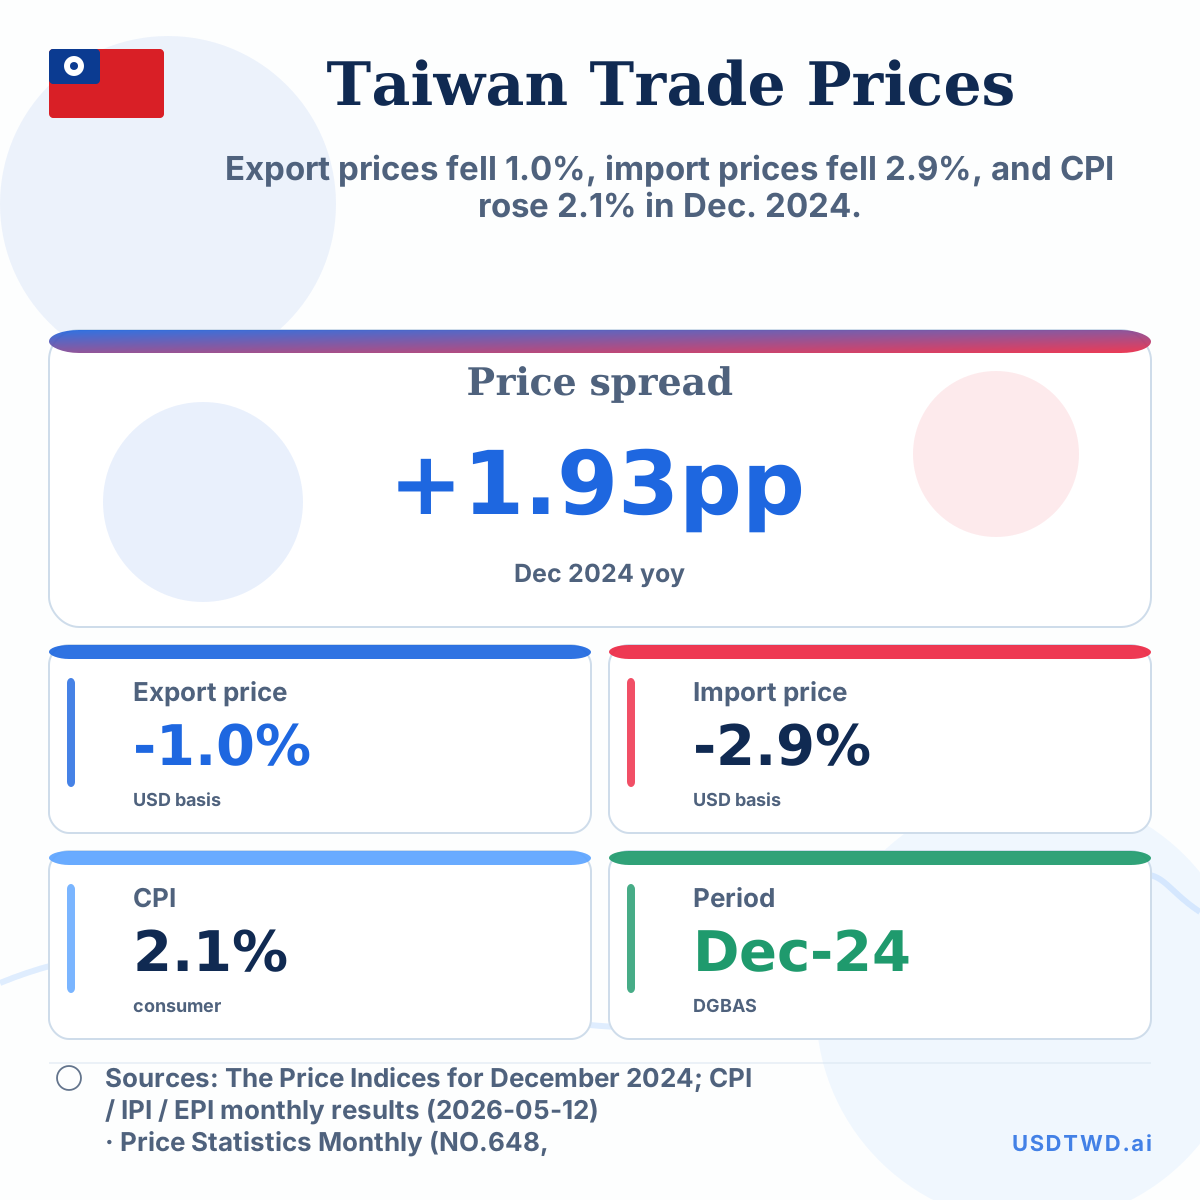
Export prices fell 1.0%, import prices fell 2.9%, and CPI rose 2.1% in Dec. 2024.
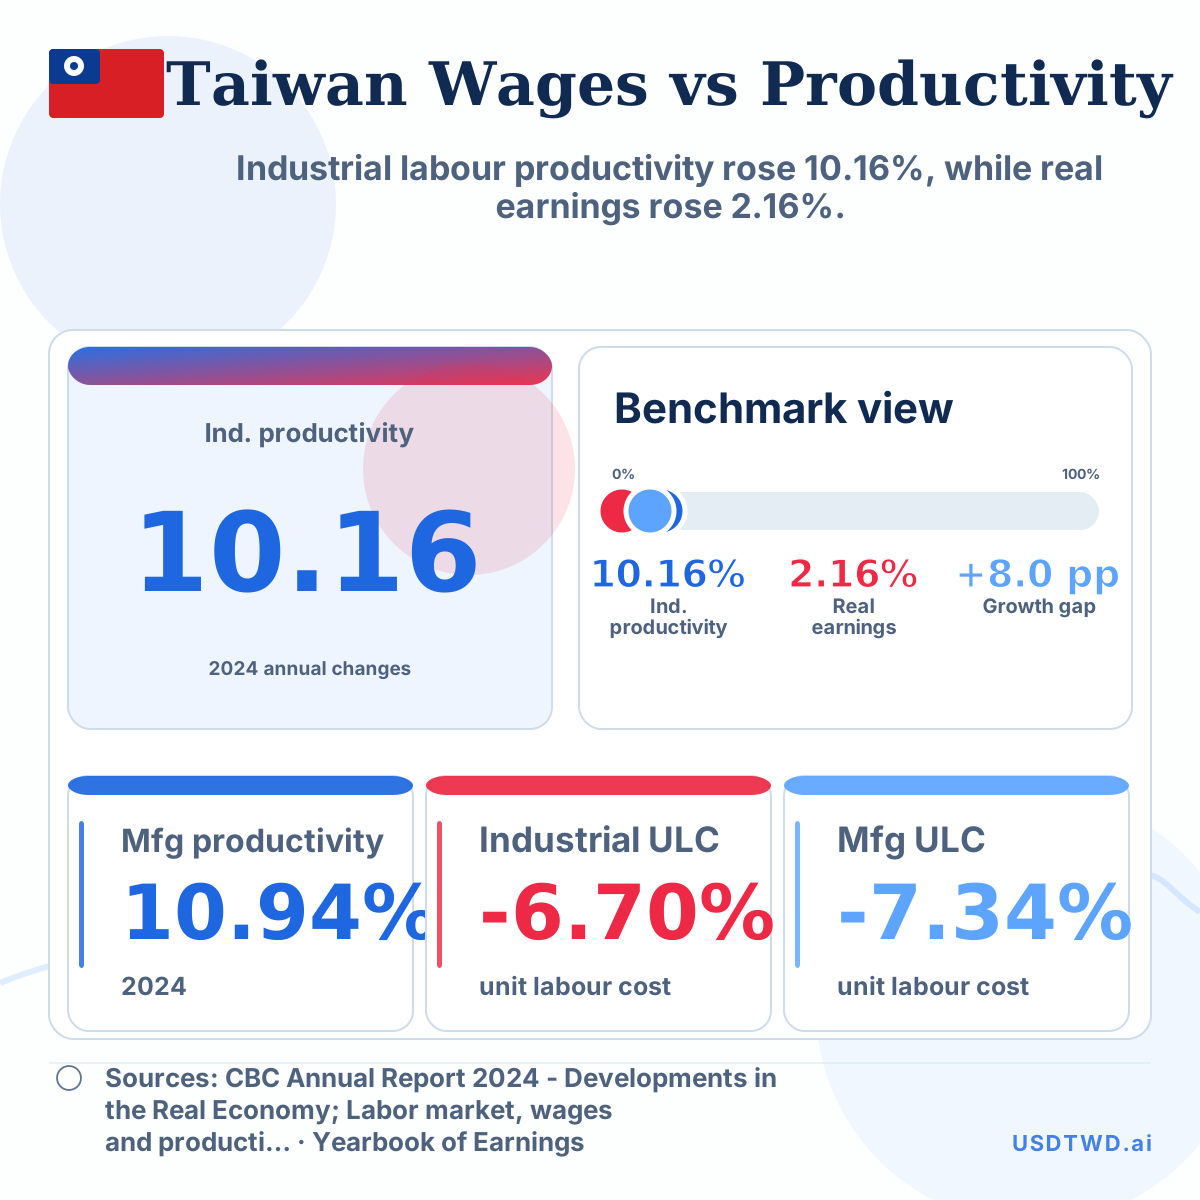
Industrial labour productivity rose 10.16%, while real earnings rose 2.16%.
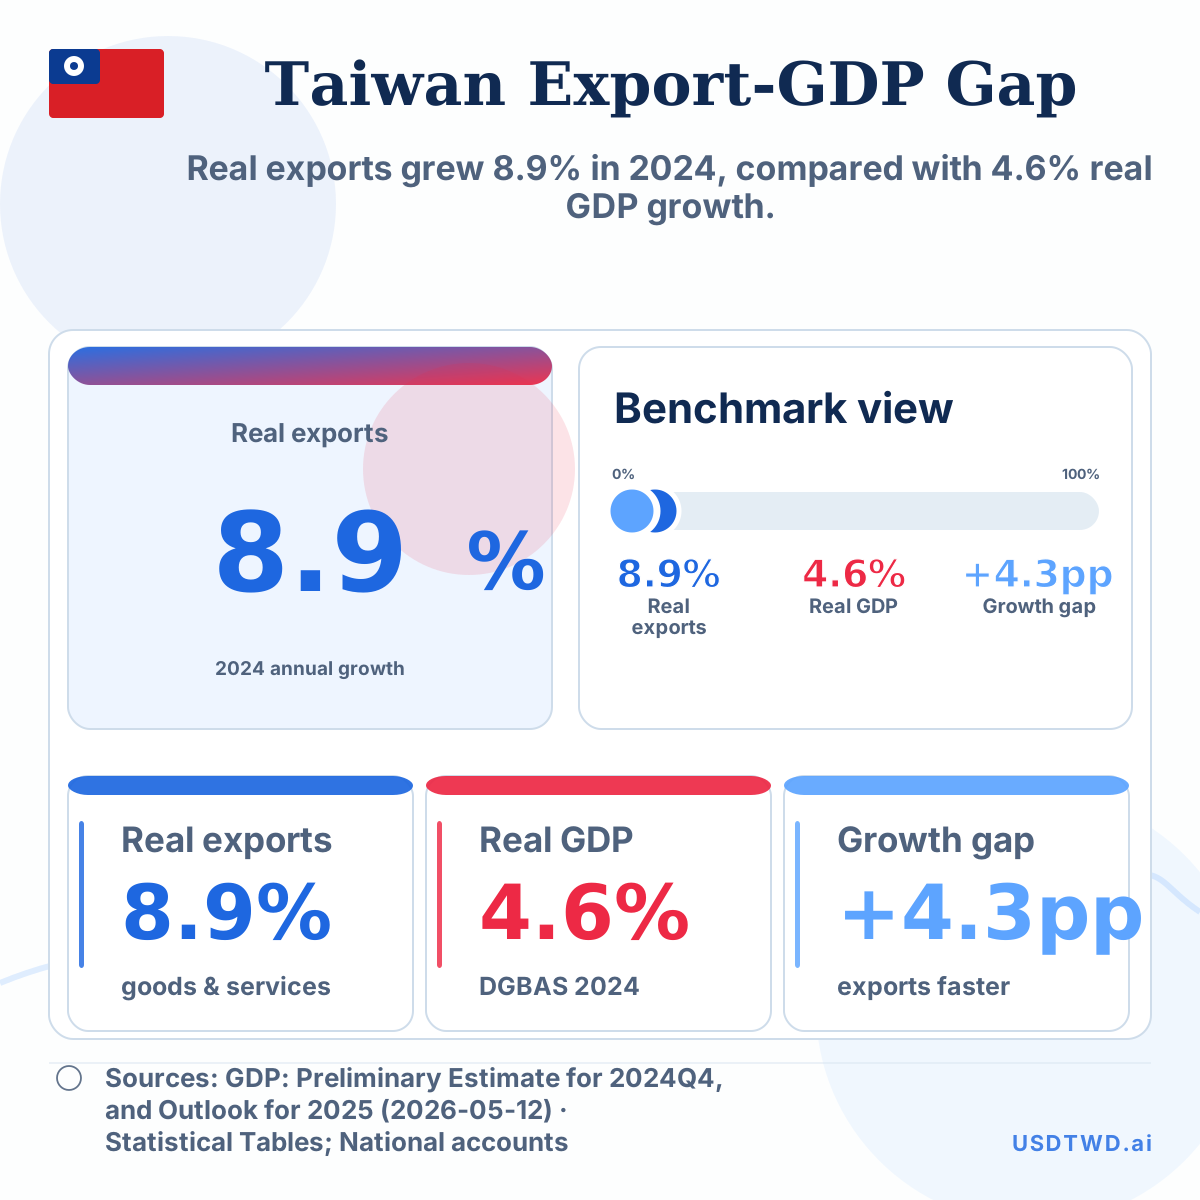
Real exports grew 8.9% in 2024, compared with 4.6% real GDP growth.
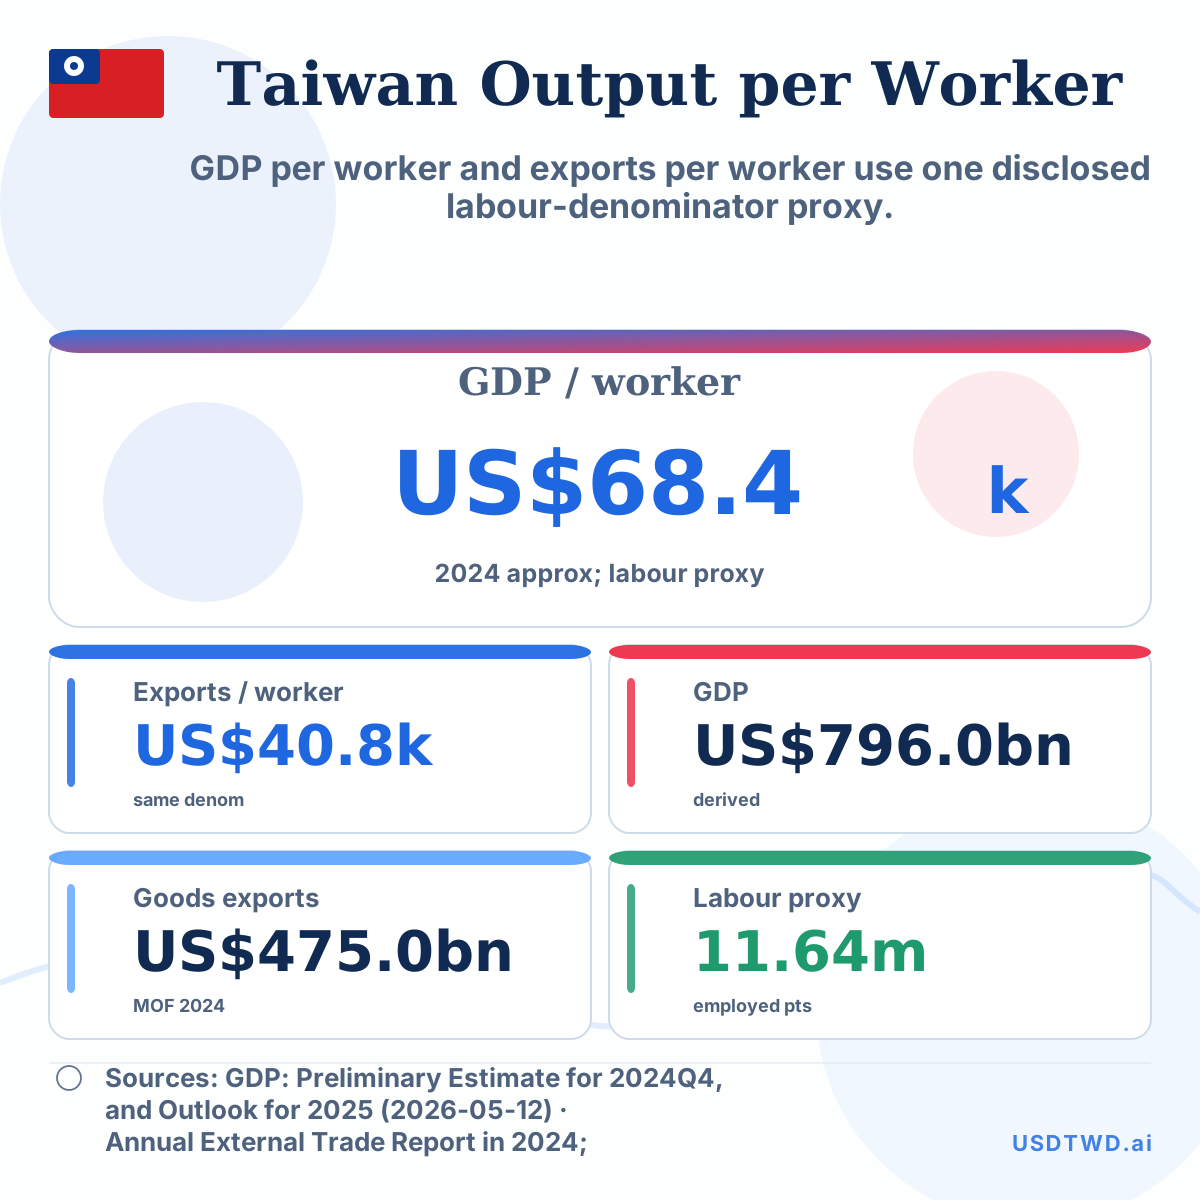
GDP per worker and exports per worker use one disclosed labour-denominator proxy.
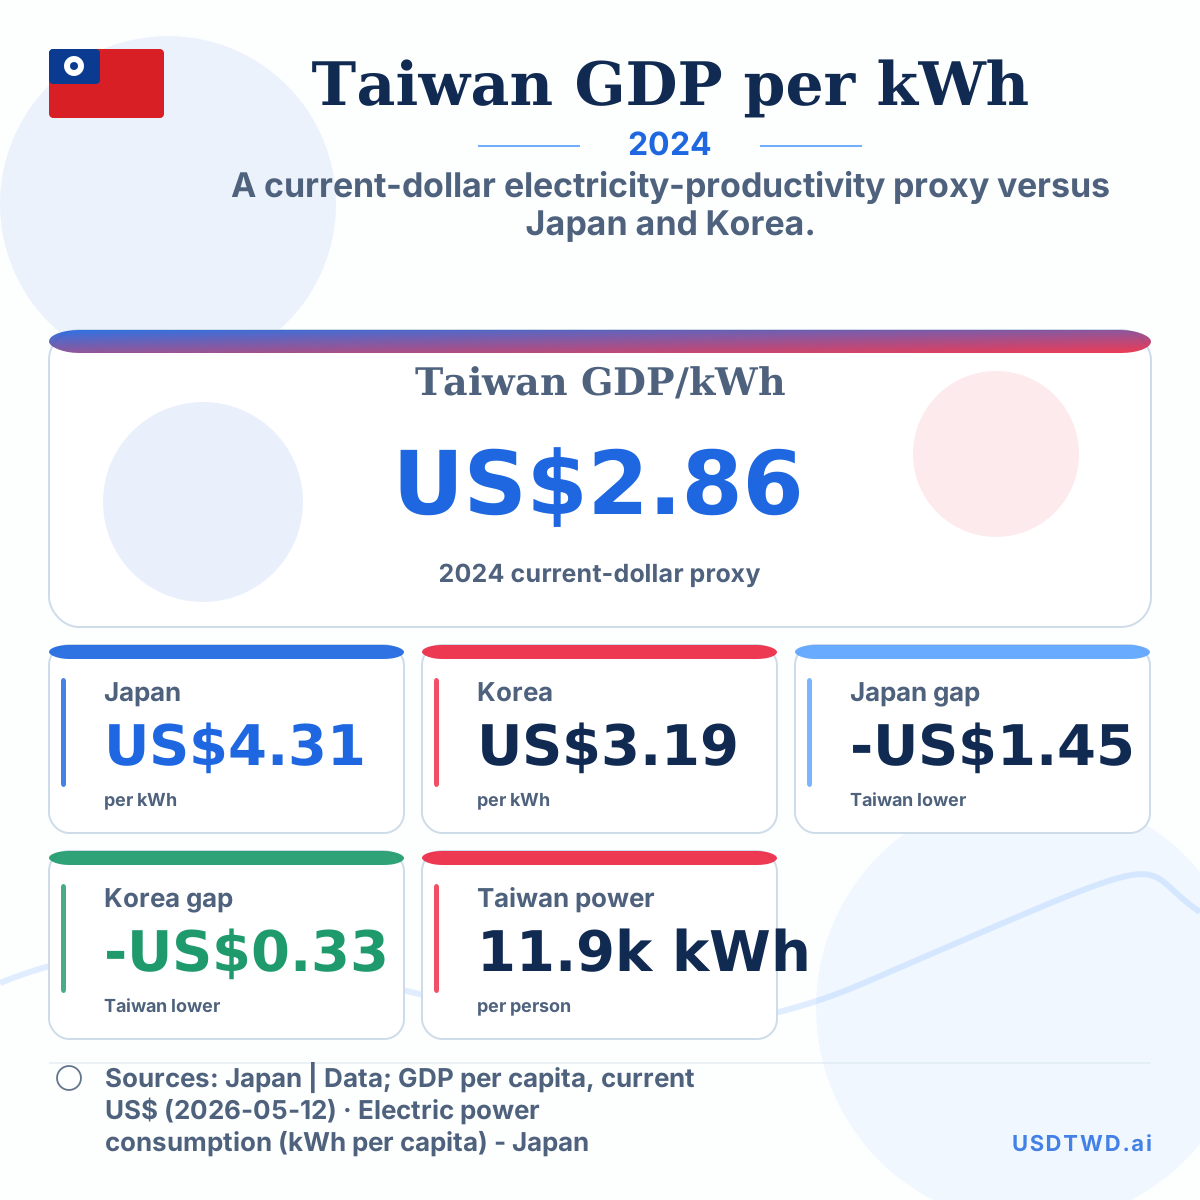
A current-dollar electricity-productivity proxy versus Japan and Korea.
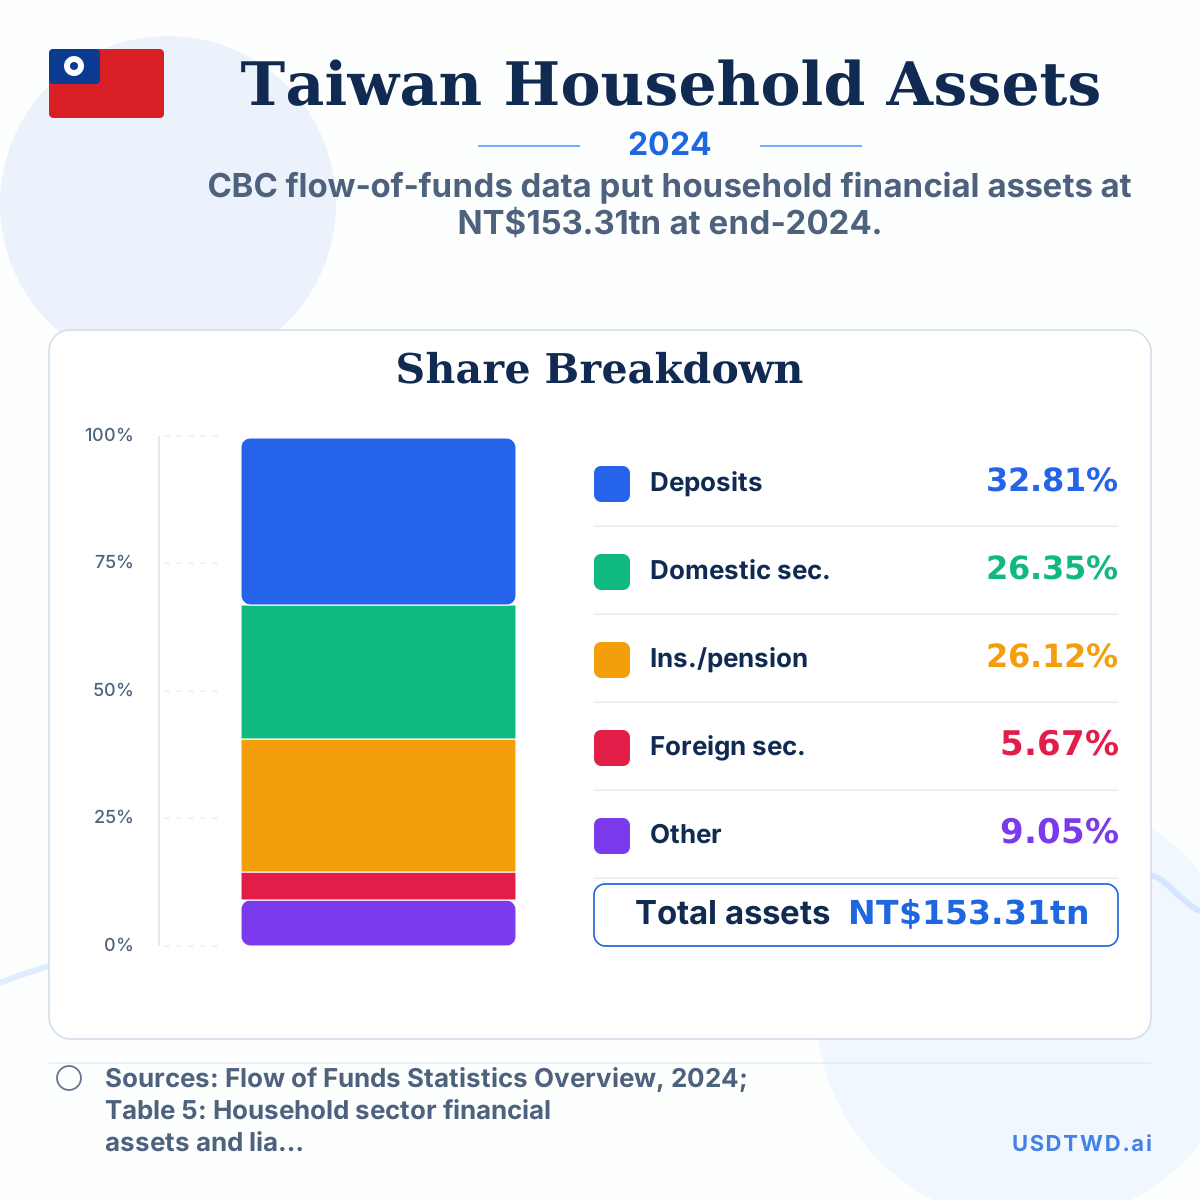
CBC flow-of-funds data put household financial assets at NT$153.31tn at end-2024.
Insurance Bureau data show foreign investments at 67.94% of life insurers’ invested assets.
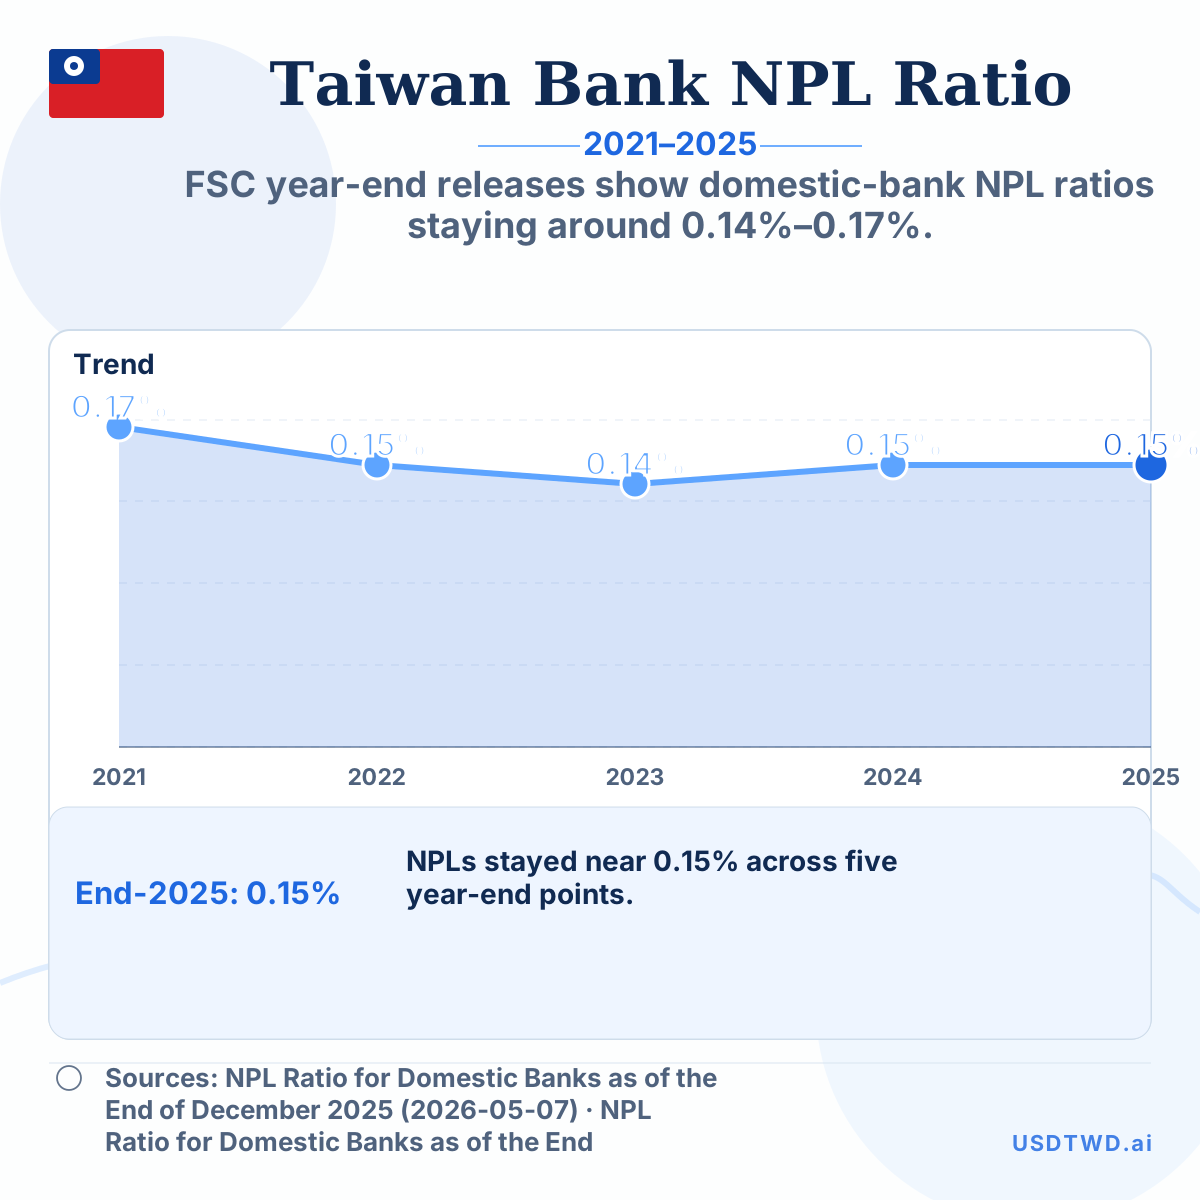
FSC year-end releases show domestic-bank NPL ratios staying around 0.14%–0.17%.