Start with these Economy graphics
Newest source-labelled pages in this topic, with source blocks and data tables attached.
Graphics archive
GDP, trade, productivity, income, industrial structure and national-accounts graphics that explain Taiwan’s macro engine.
Newest source-labelled pages in this topic, with source blocks and data tables attached.
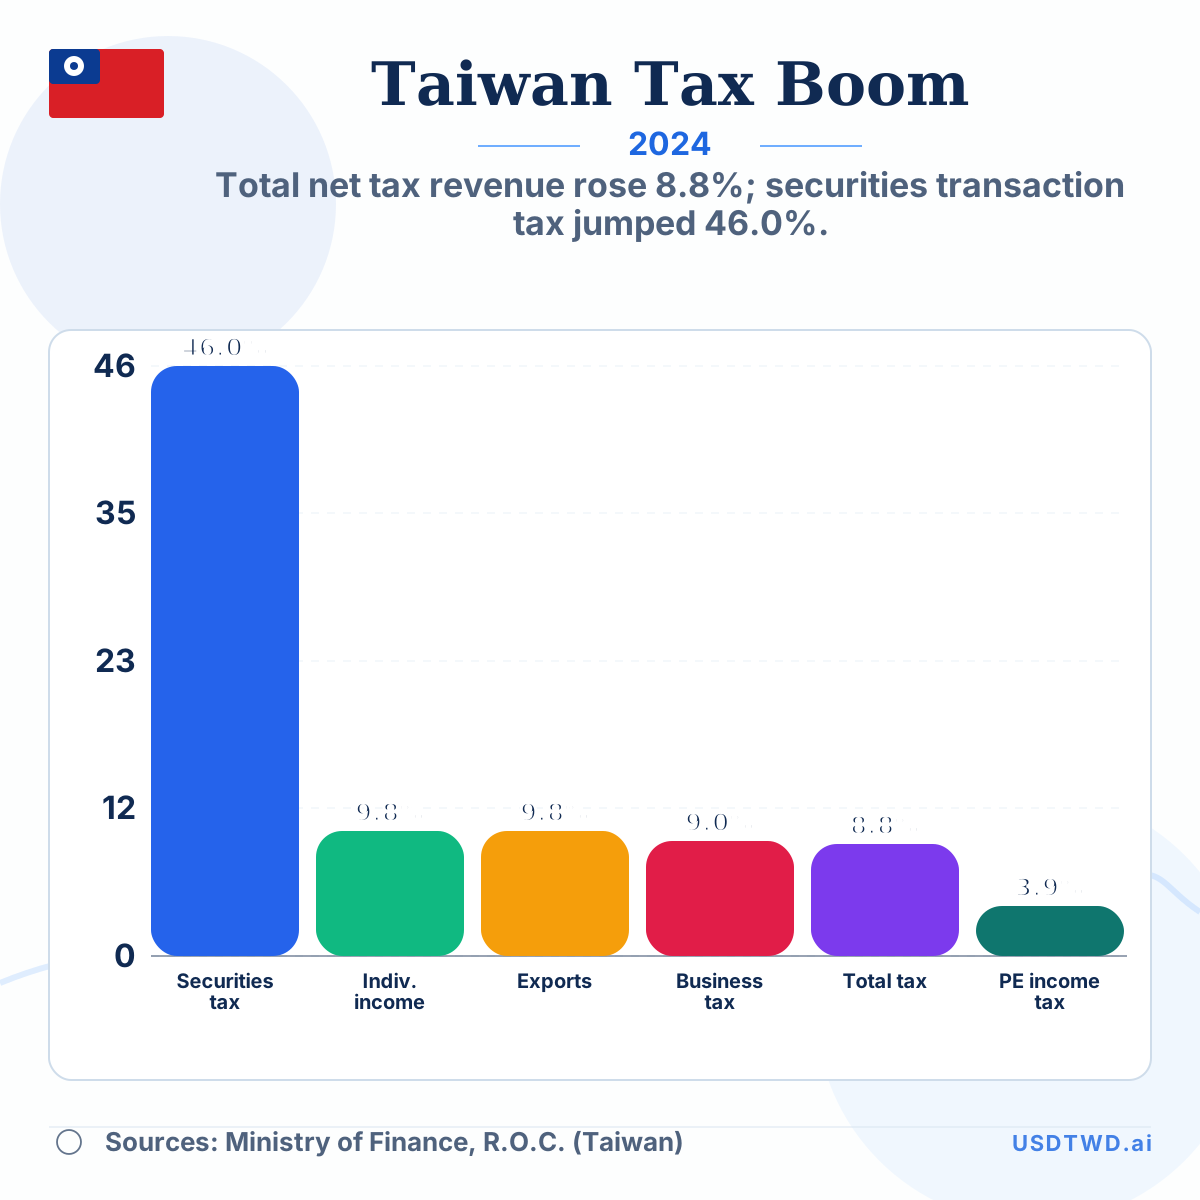
Total net tax revenue rose 8.8%; securities transaction tax jumped 46.0%.
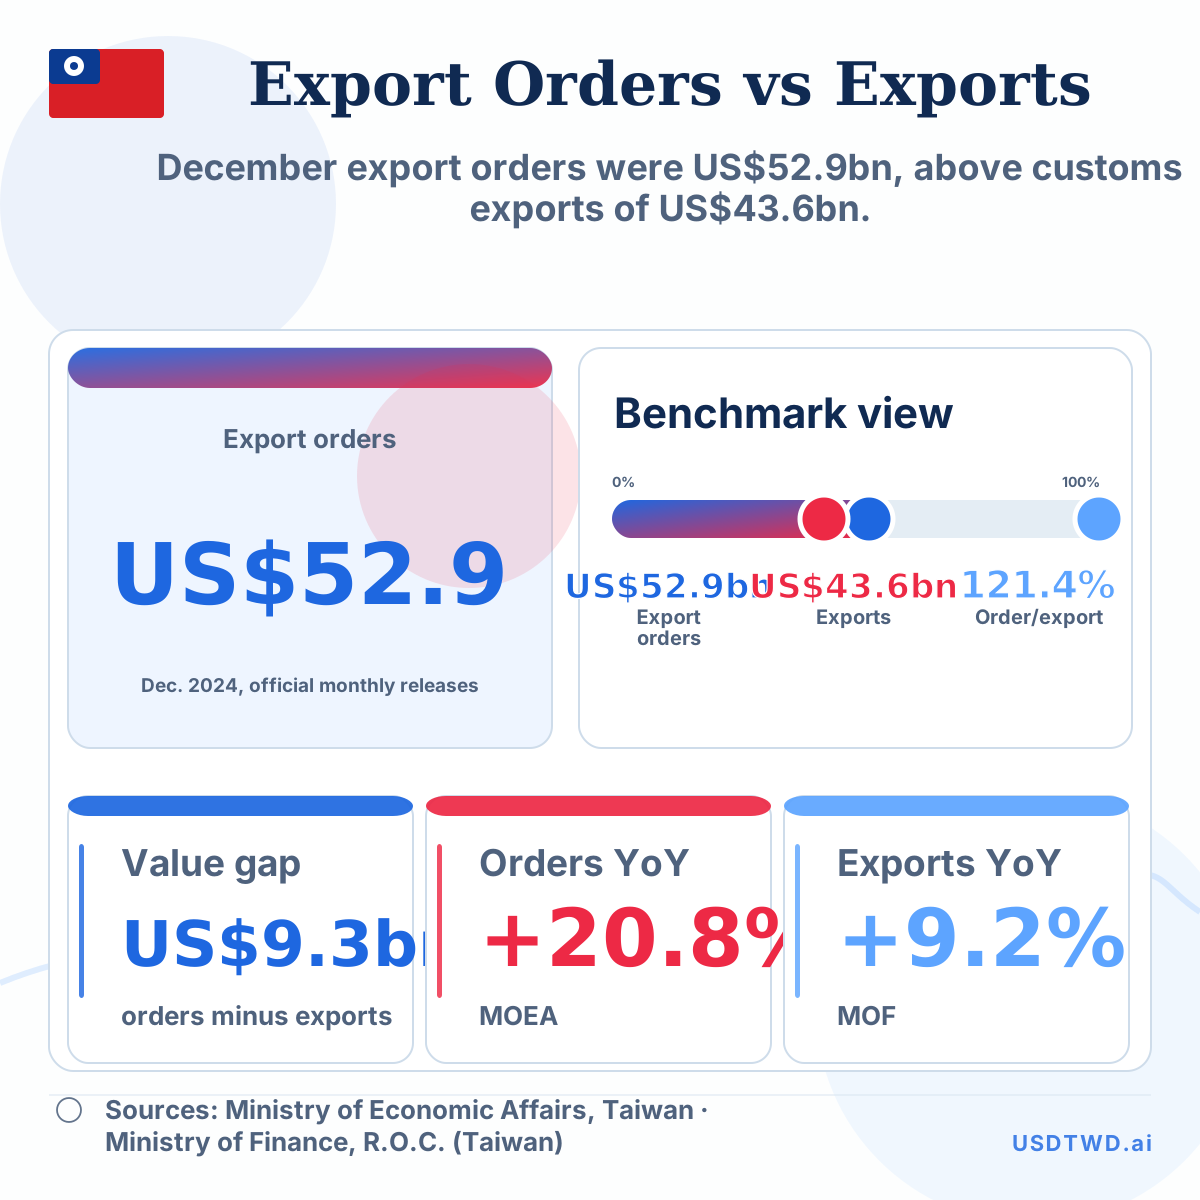
December export orders were US$52.9bn, above customs exports of US$43.6bn.
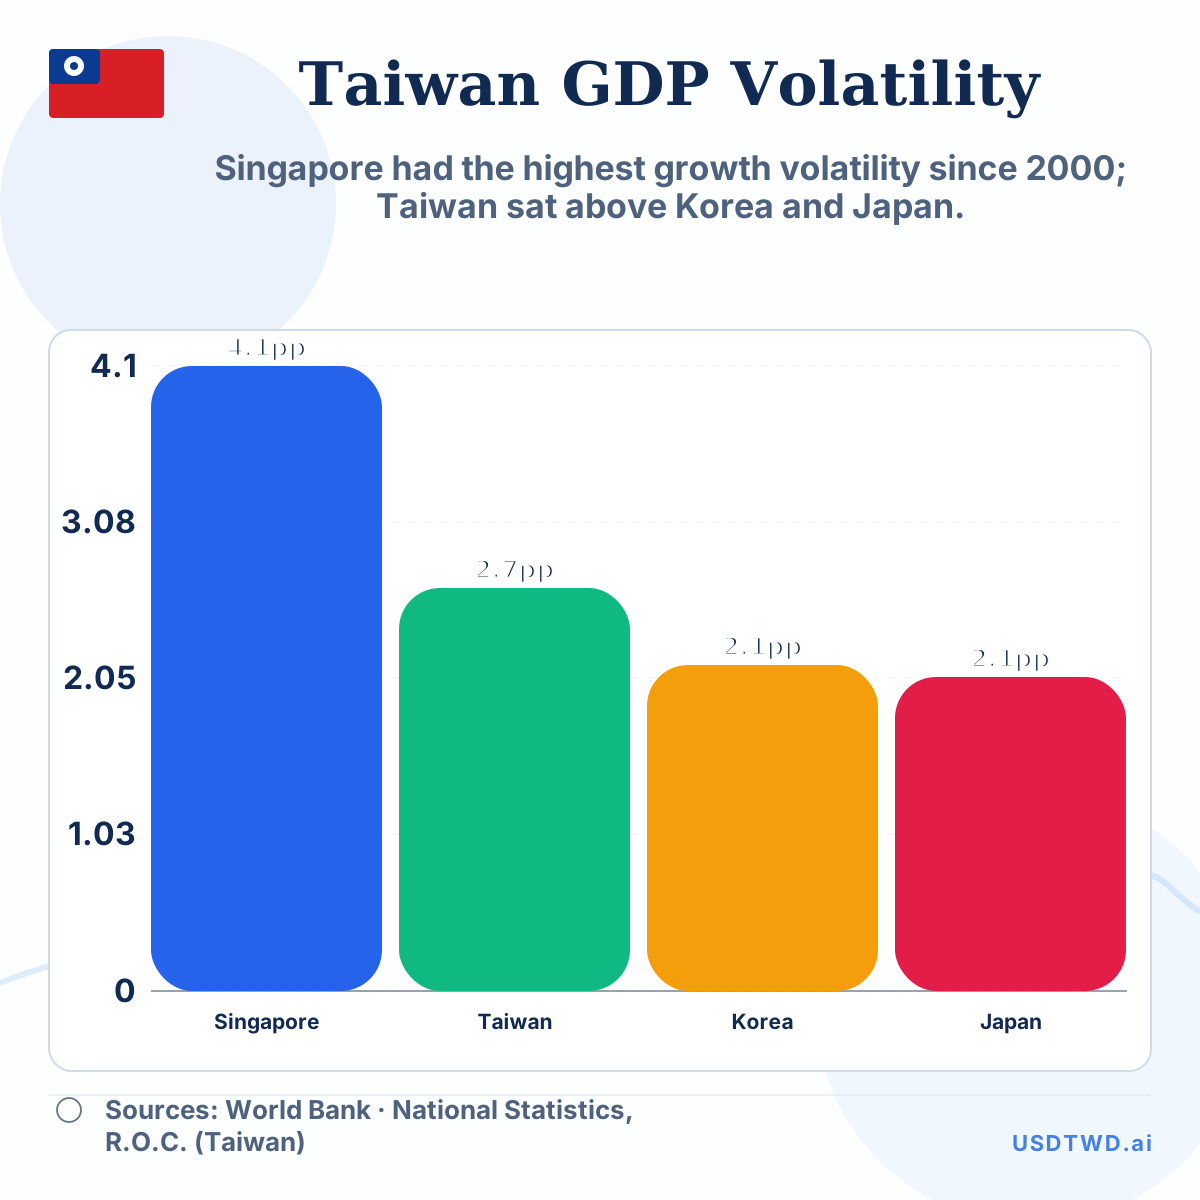
Singapore had the highest growth volatility since 2000; Taiwan sat above Korea and Japan.
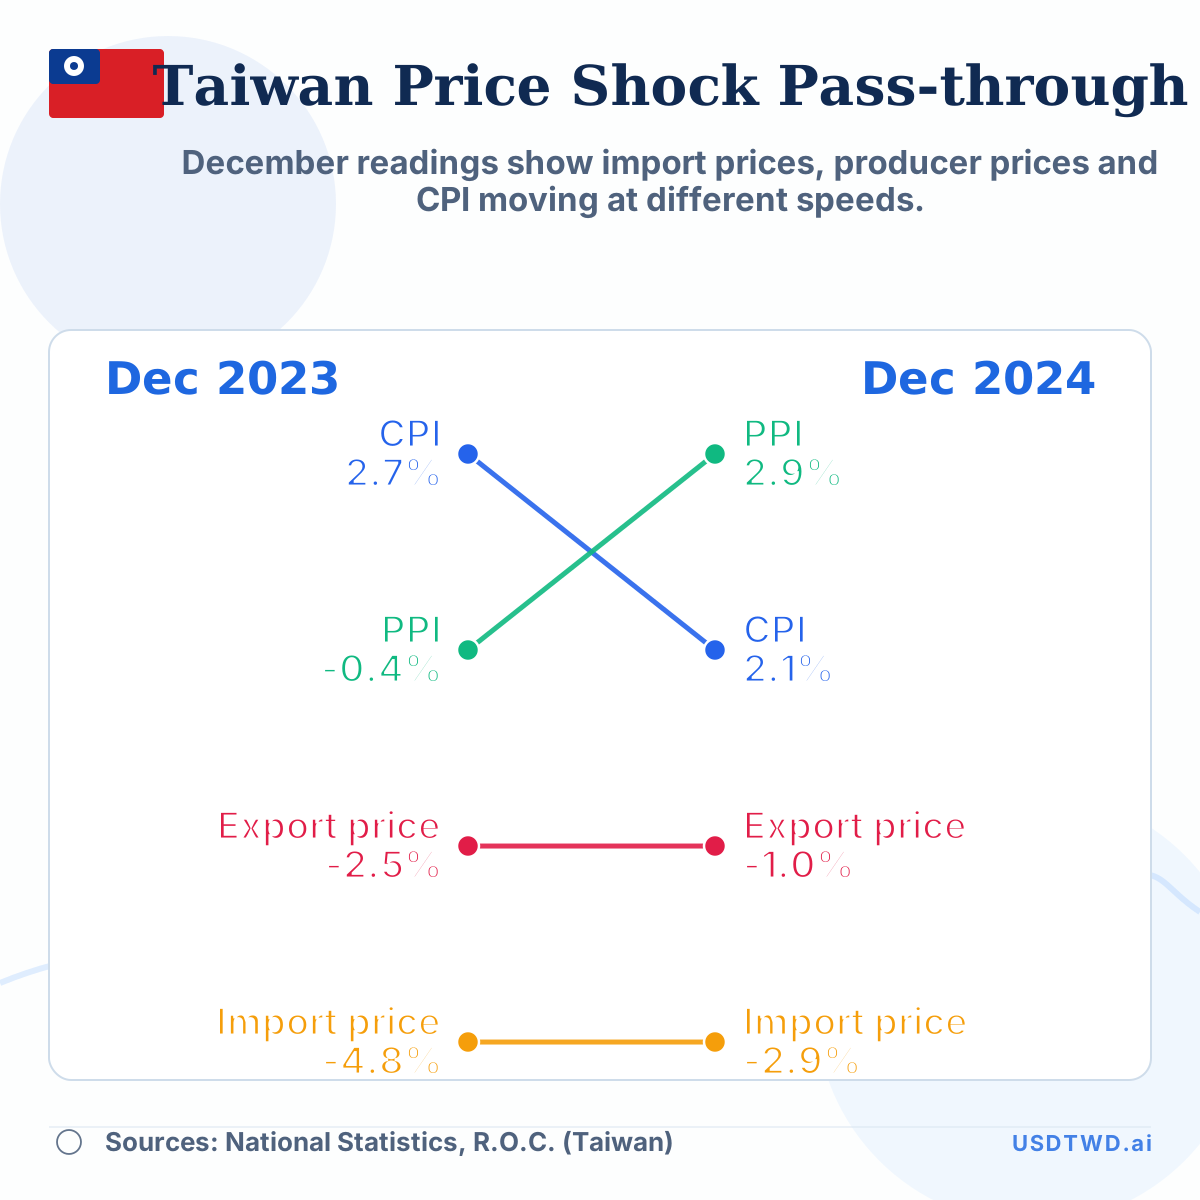
December readings show import prices, producer prices and CPI moving at different speeds.
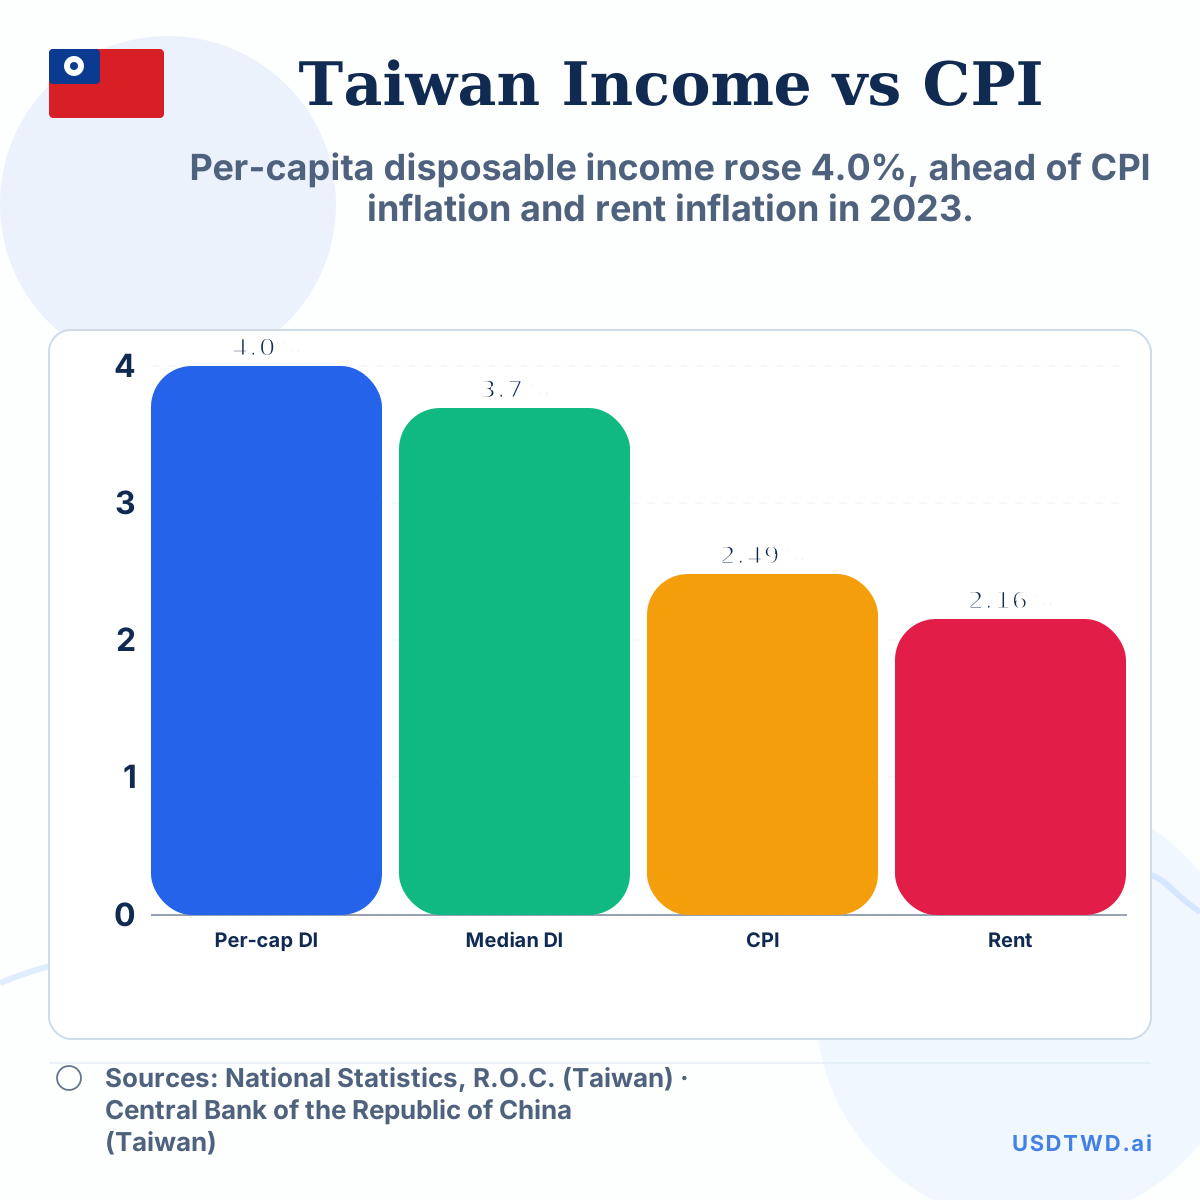
Per-capita disposable income rose 4.0%, ahead of CPI inflation and rent inflation in 2023.
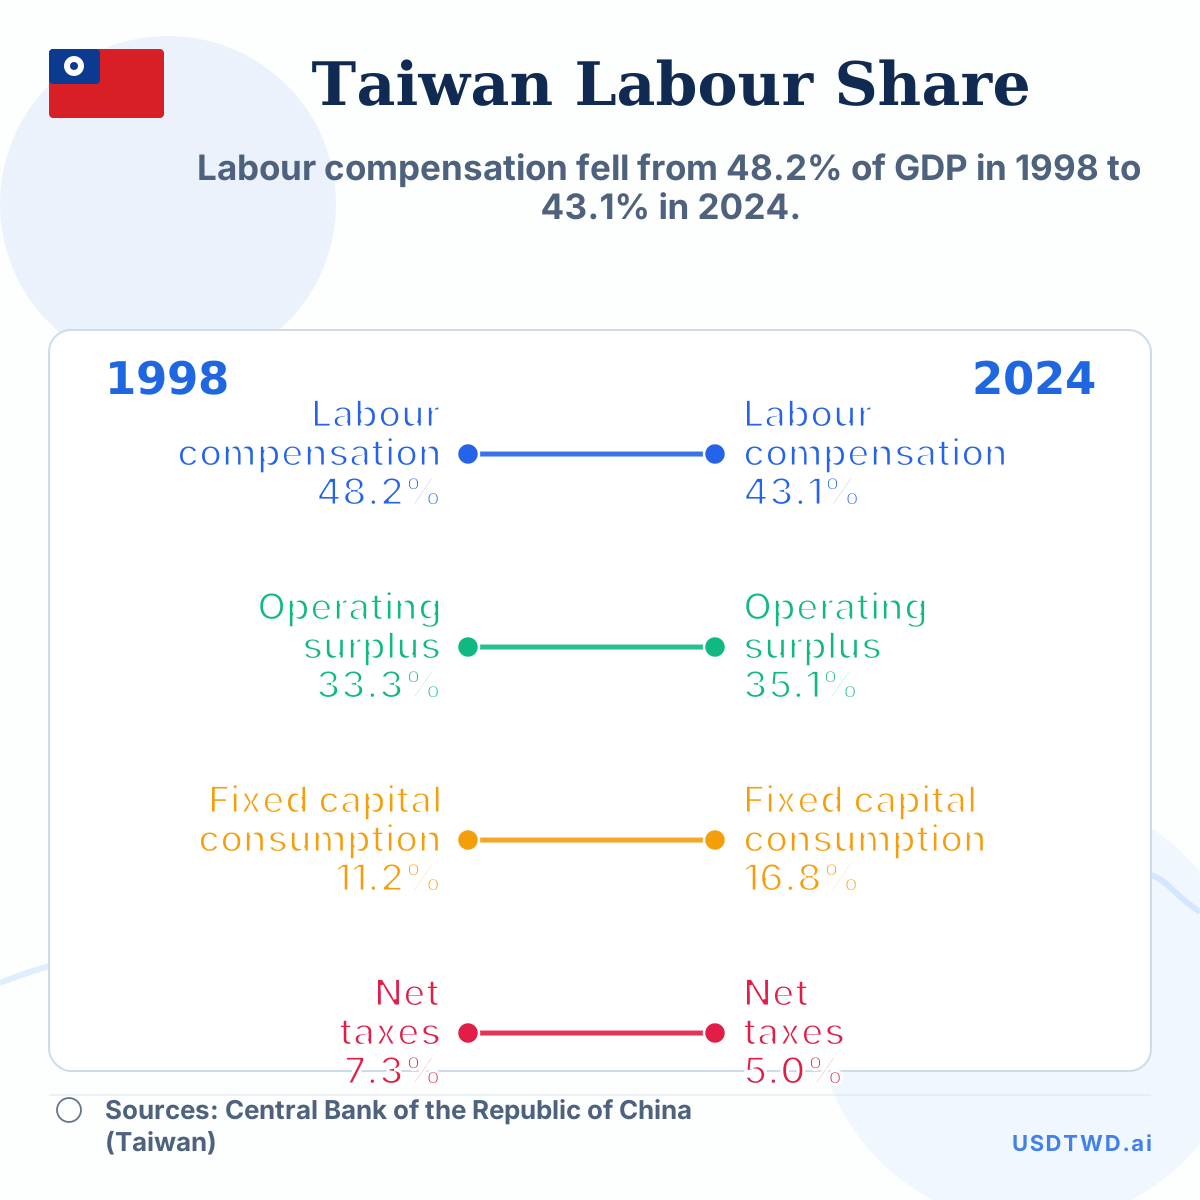
Labour compensation fell from 48.2% of GDP in 1998 to 43.1% in 2024.
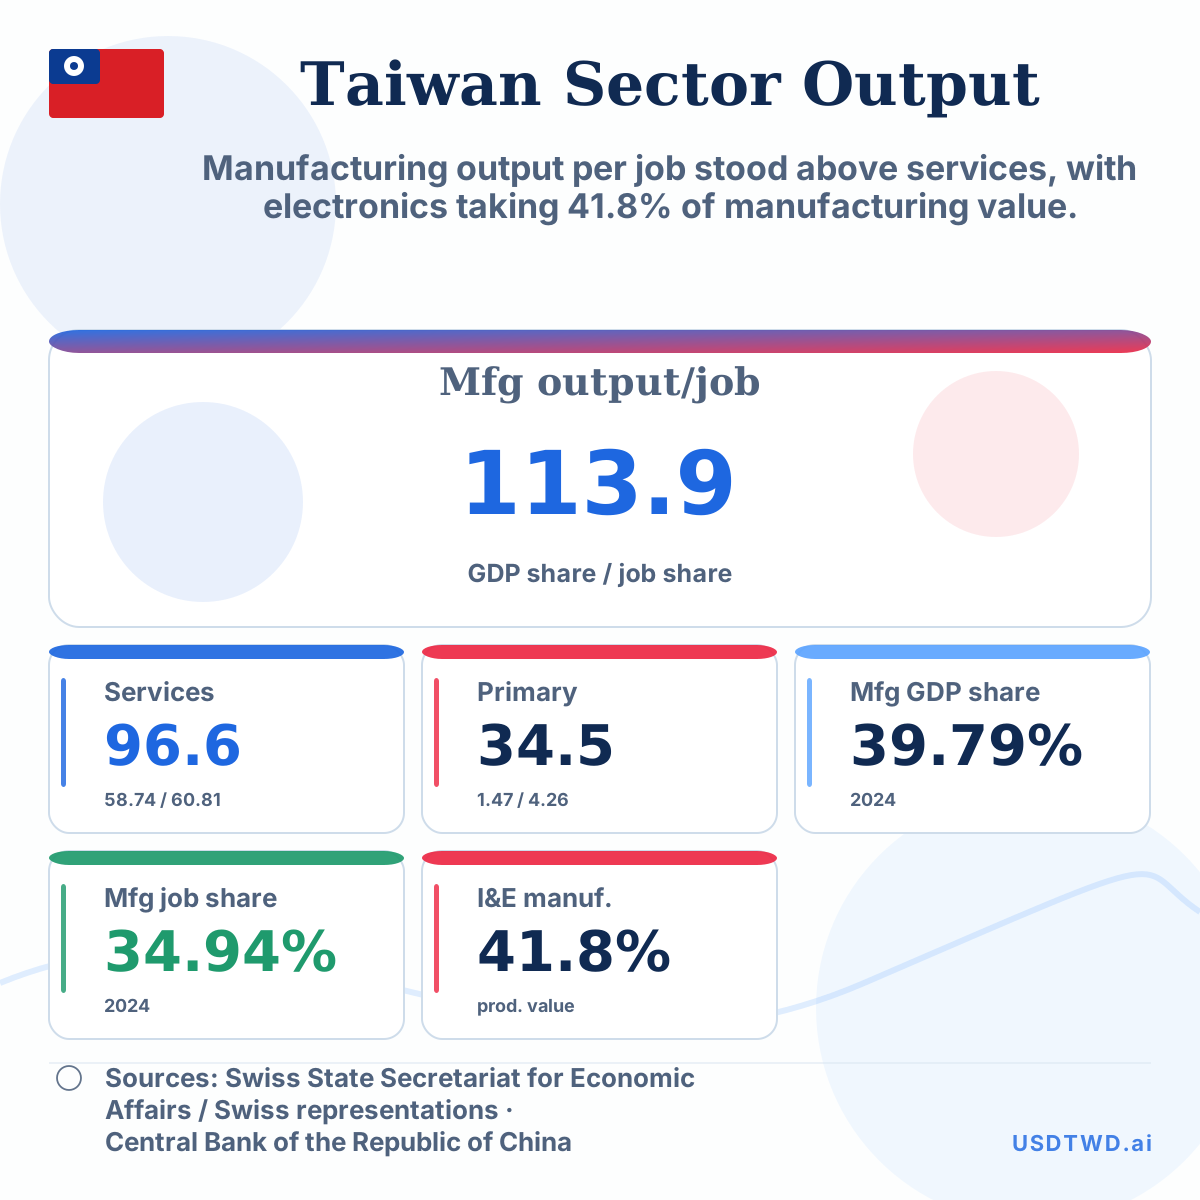
Manufacturing output per job stood above services, with electronics taking 41.8% of manufacturing value.
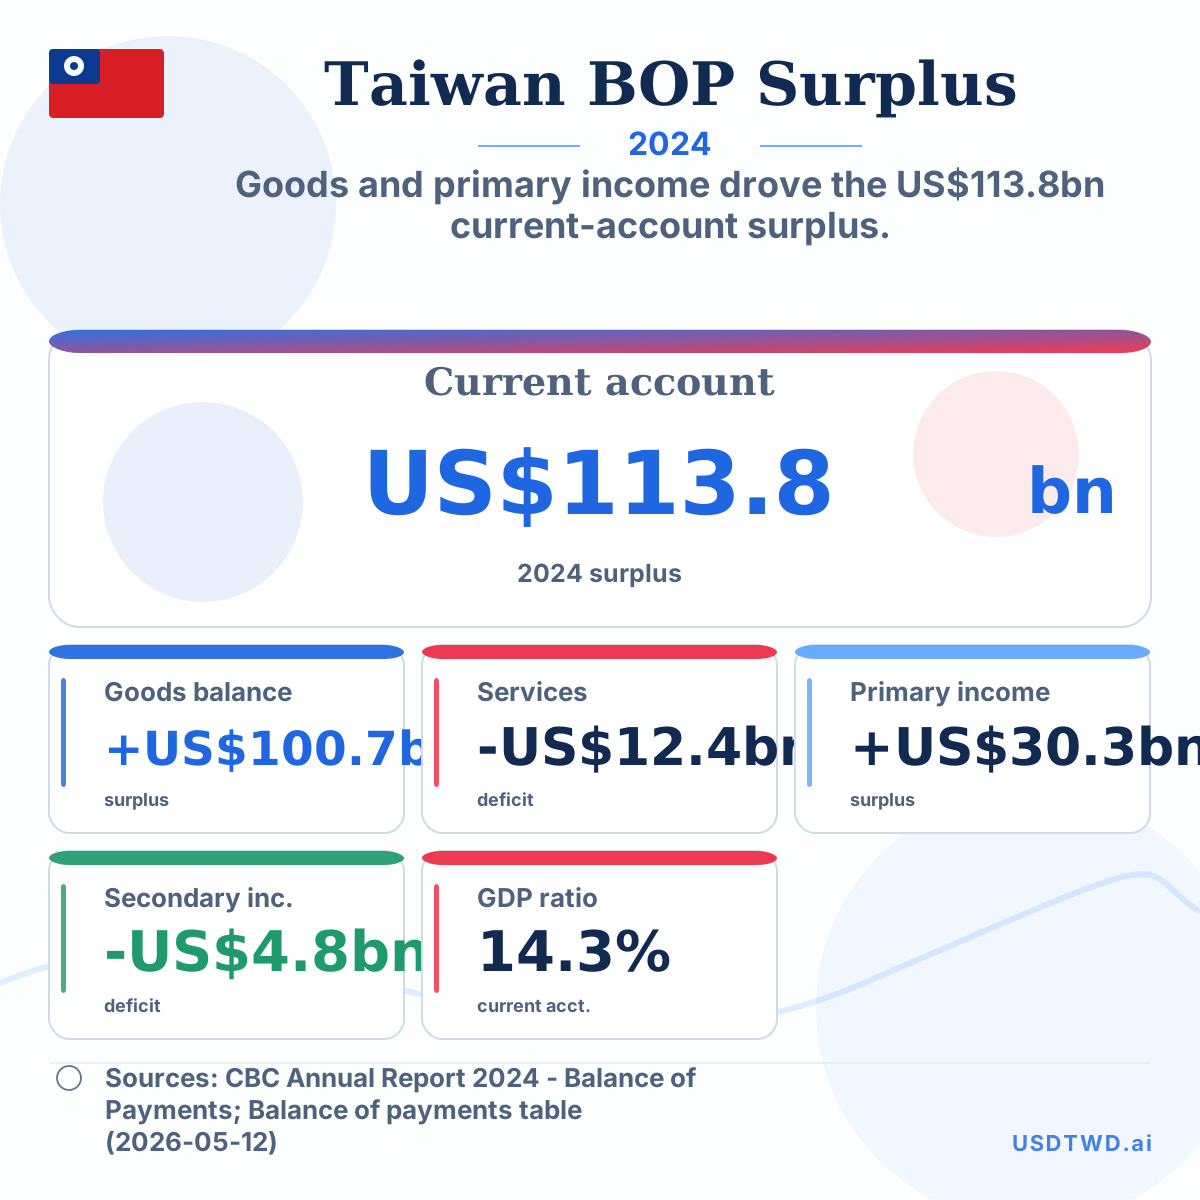
Goods and primary income drove the US$113.8bn current-account surplus.
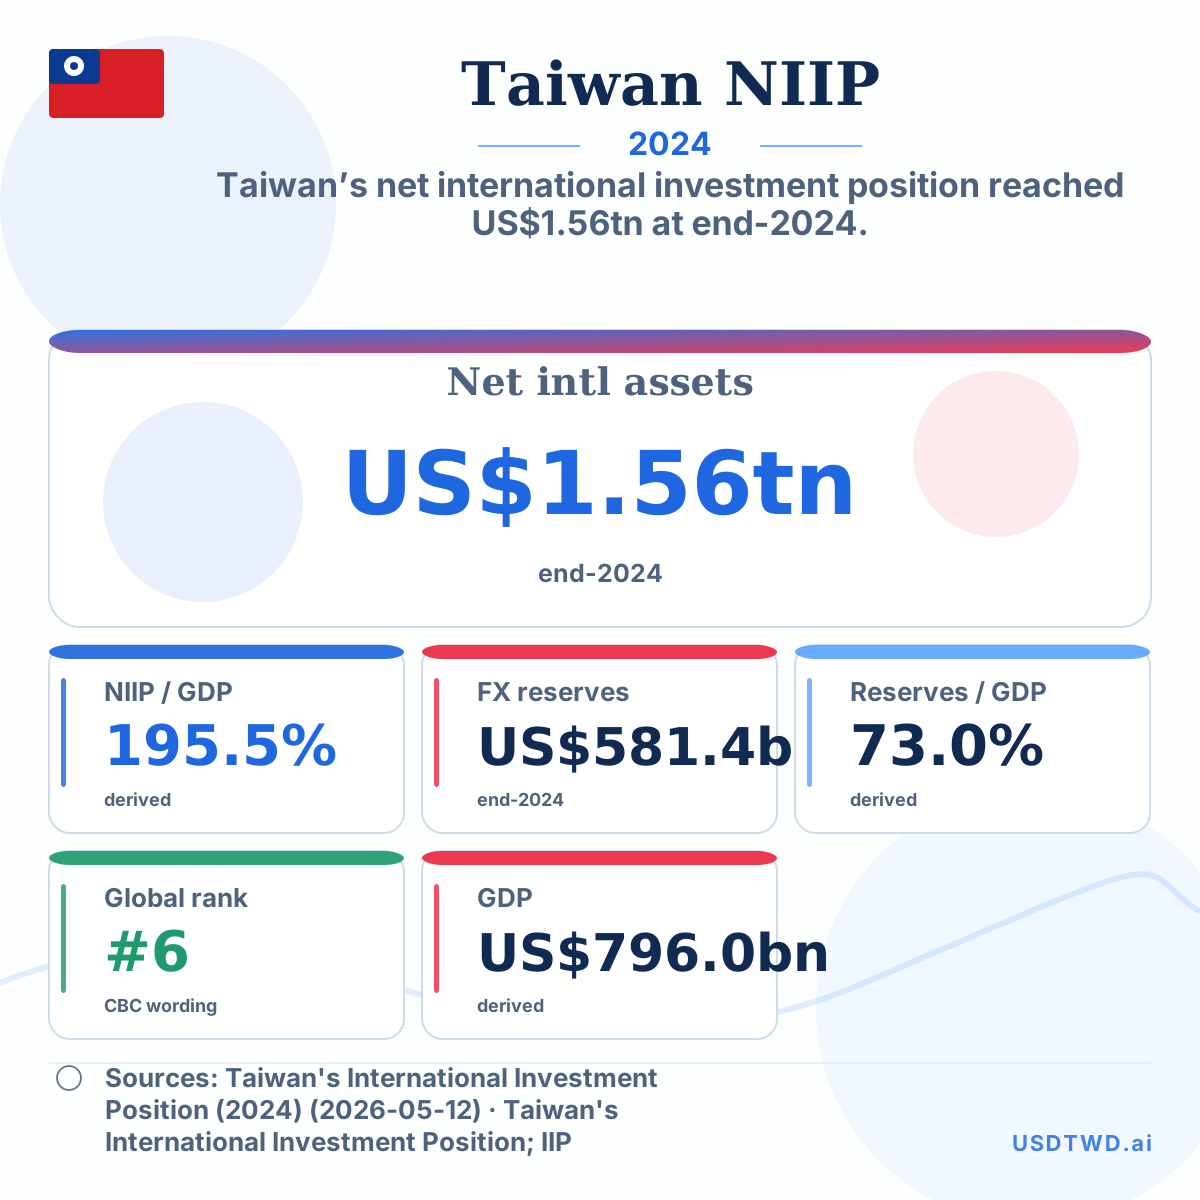
Taiwan’s net international investment position reached US$1.56tn at end-2024.
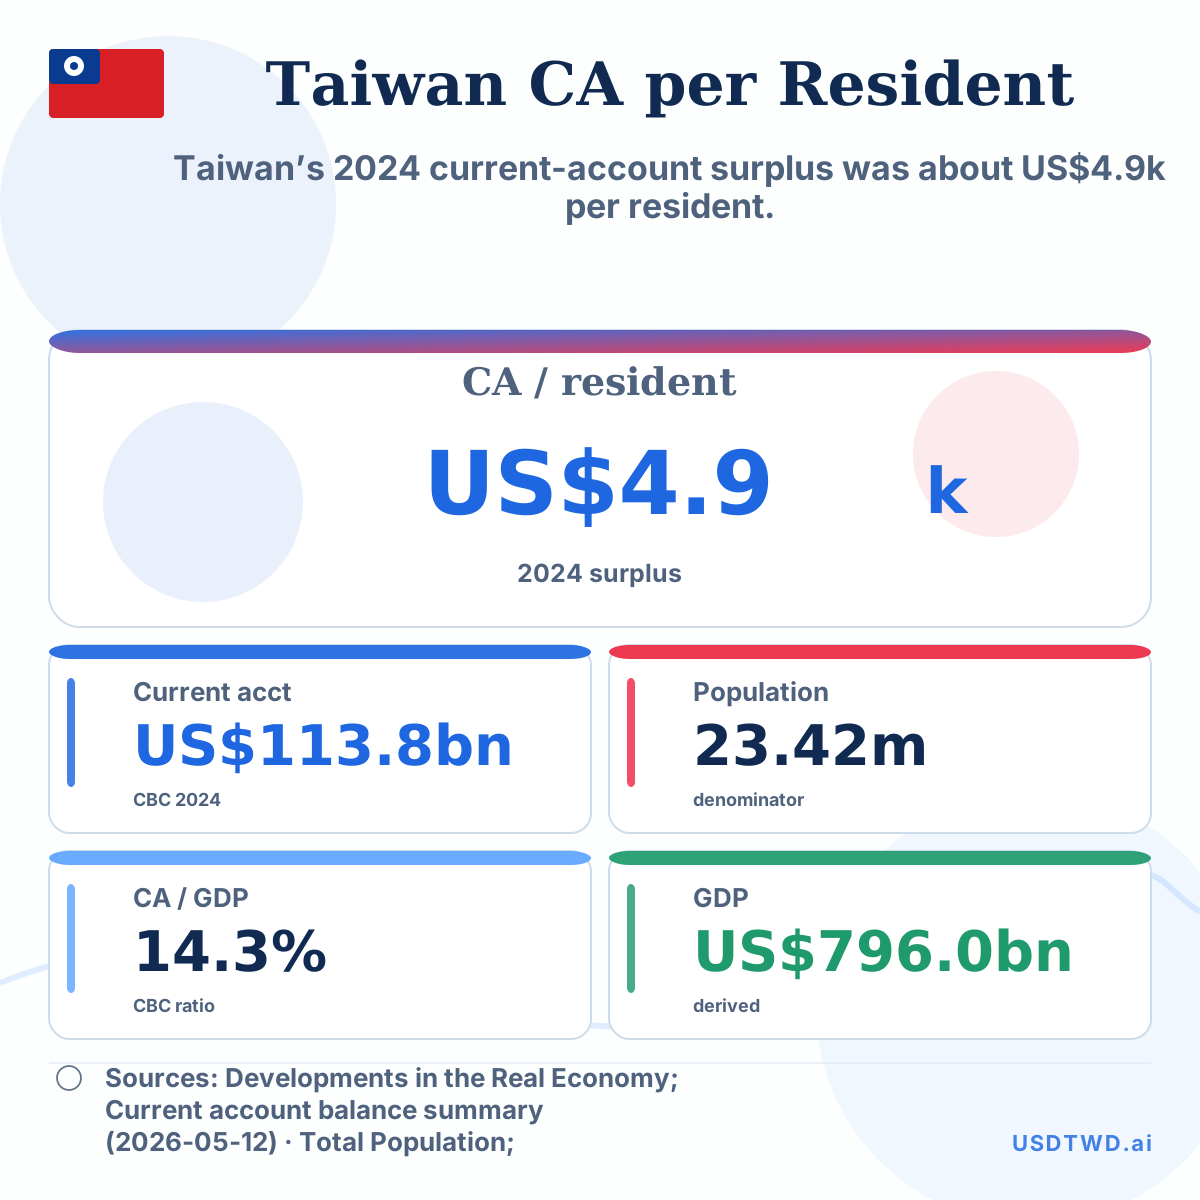
Taiwan’s 2024 current-account surplus was about US$4.9k per resident.