Start with these Economy graphics
Newest source-labelled pages in this topic, with source blocks and data tables attached.
Graphics archive
GDP, trade, productivity, income, industrial structure and national-accounts graphics that explain Taiwan’s macro engine.
Newest source-labelled pages in this topic, with source blocks and data tables attached.
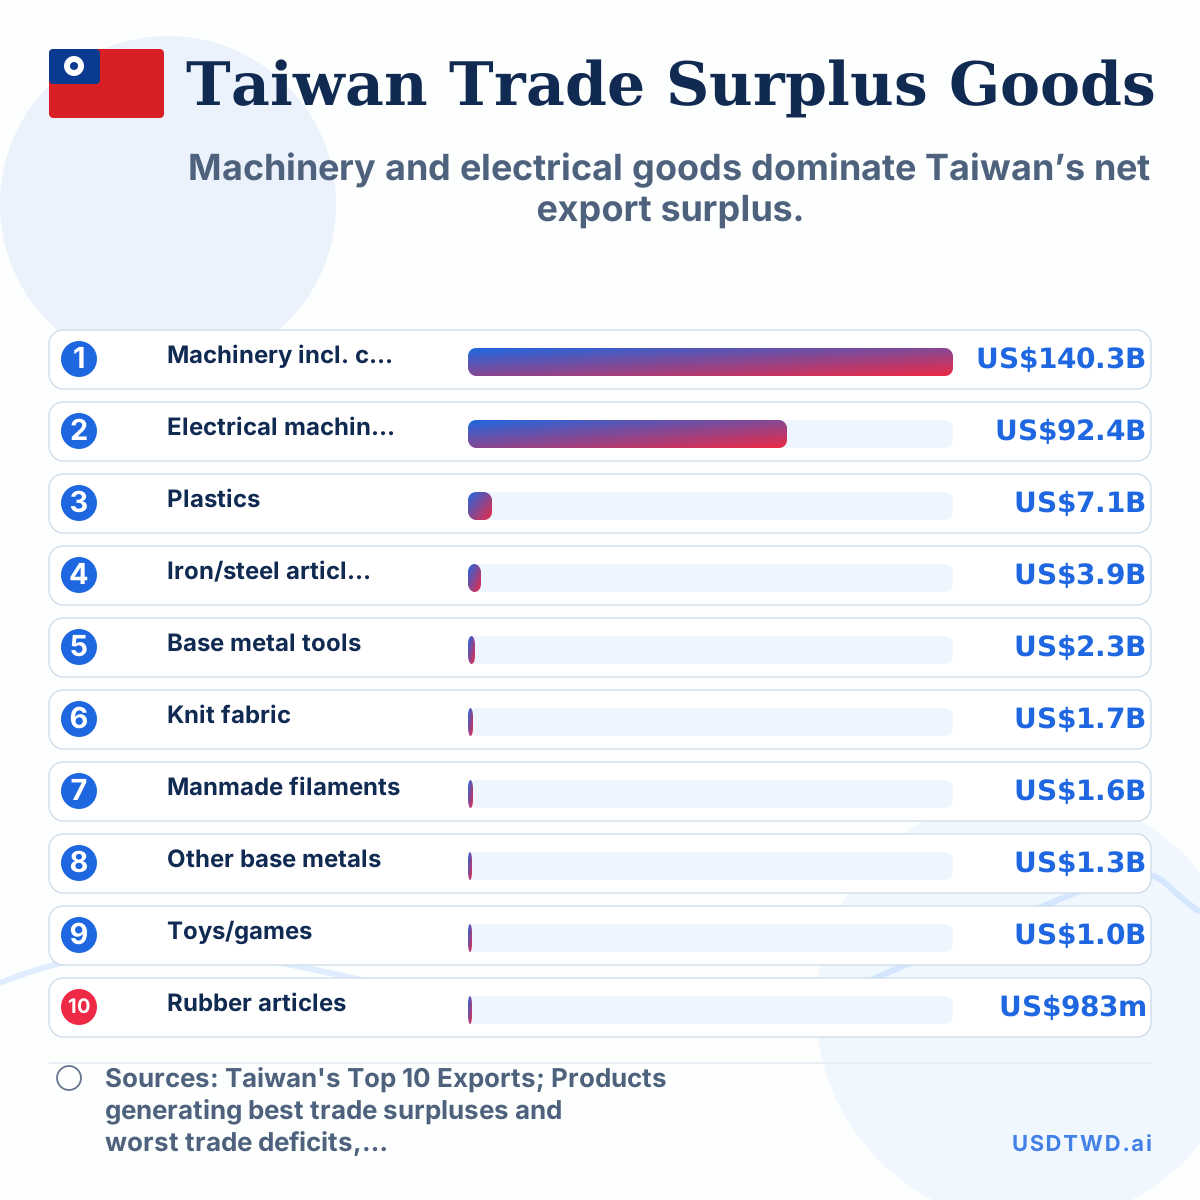
Machinery and electrical goods dominate Taiwan’s net export surplus.
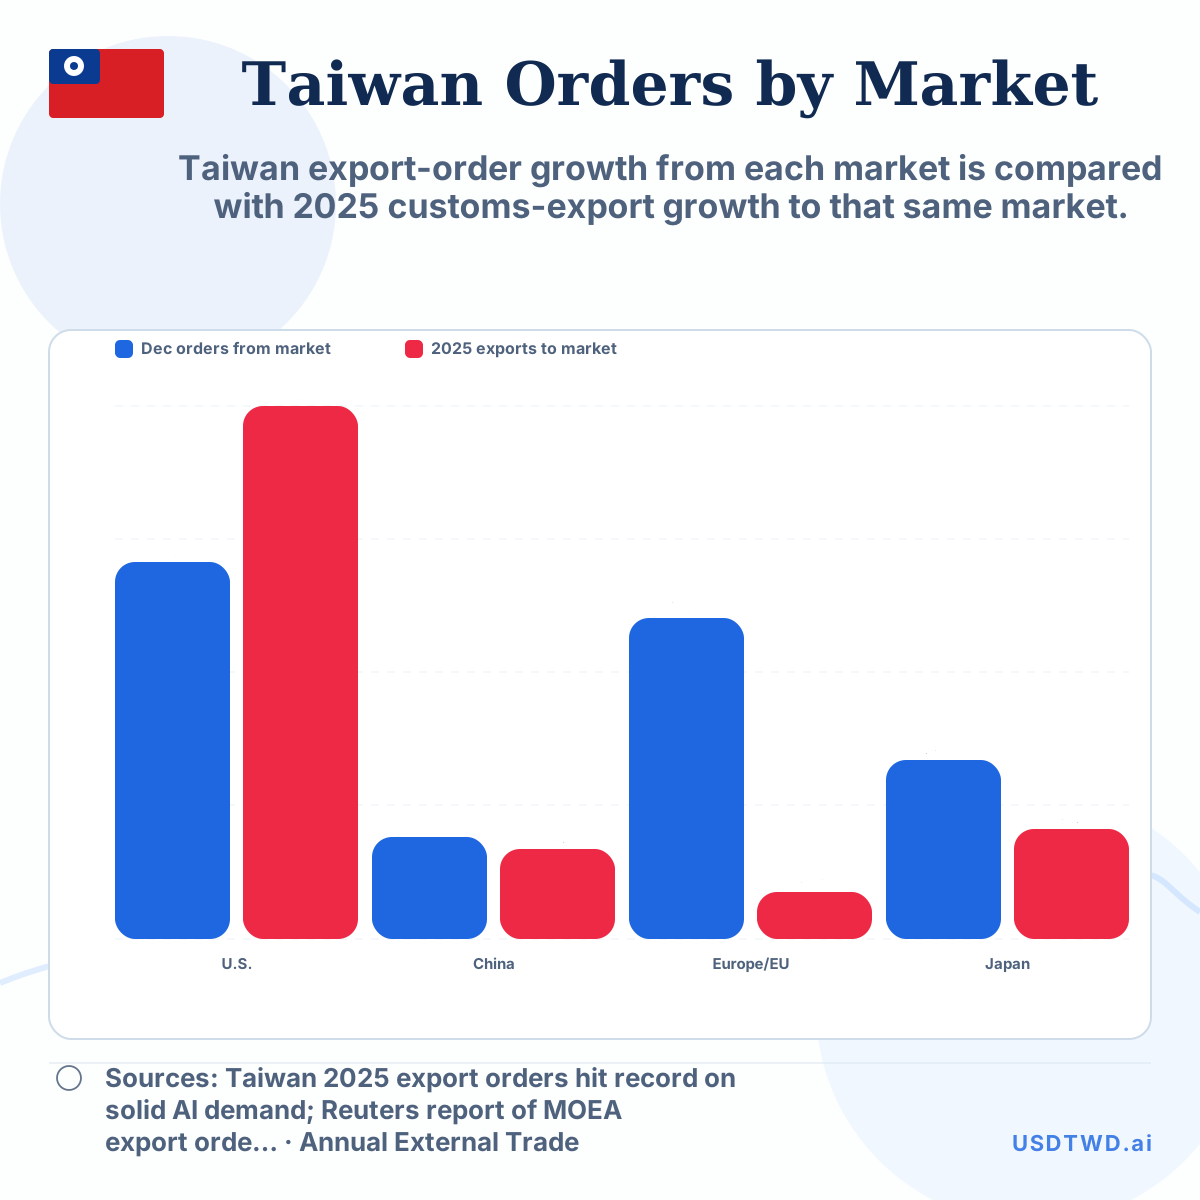
Taiwan export-order growth from each market is compared with 2025 customs-export growth to that same market.
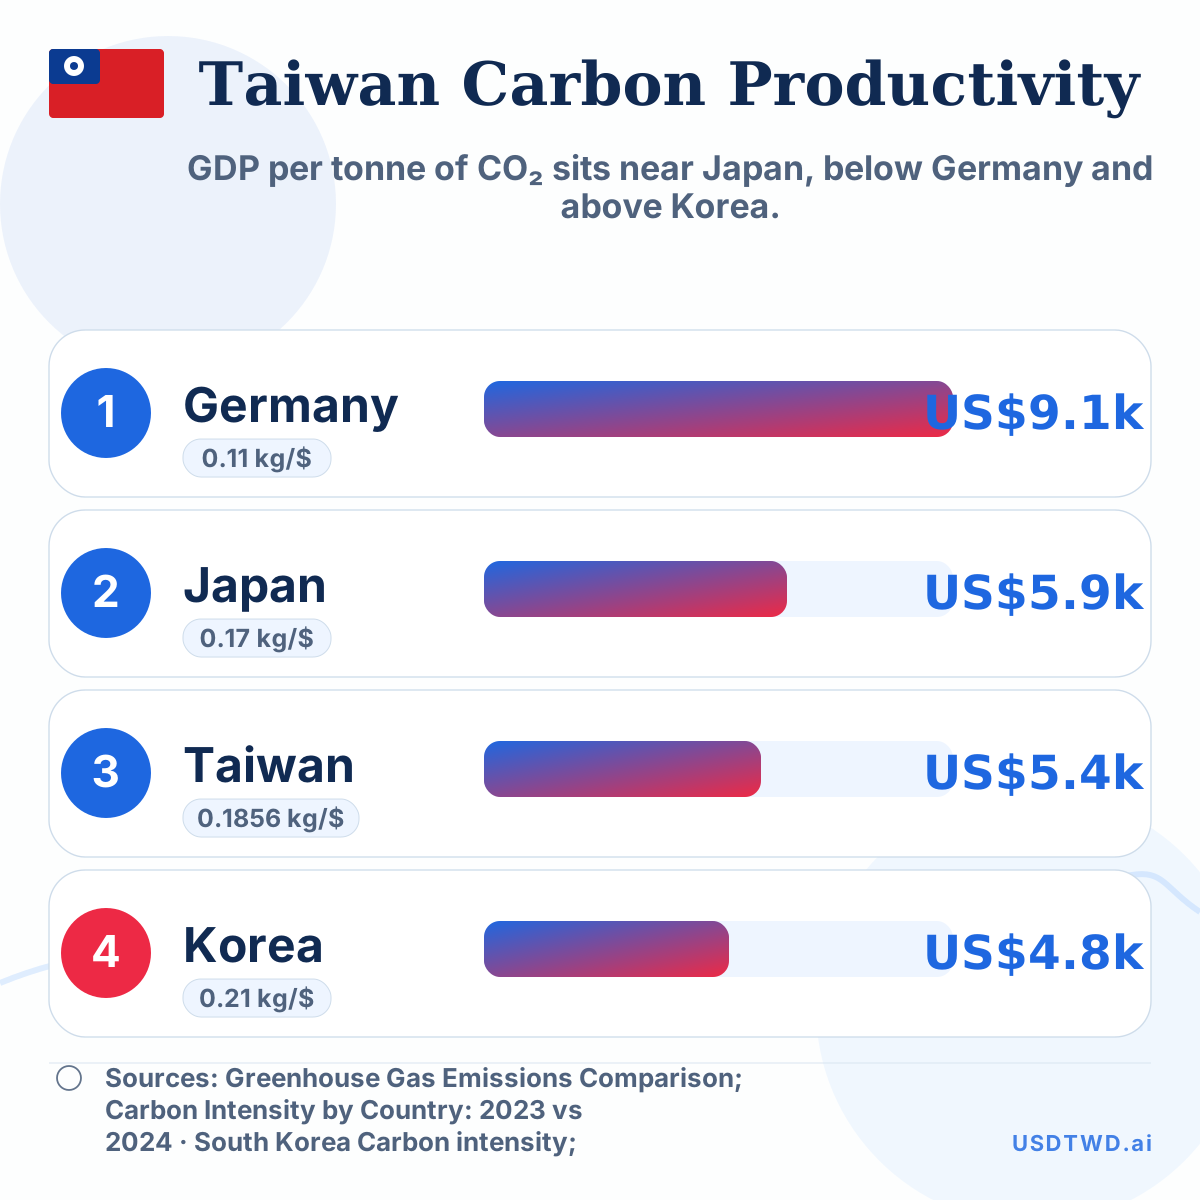
GDP per tonne of CO₂ sits near Japan, below Germany and above Korea.
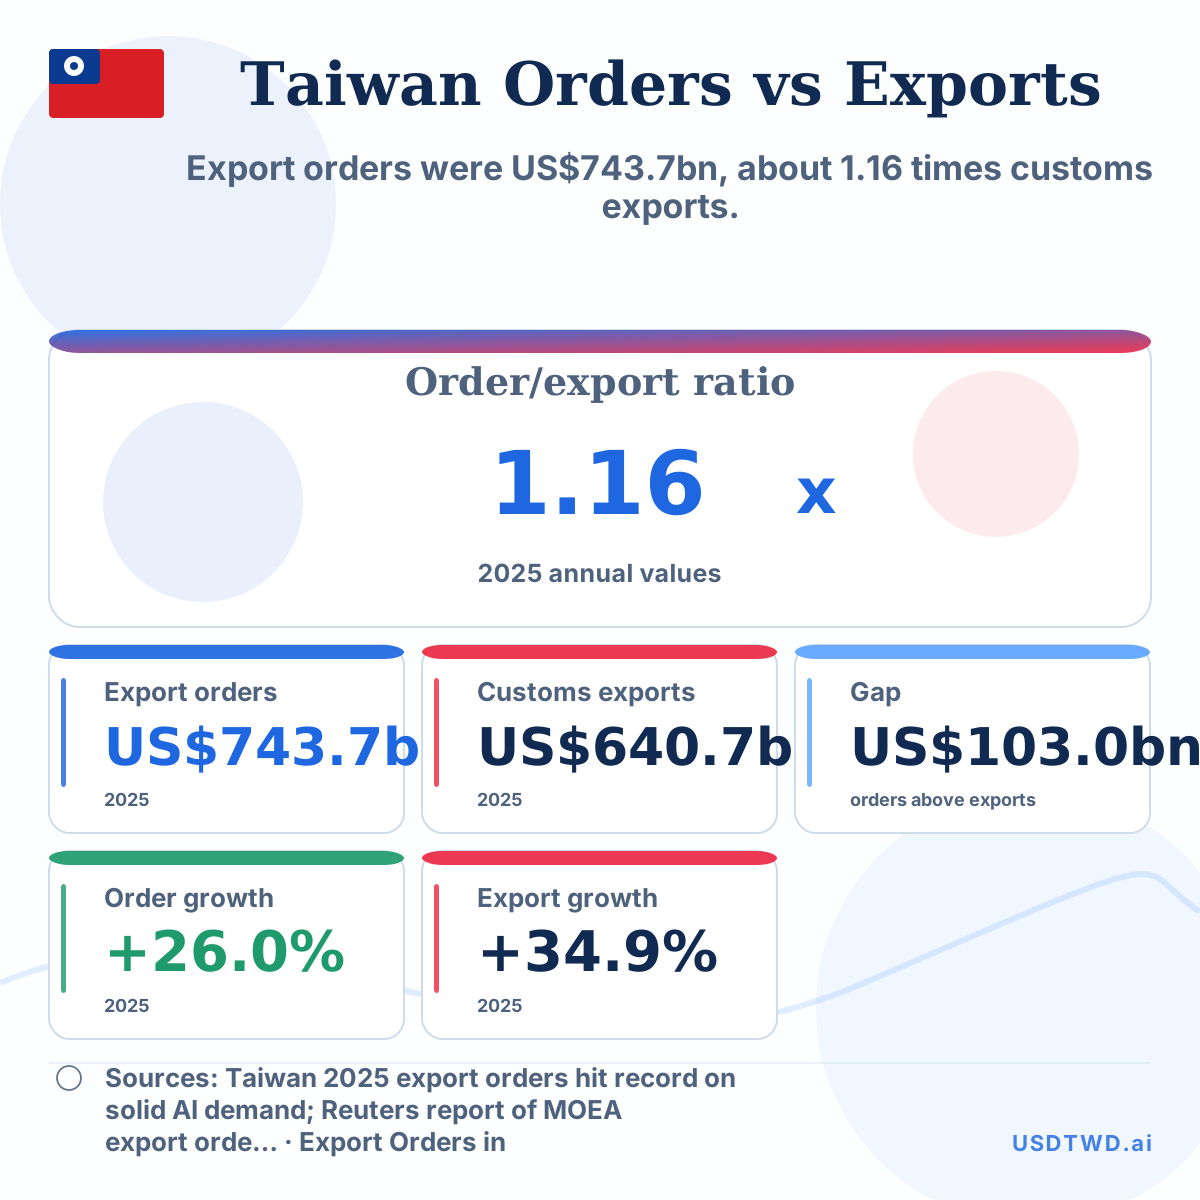
Export orders were US$743.7bn, about 1.16 times customs exports.
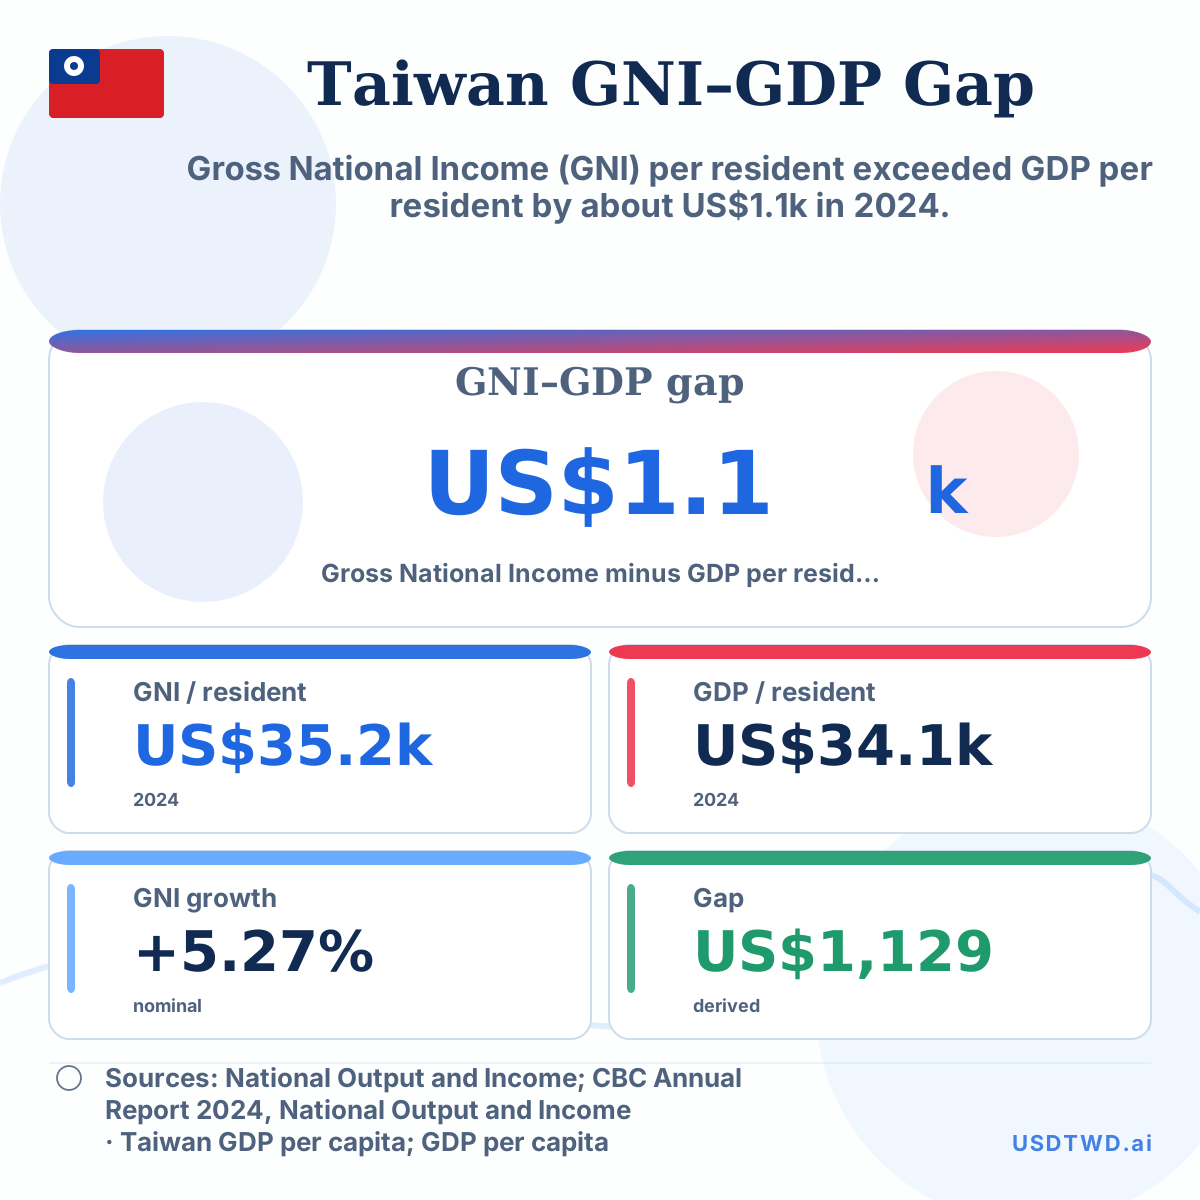
Gross National Income (GNI) per resident exceeded GDP per resident by about US$1.1k in 2024.
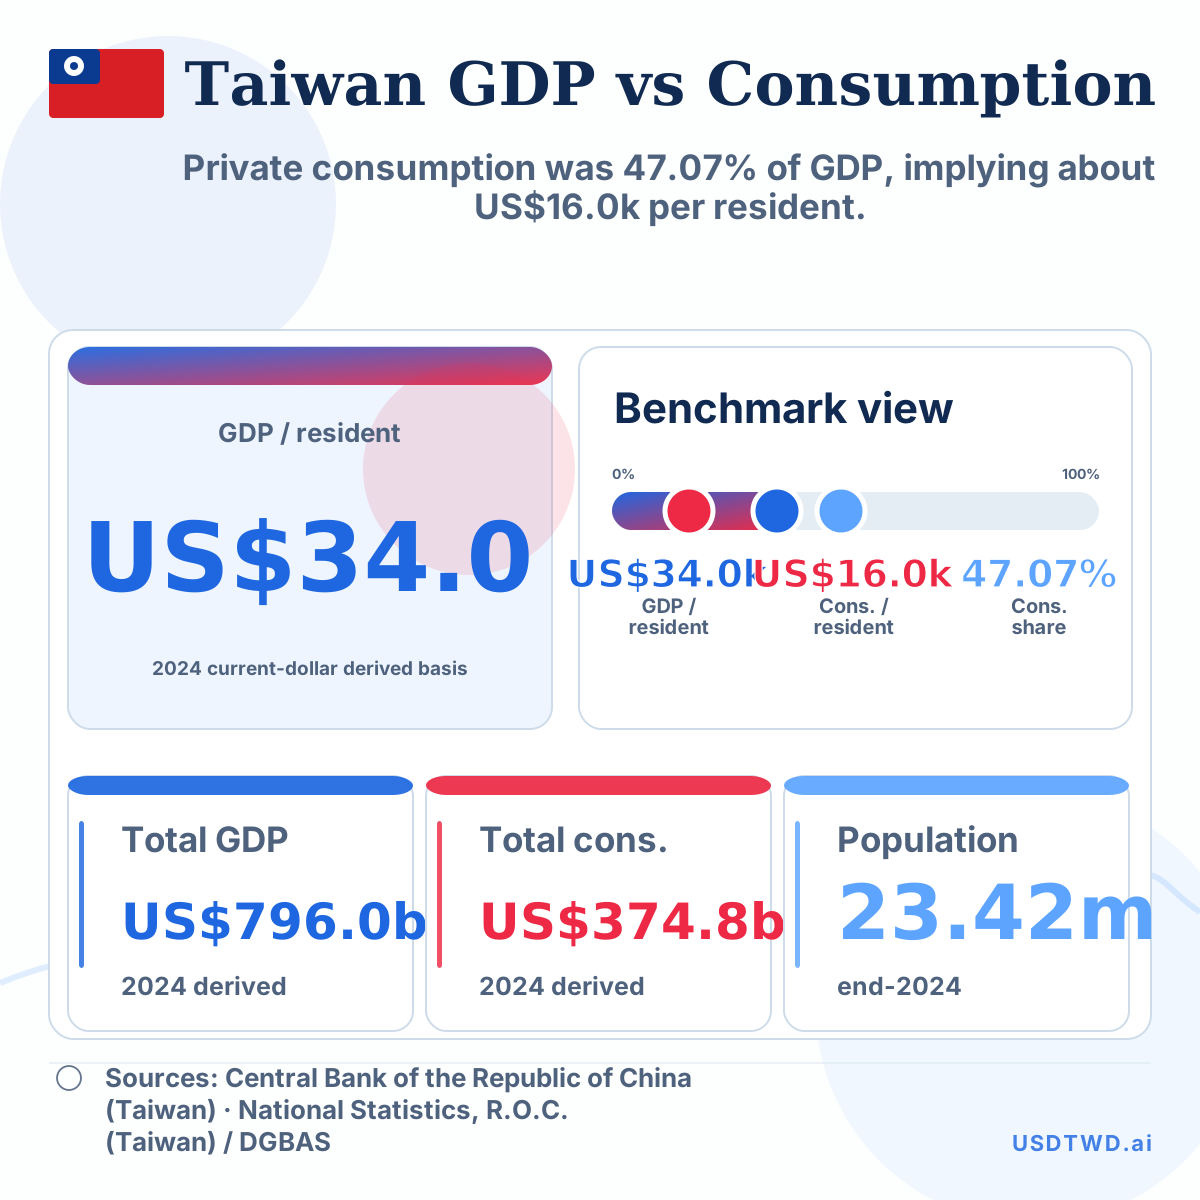
Private consumption was 47.07% of GDP, implying about US$16.0k per resident.
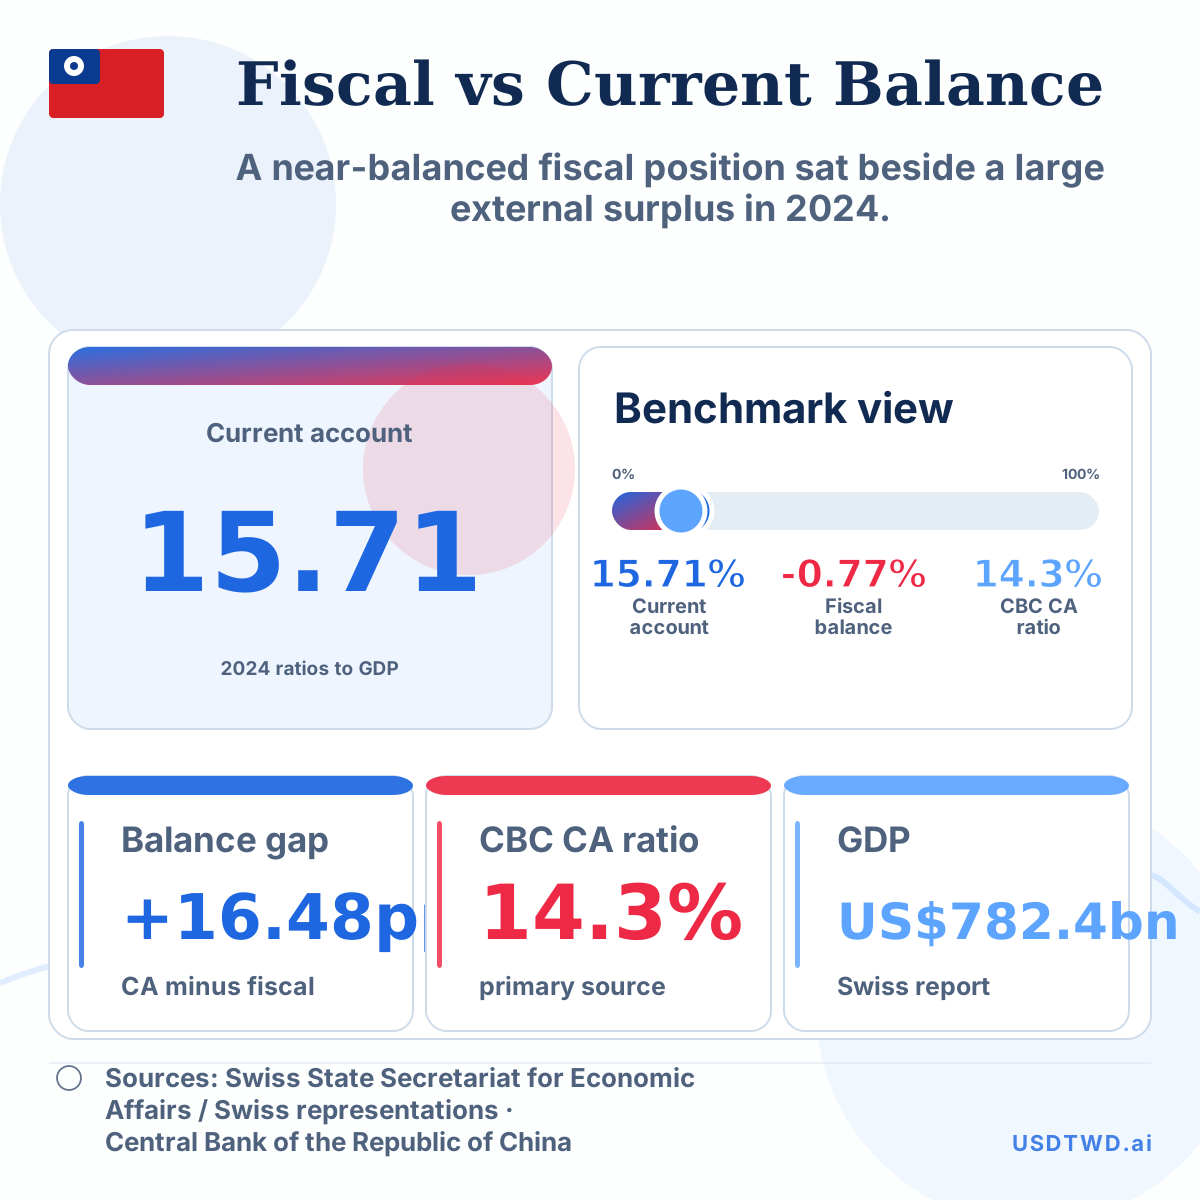
A near-balanced fiscal position sat beside a large external surplus in 2024.
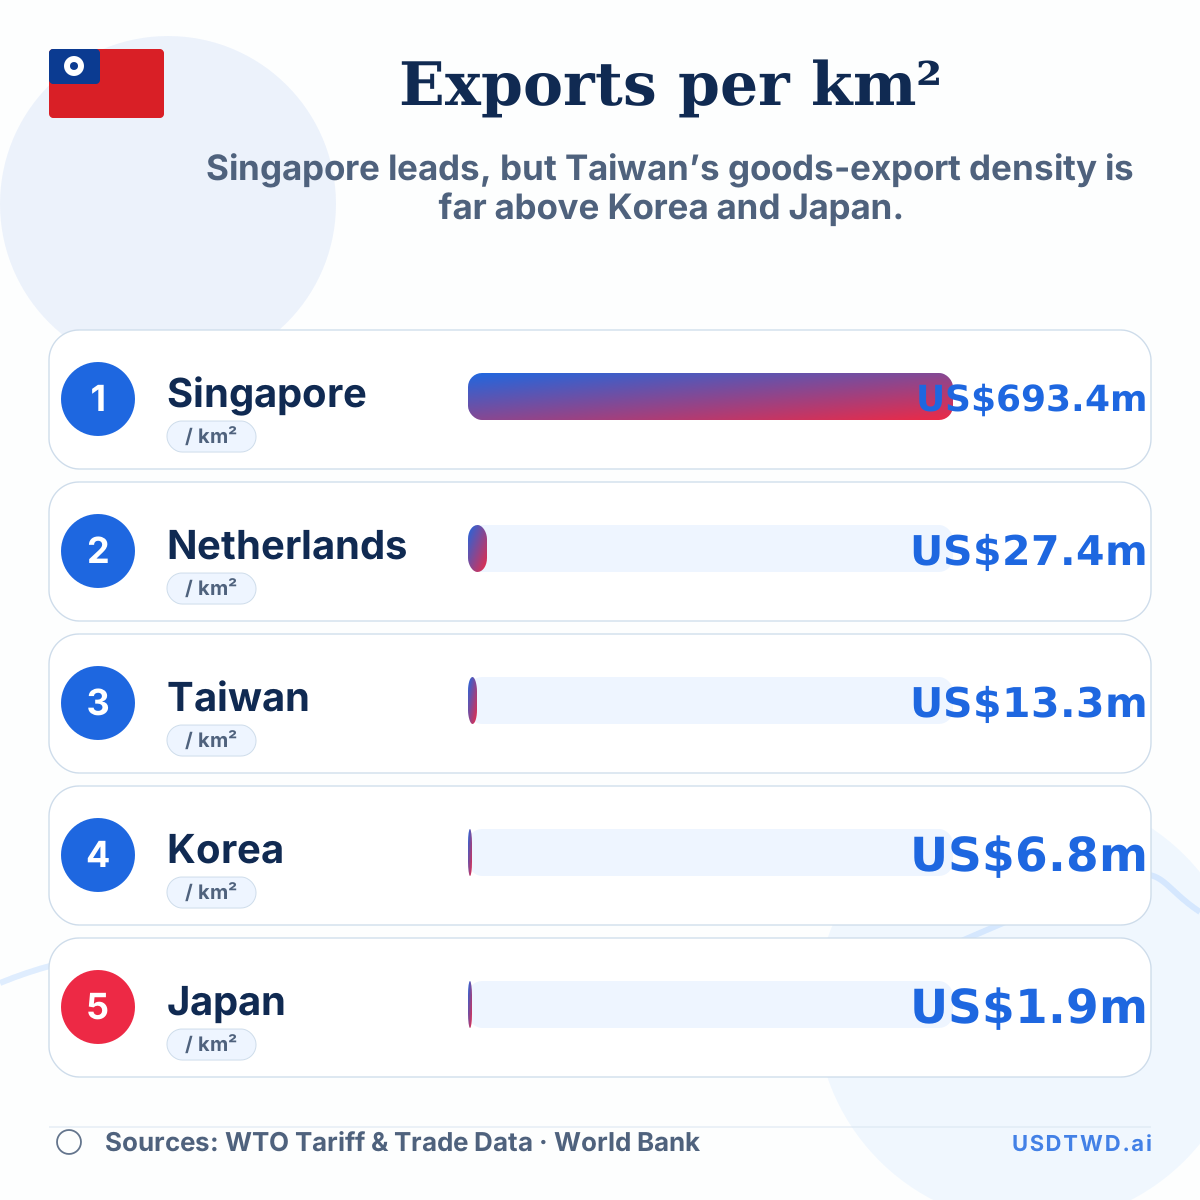
Singapore leads, but Taiwan’s goods-export density is far above Korea and Japan.
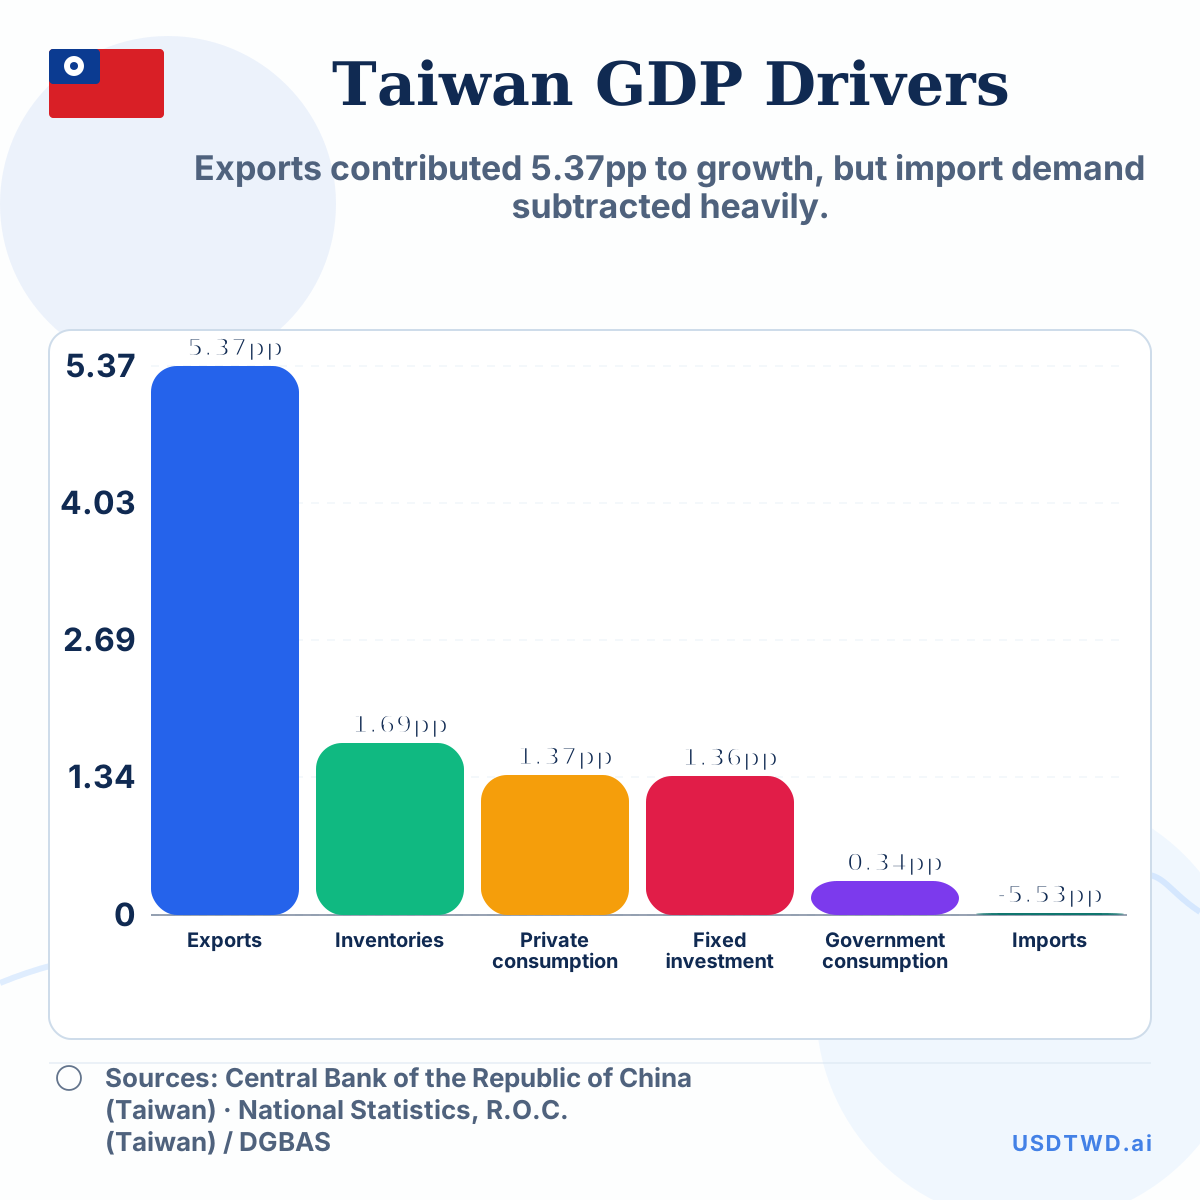
Exports contributed 5.37pp to growth, but import demand subtracted heavily.