Start with these Economy graphics
Newest source-labelled pages in this topic, with source blocks and data tables attached.
Graphics archive
GDP, trade, productivity, income, industrial structure and national-accounts graphics that explain Taiwan’s macro engine.
Newest source-labelled pages in this topic, with source blocks and data tables attached.
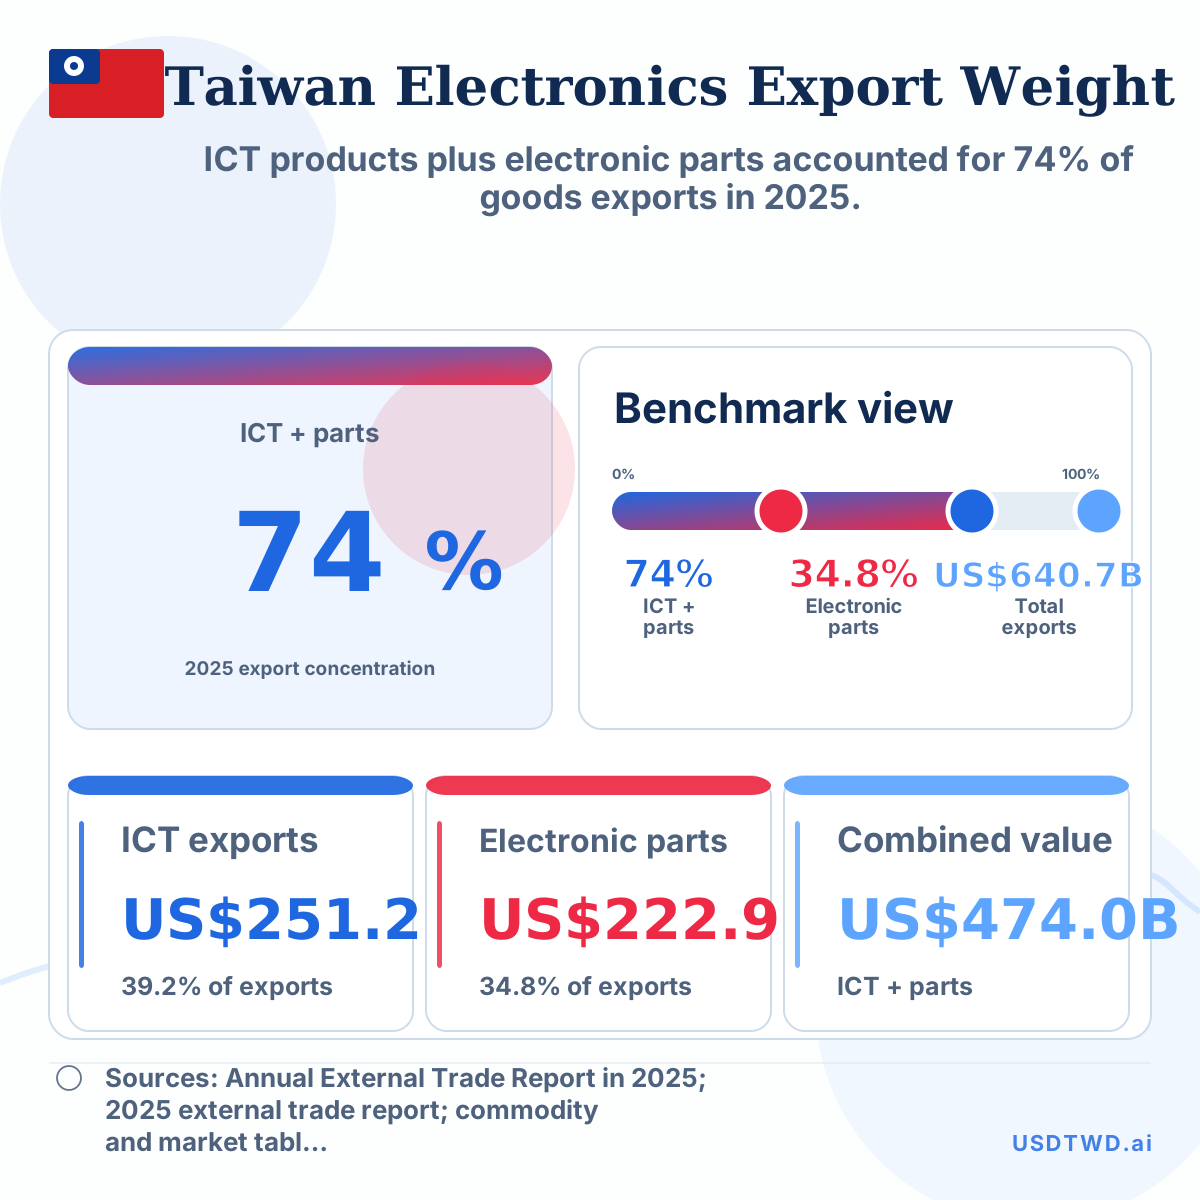
ICT products plus electronic parts accounted for 74% of goods exports in 2025.
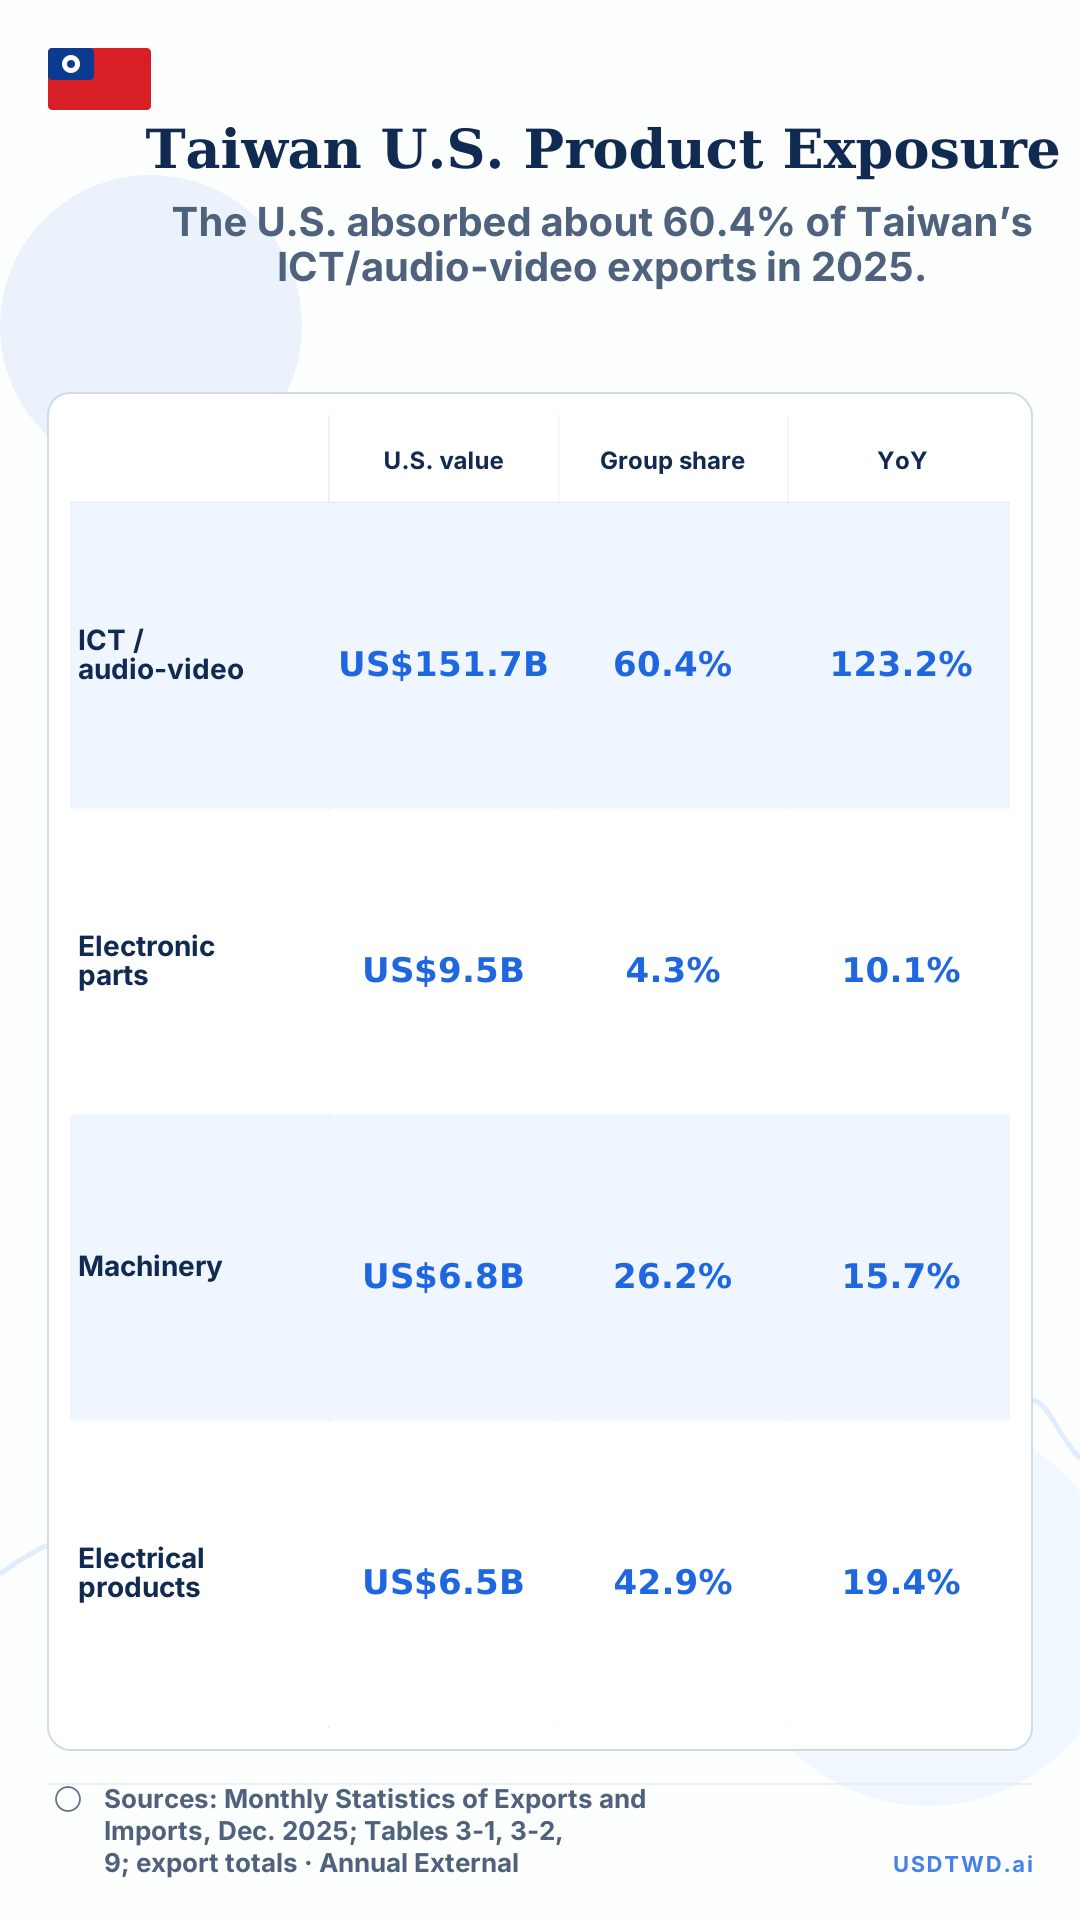
The U.S. absorbed about 60.4% of Taiwan’s ICT/audio-video exports in 2025.
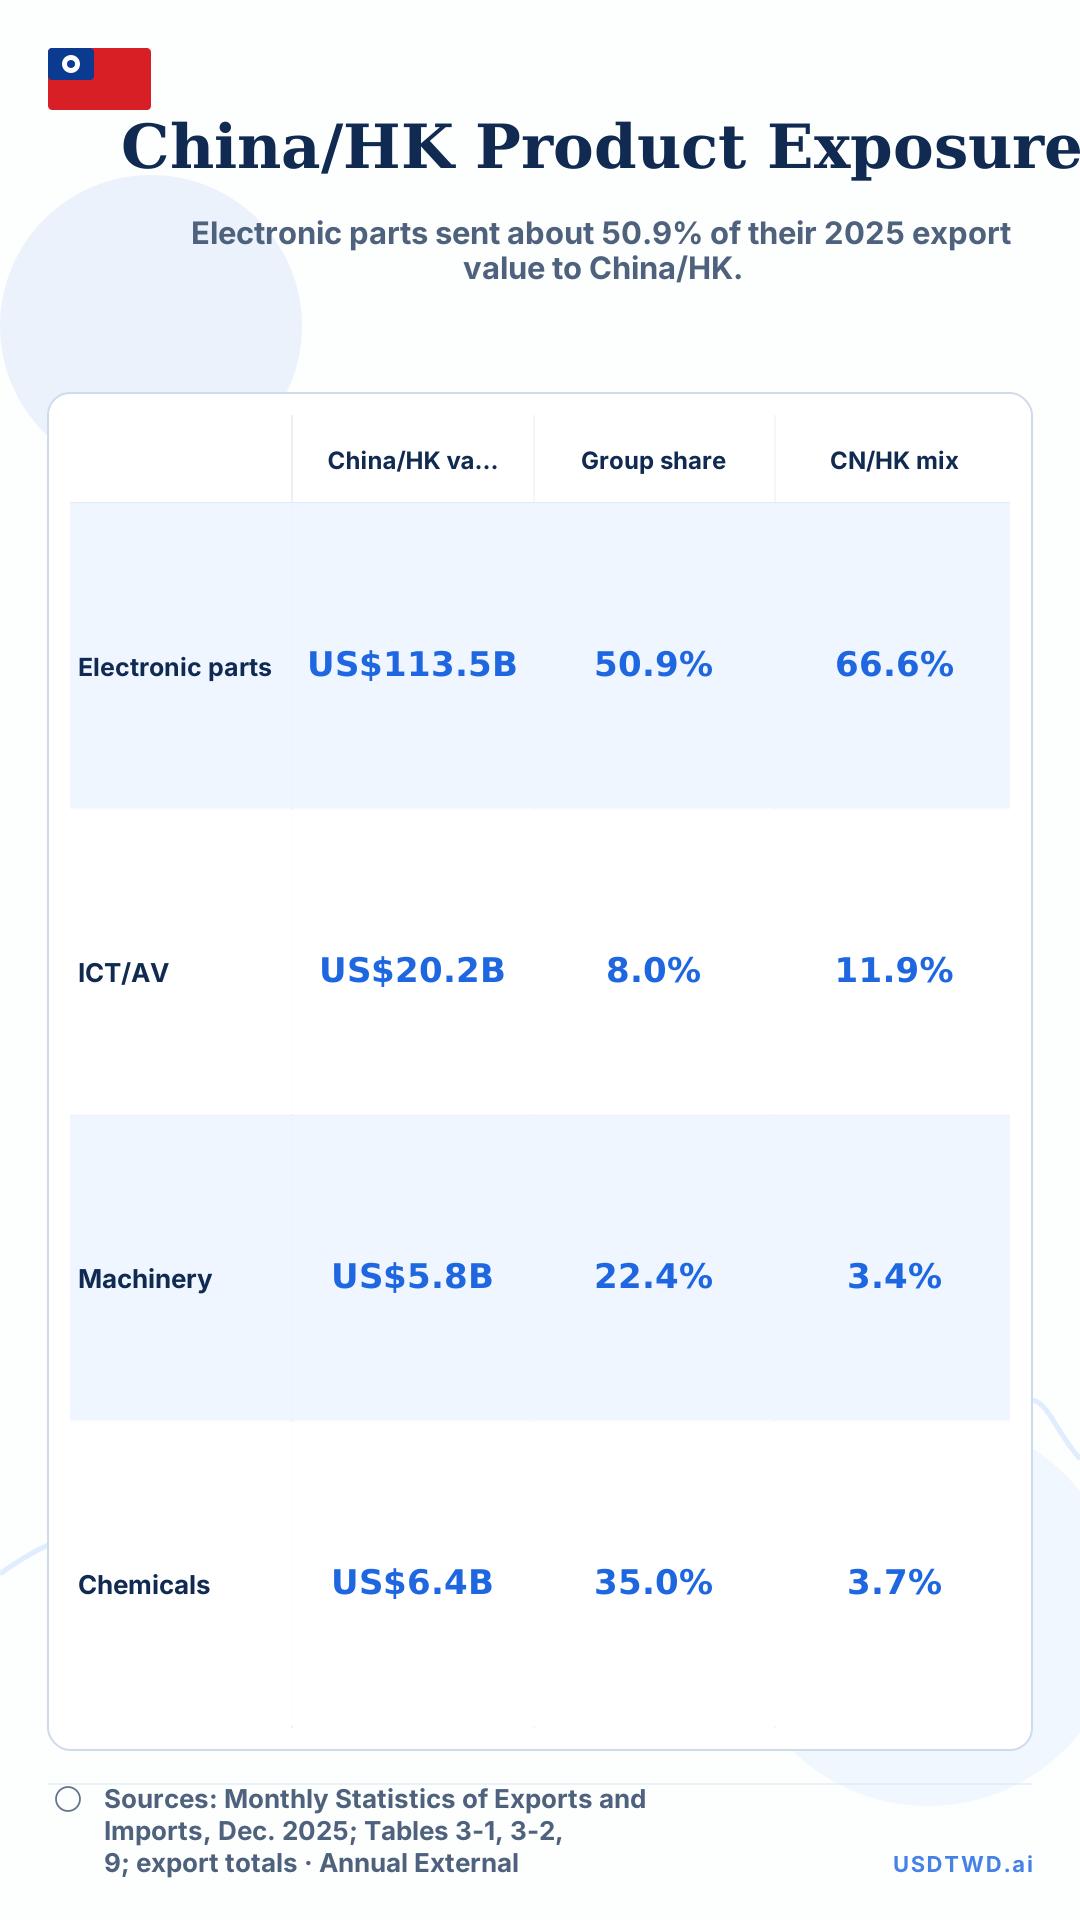
Electronic parts sent about 50.9% of their 2025 export value to China/HK.
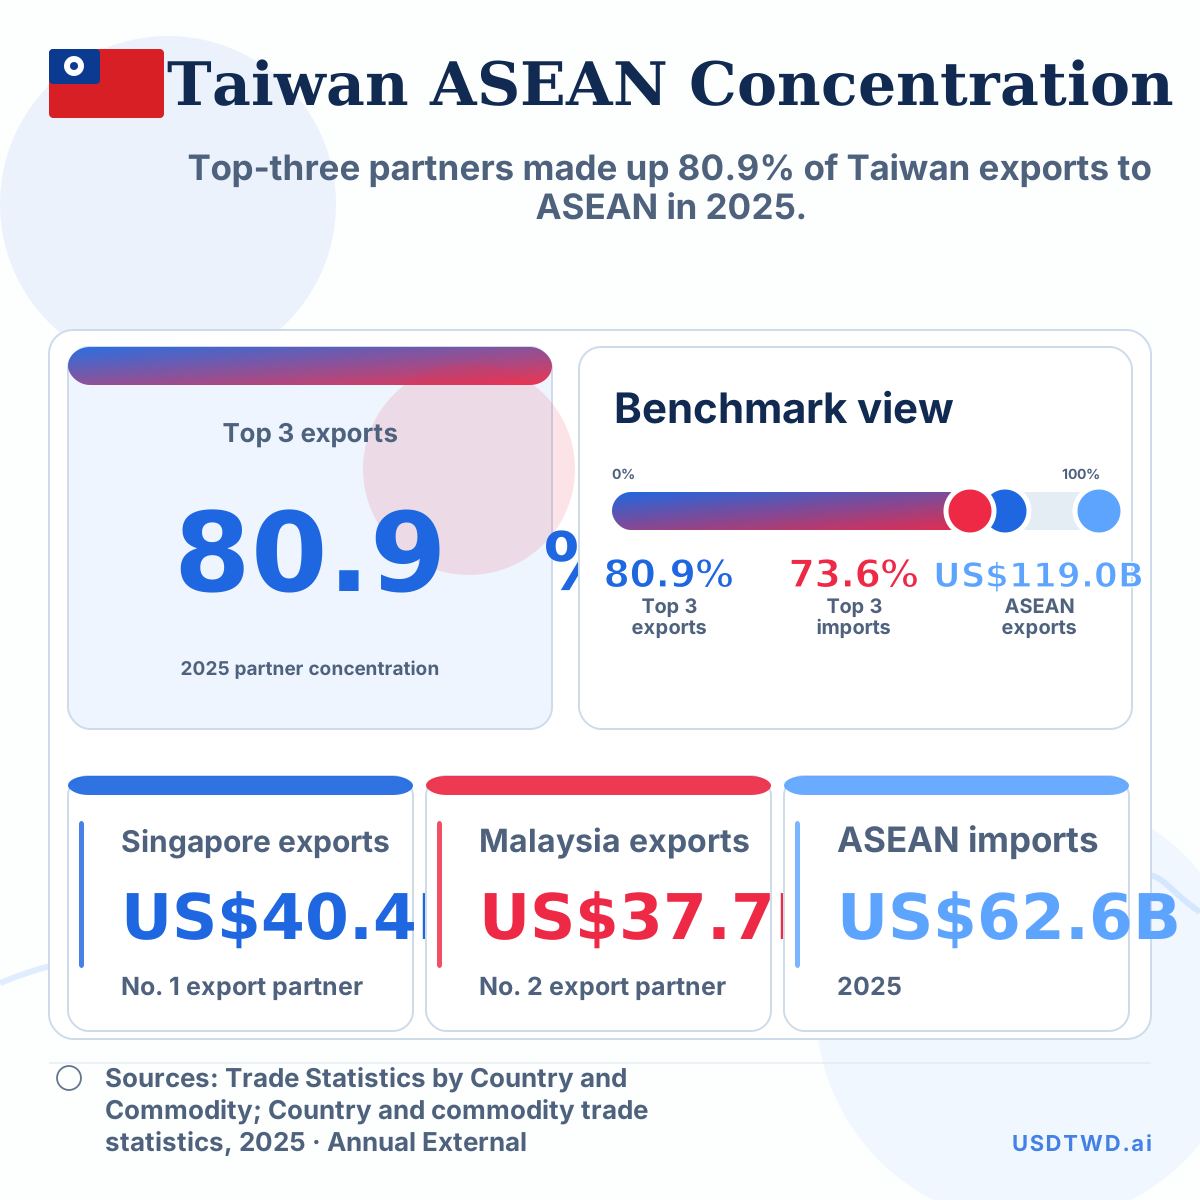
Top-three partners made up 80.9% of Taiwan exports to ASEAN in 2025.
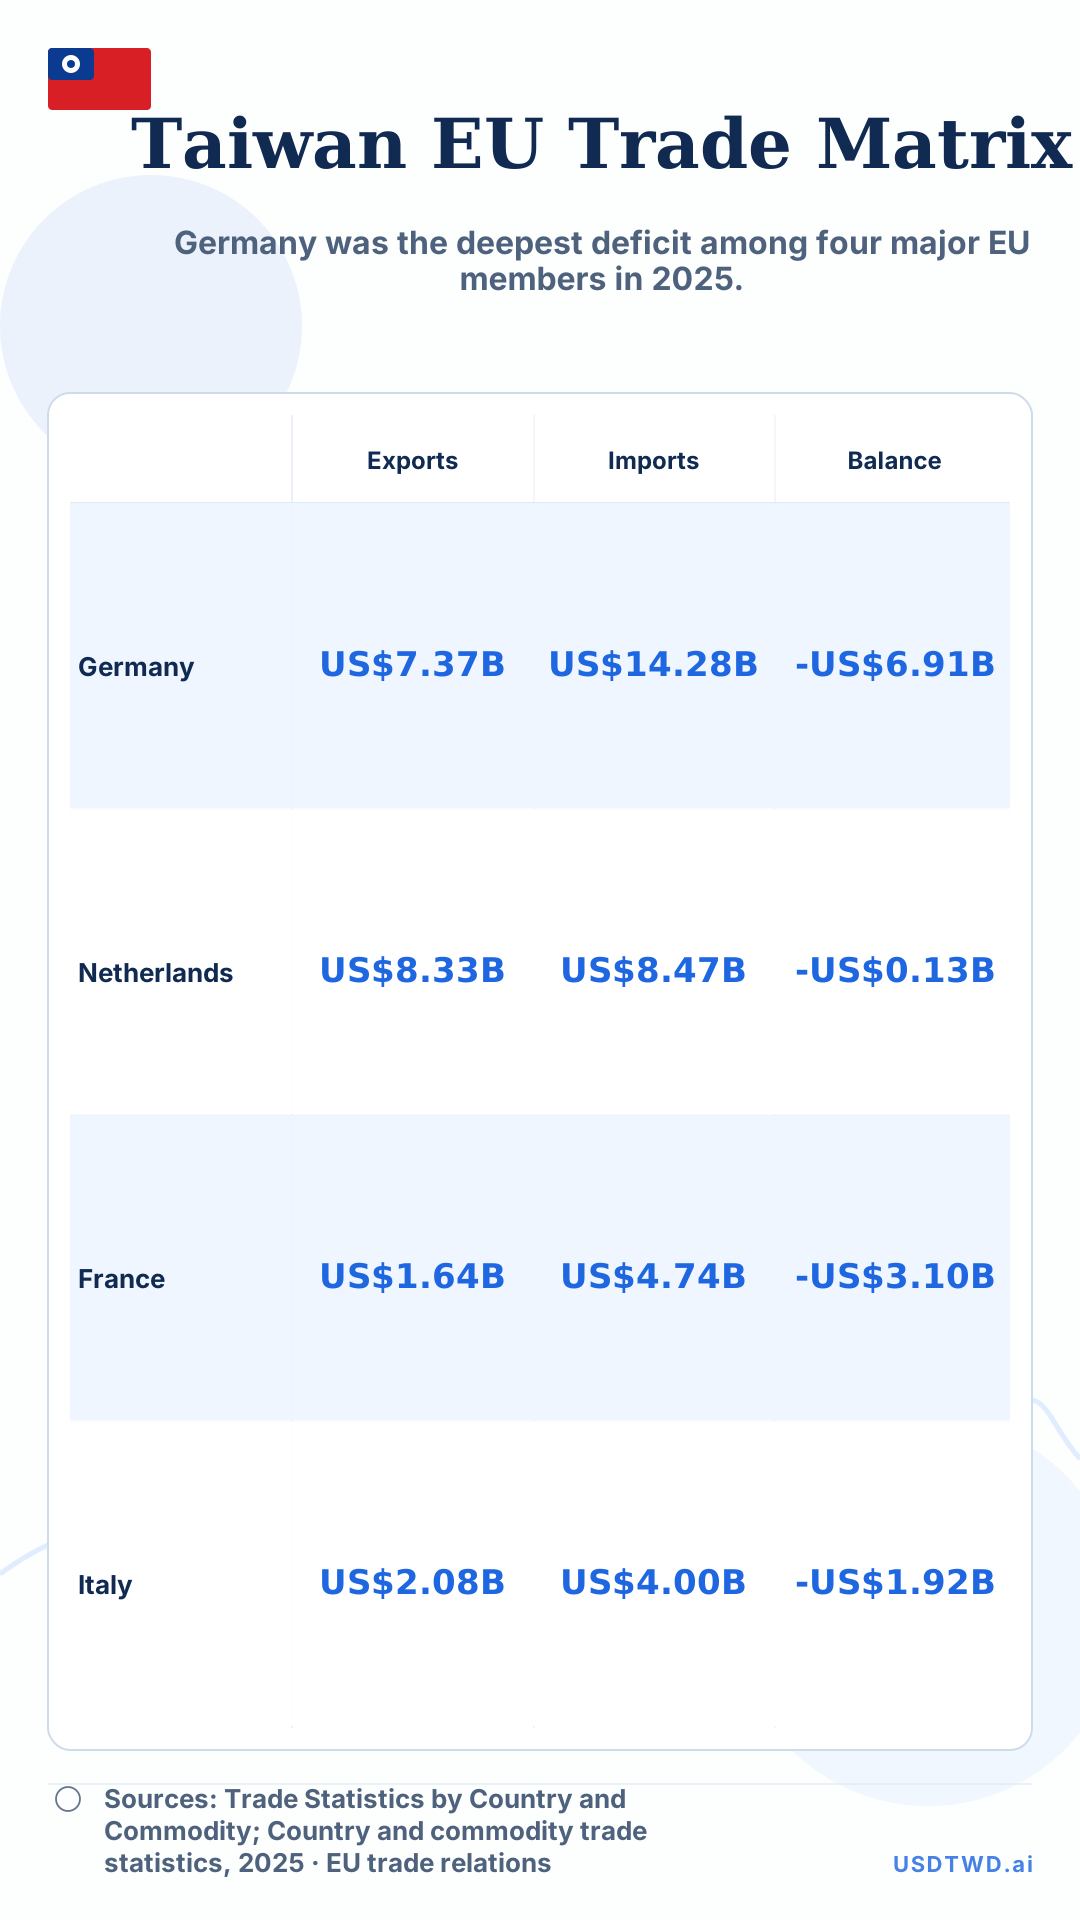
Germany was the deepest deficit among four major EU members in 2025.
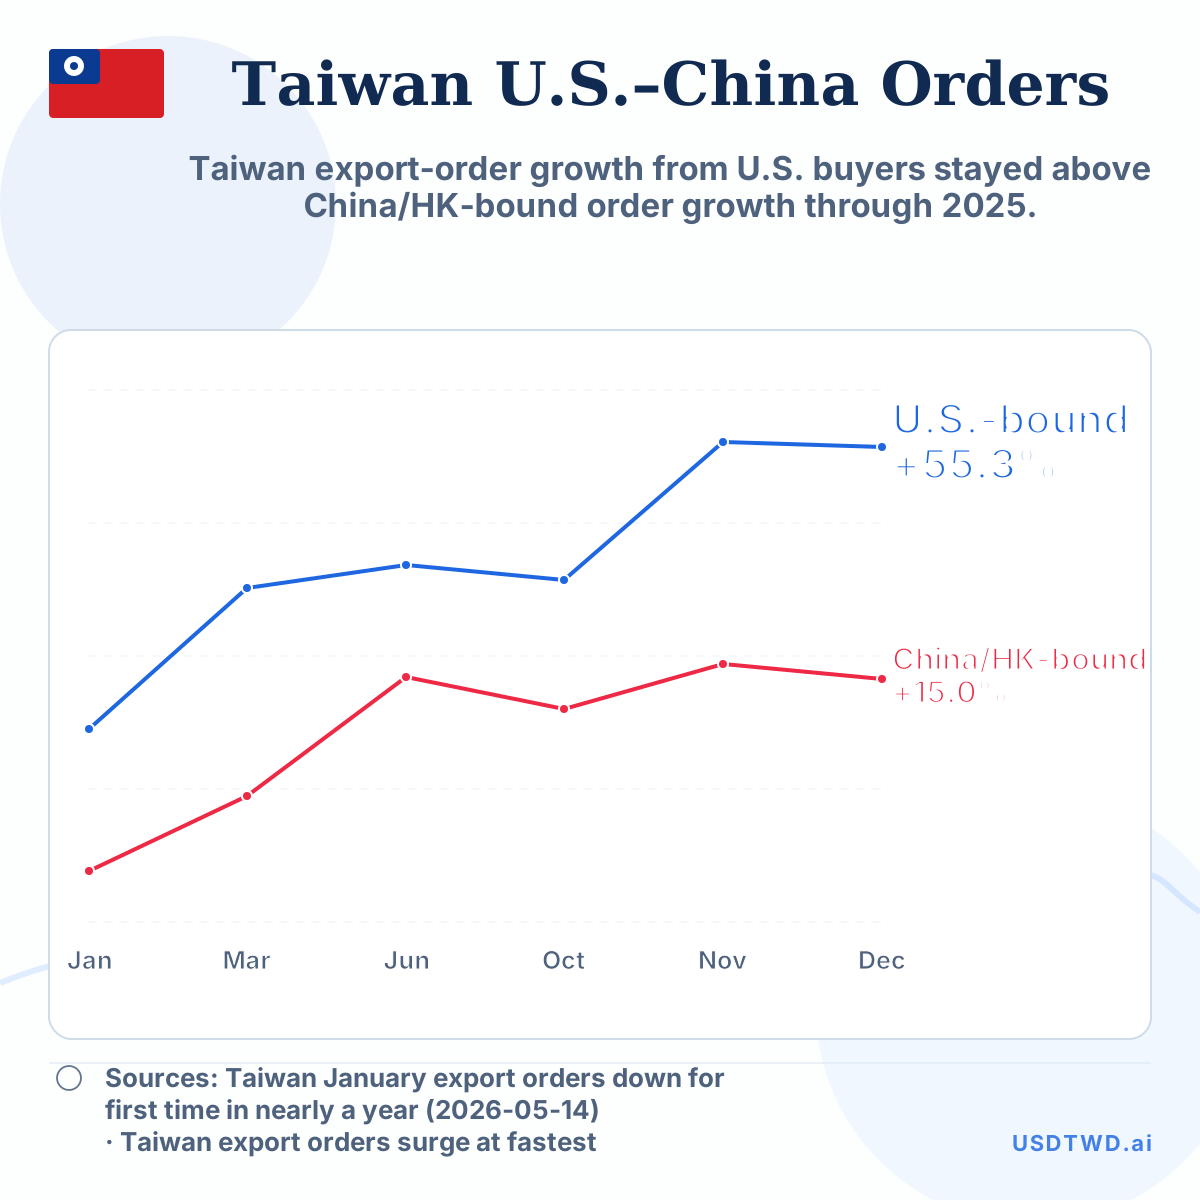
Taiwan export-order growth from U.S. buyers stayed above China/HK-bound order growth through 2025.
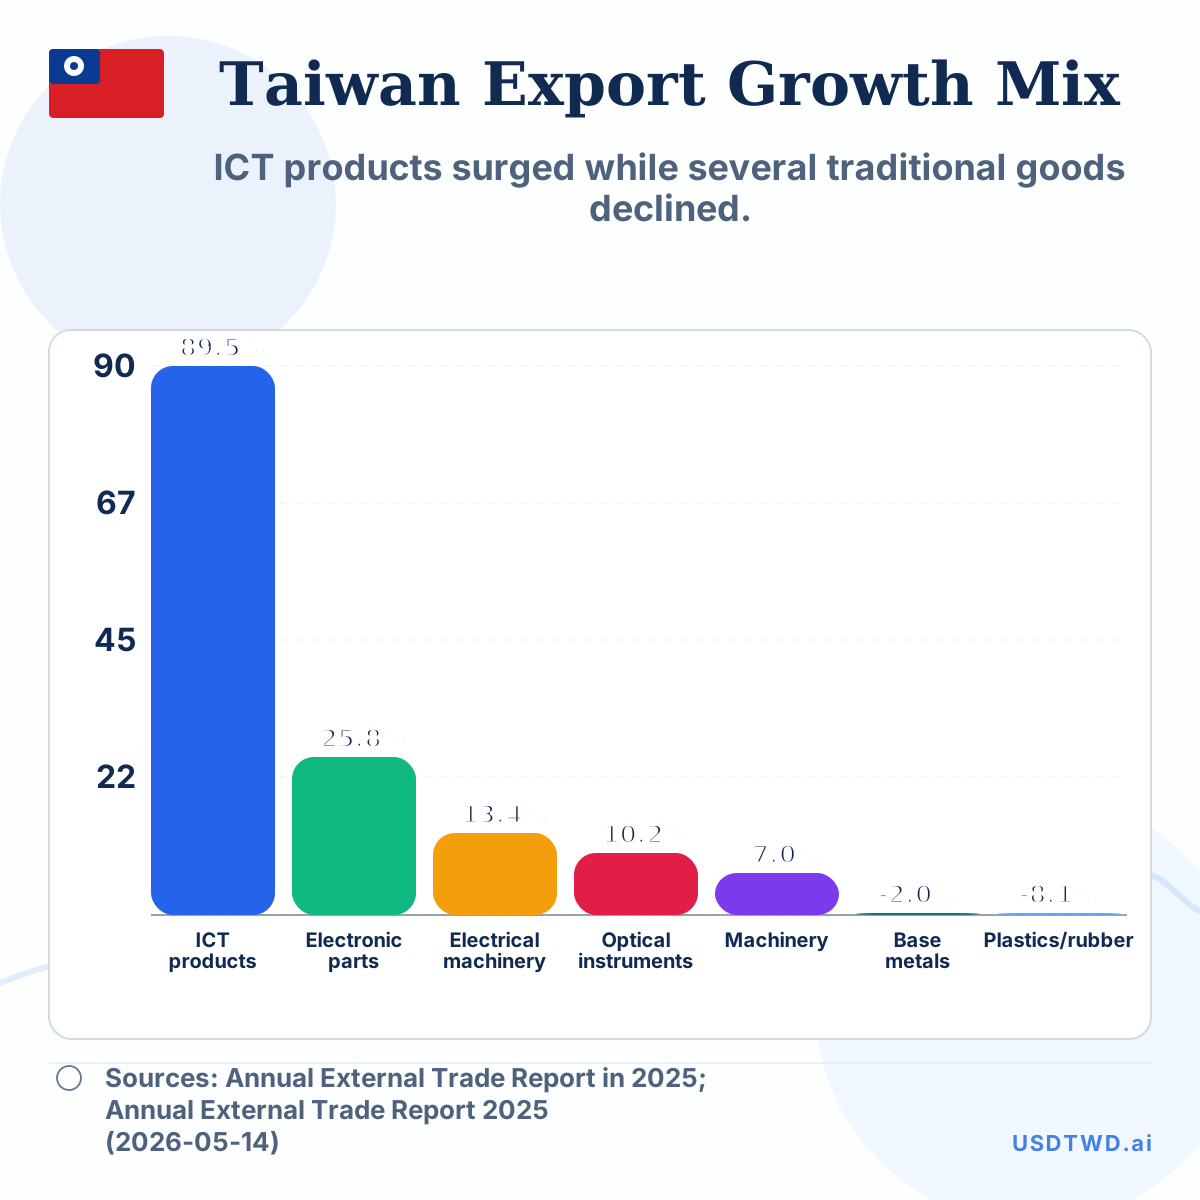
ICT products surged while several traditional goods declined.
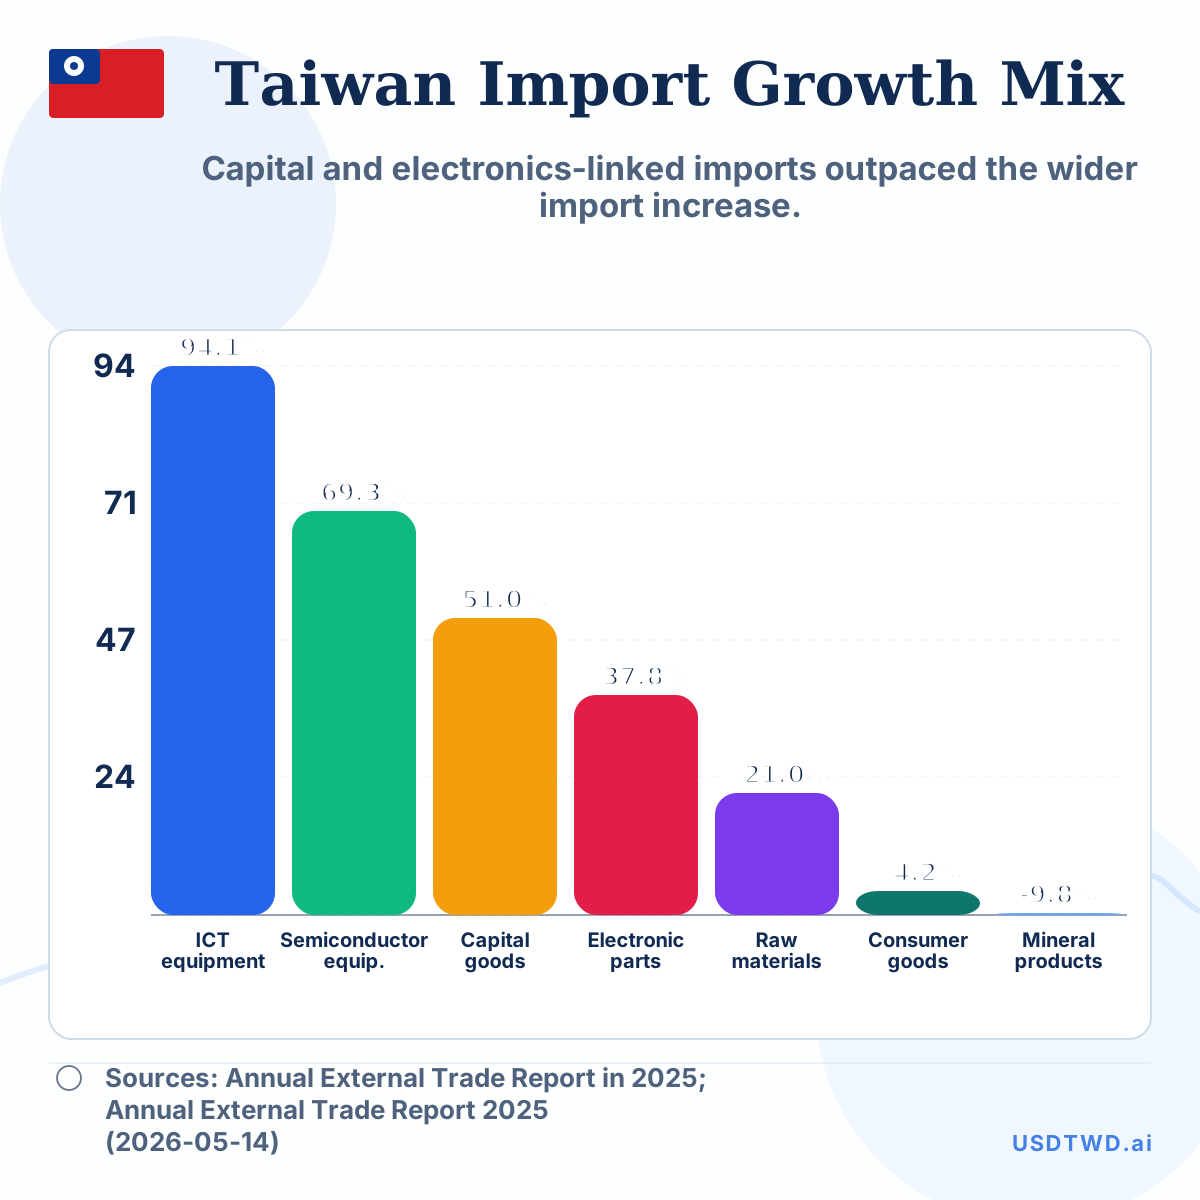
Capital and electronics-linked imports outpaced the wider import increase.
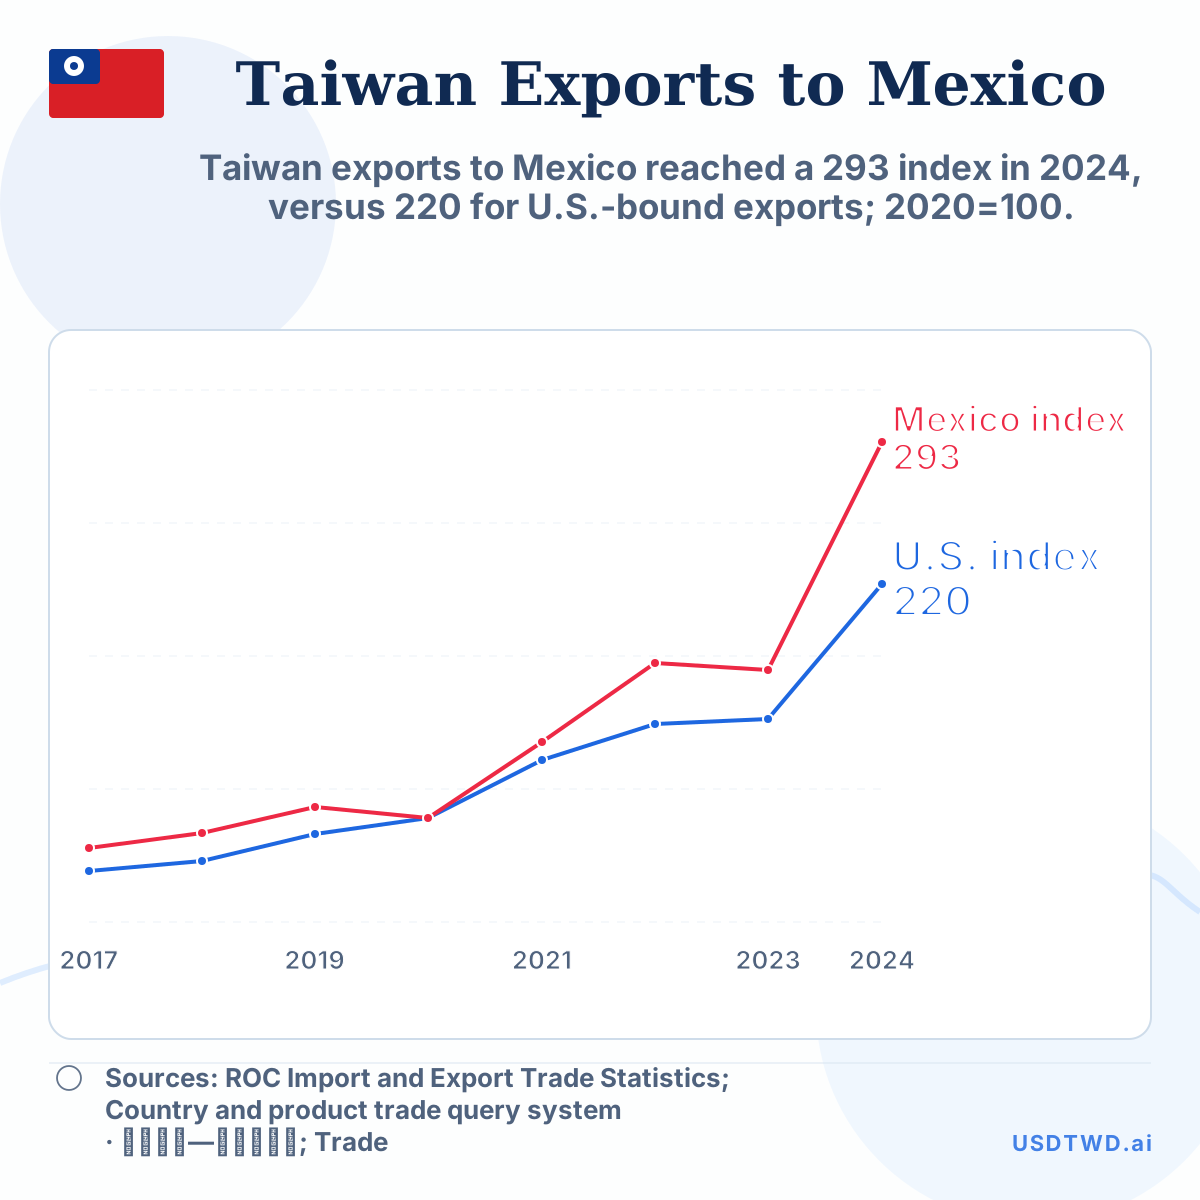
Taiwan exports to Mexico reached a 293 index in 2024, versus 220 for U.S.-bound exports; 2020=100.
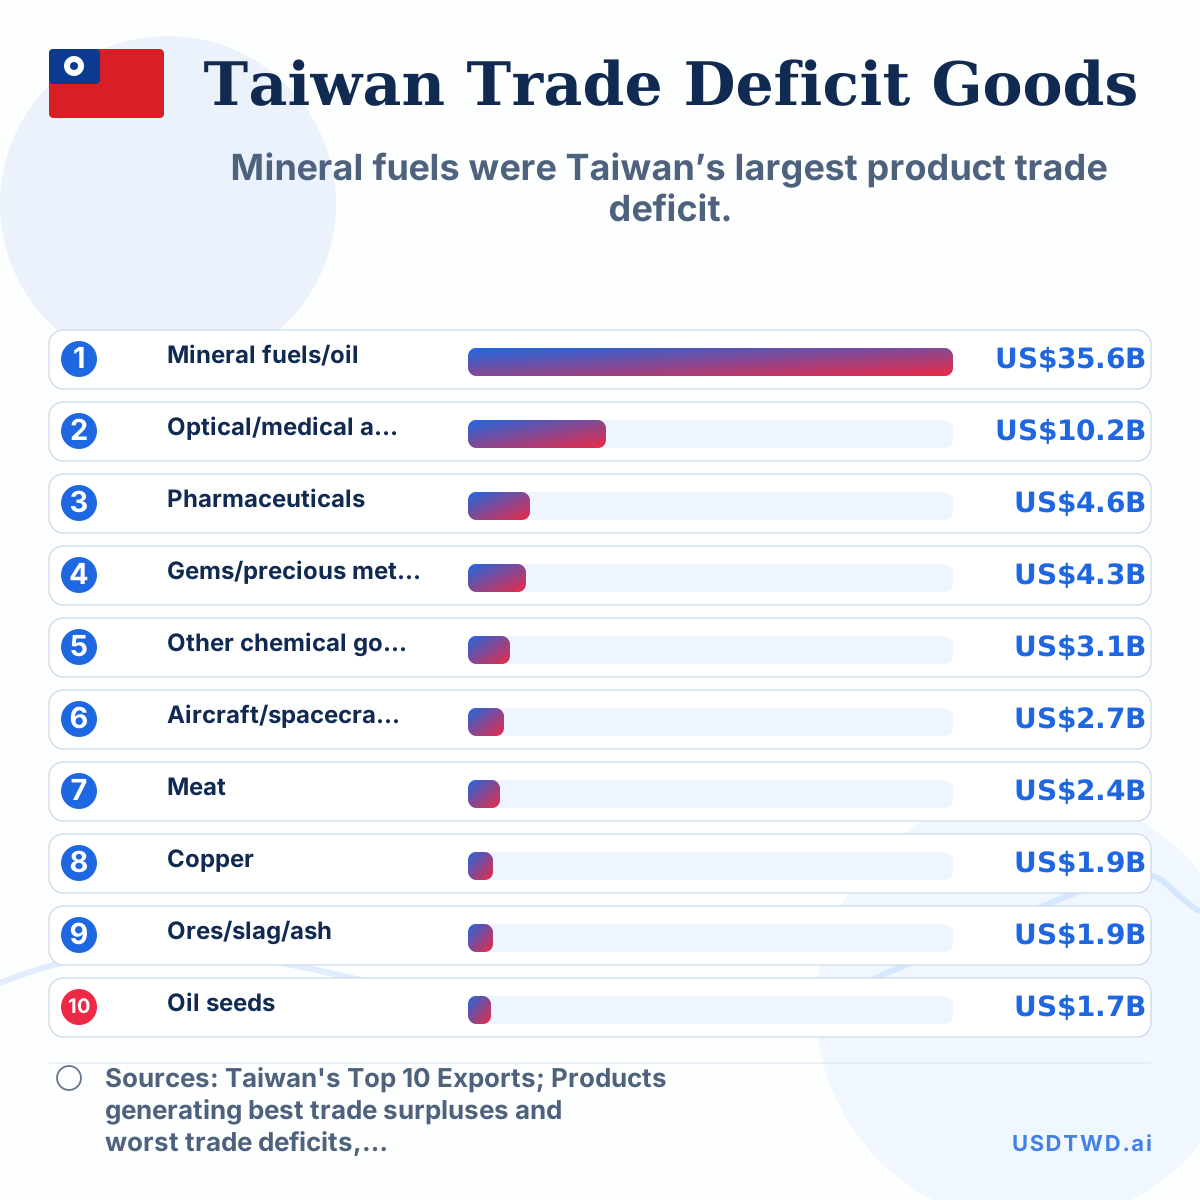
Mineral fuels were Taiwan’s largest product trade deficit.