Start with these Economy graphics
Newest source-labelled pages in this topic, with source blocks and data tables attached.
Graphics archive
GDP, trade, productivity, income, industrial structure and national-accounts graphics that explain Taiwan’s macro engine.
Newest source-labelled pages in this topic, with source blocks and data tables attached.
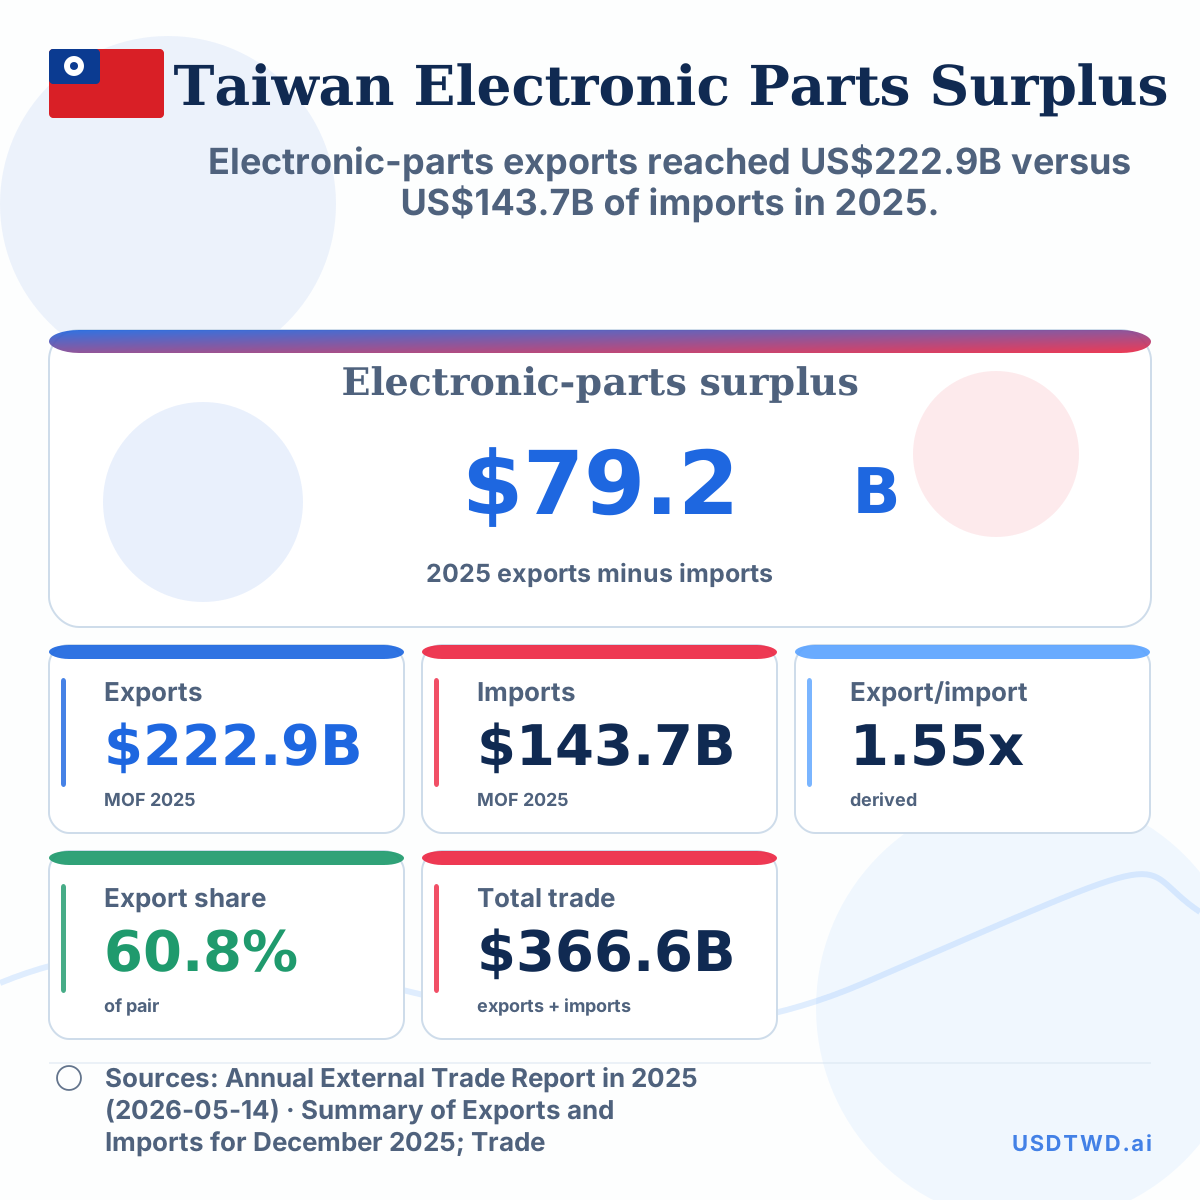
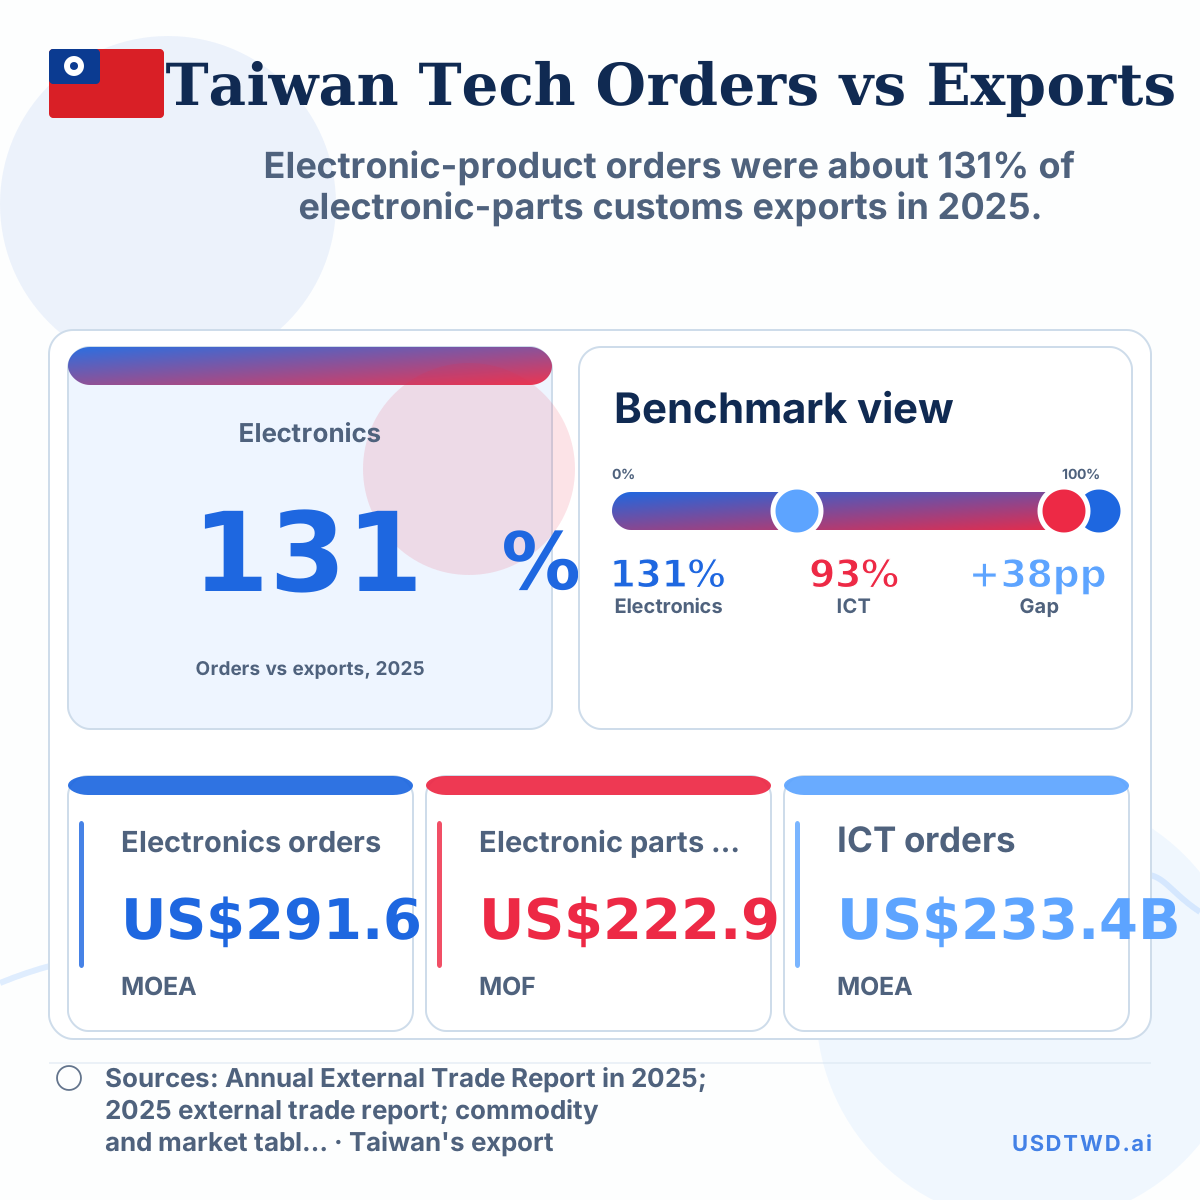
Electronic-parts exports reached US$222.9B versus US$143.7B of imports in 2025.
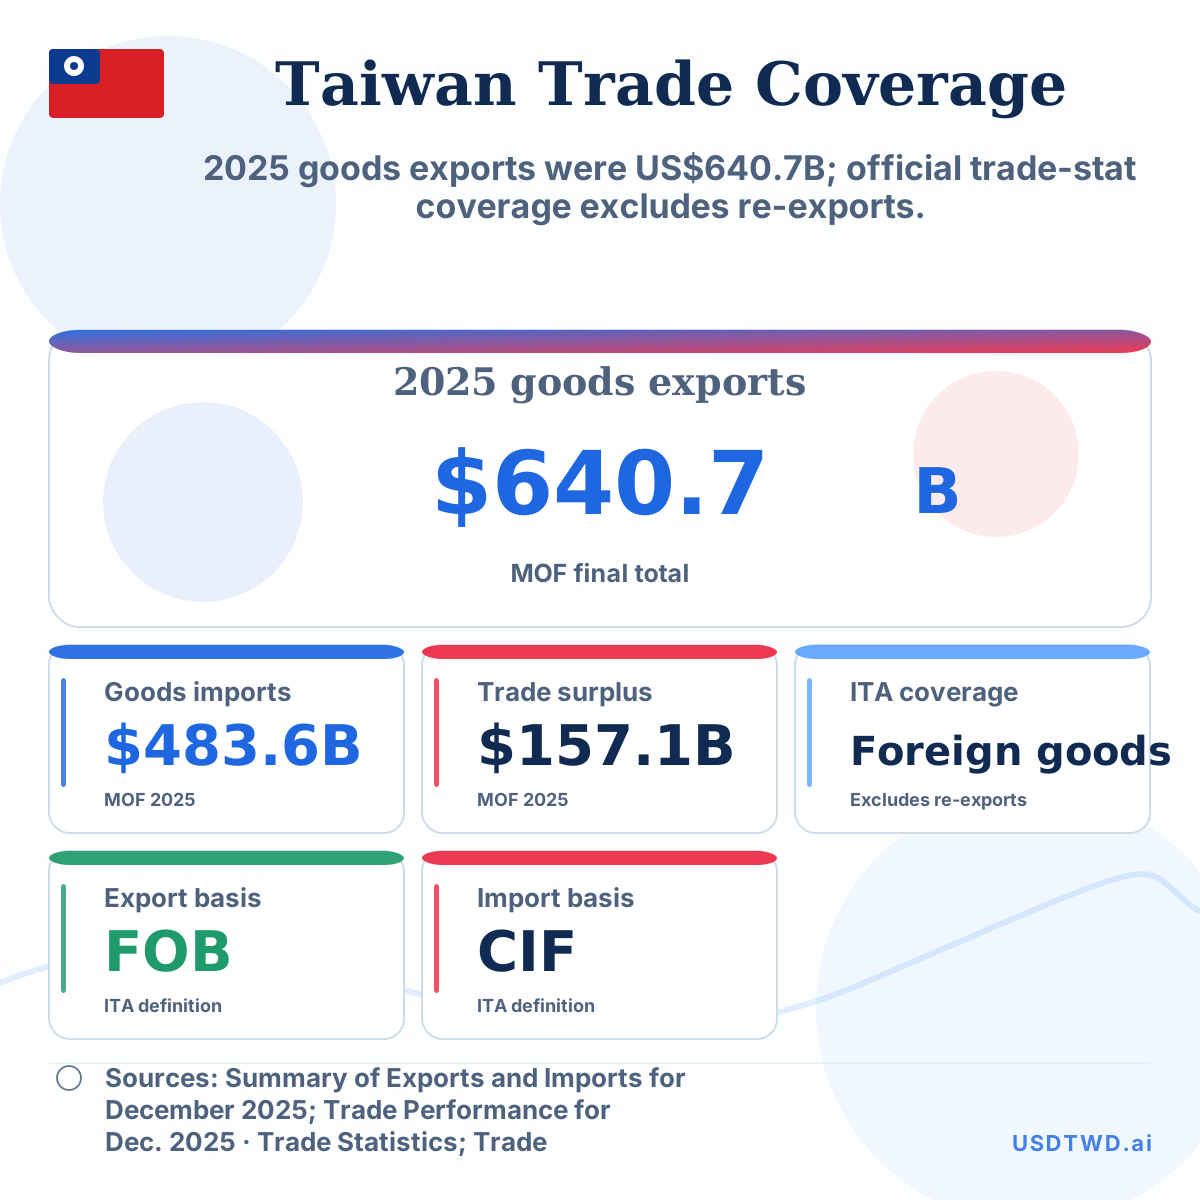
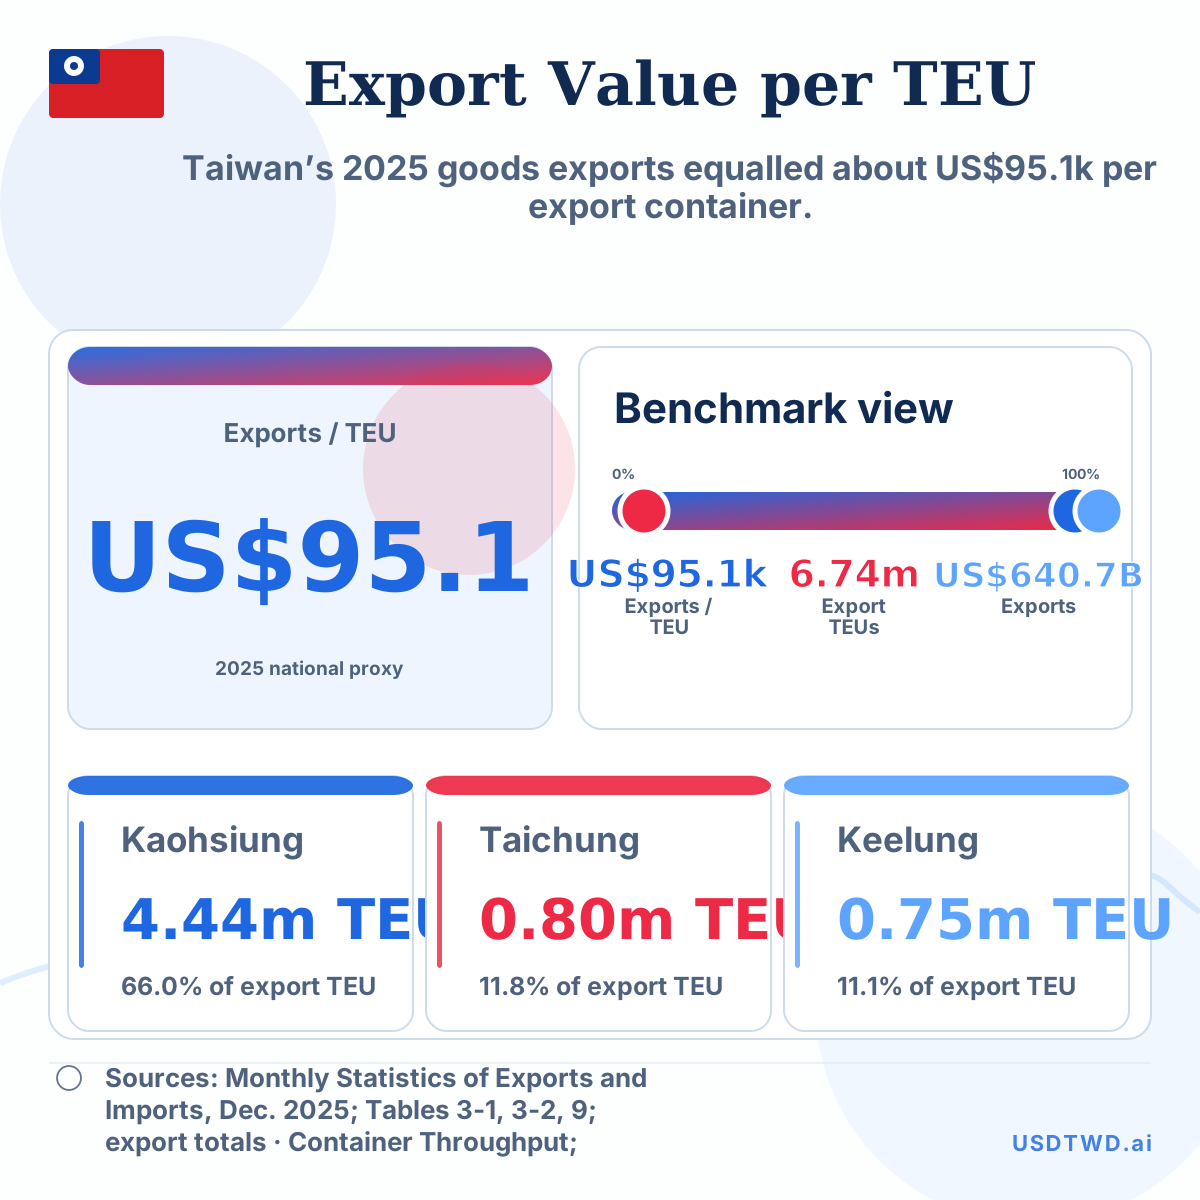
2025 goods exports were US$640.7B; official trade-stat coverage excludes re-exports.
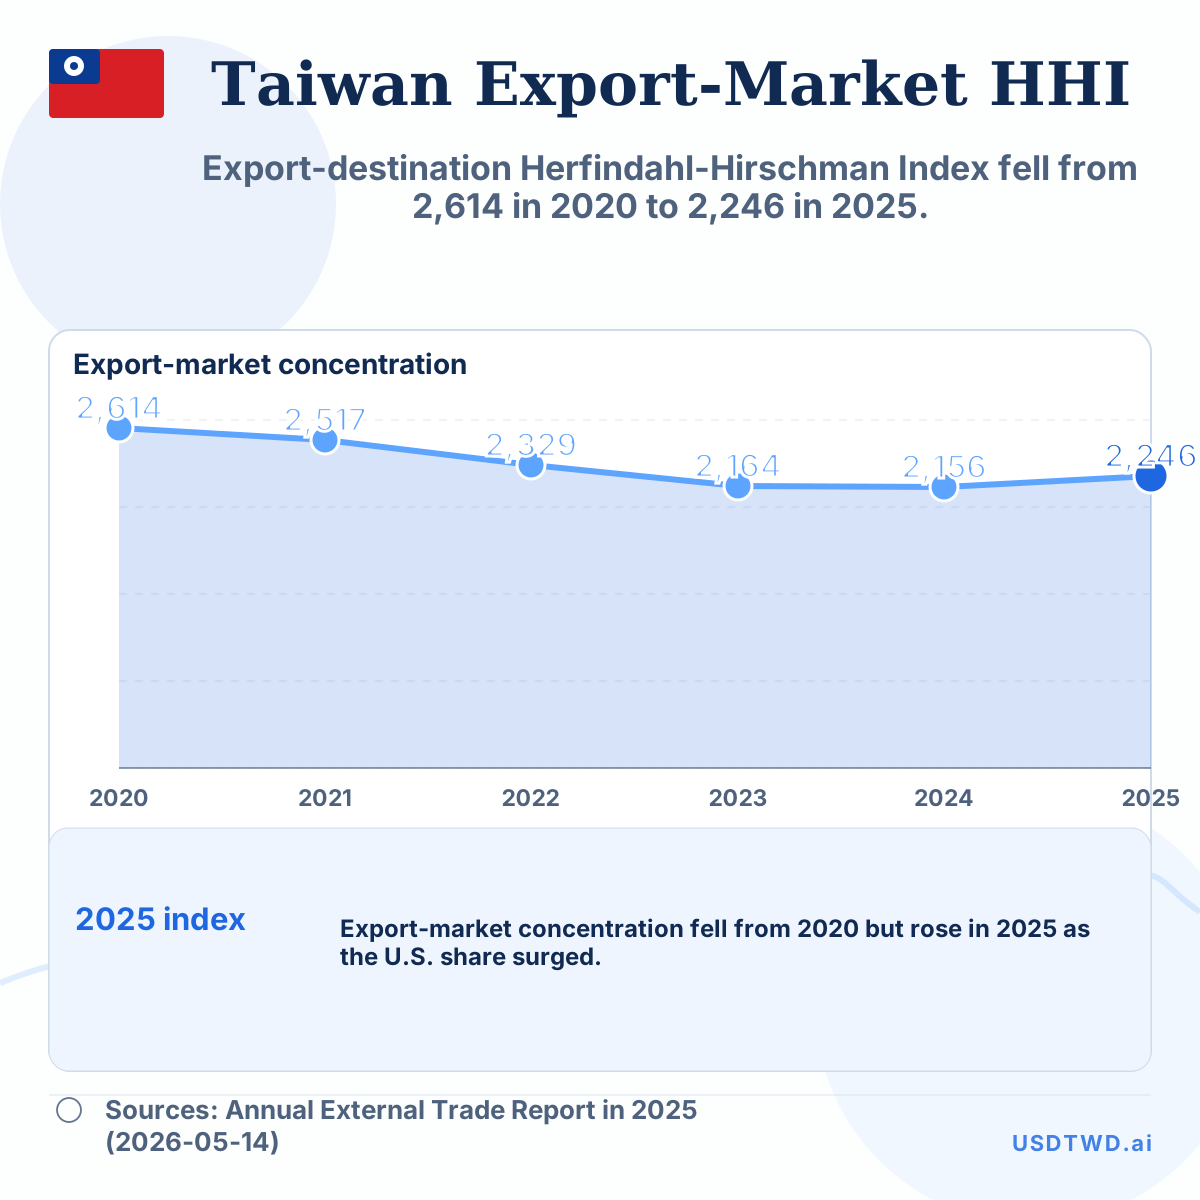
Export-destination Herfindahl-Hirschman Index fell from 2,614 in 2020 to 2,246 in 2025.
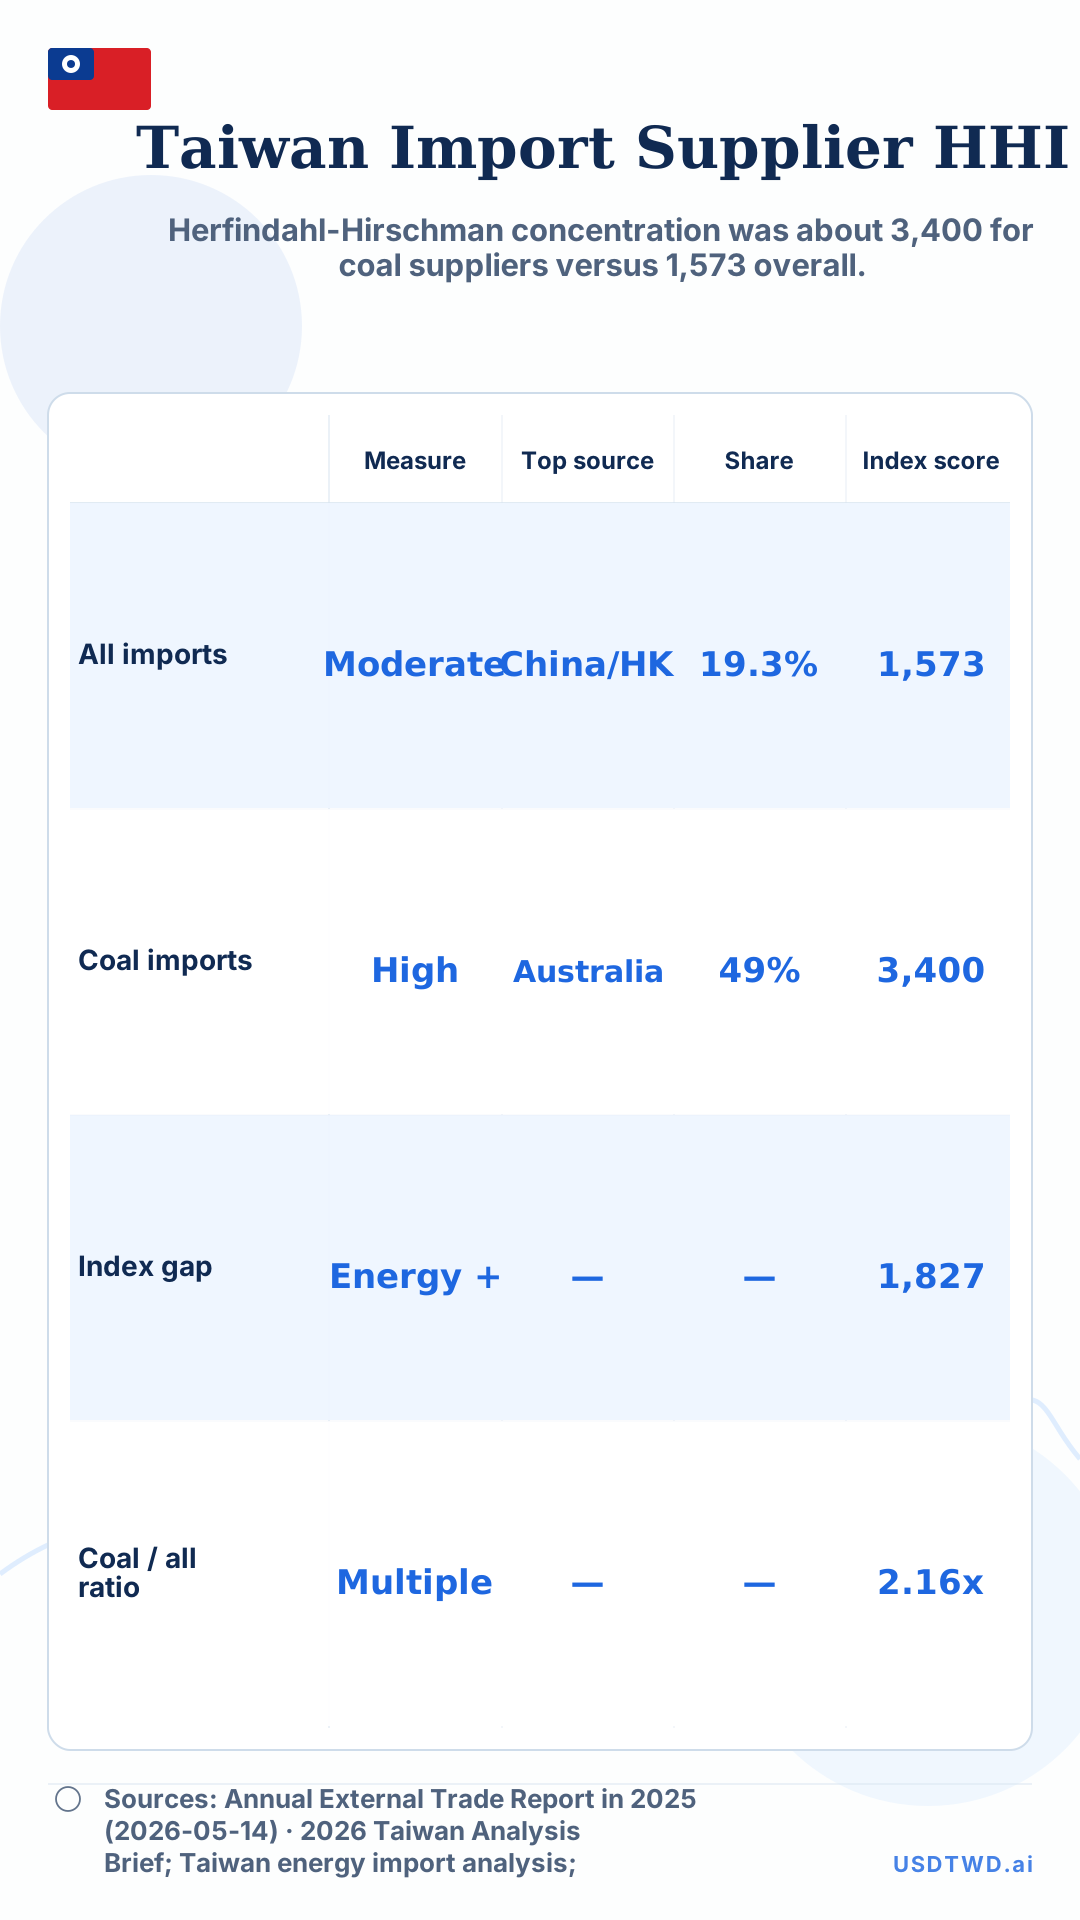
Herfindahl-Hirschman concentration was about 3,400 for coal suppliers versus 1,573 overall.
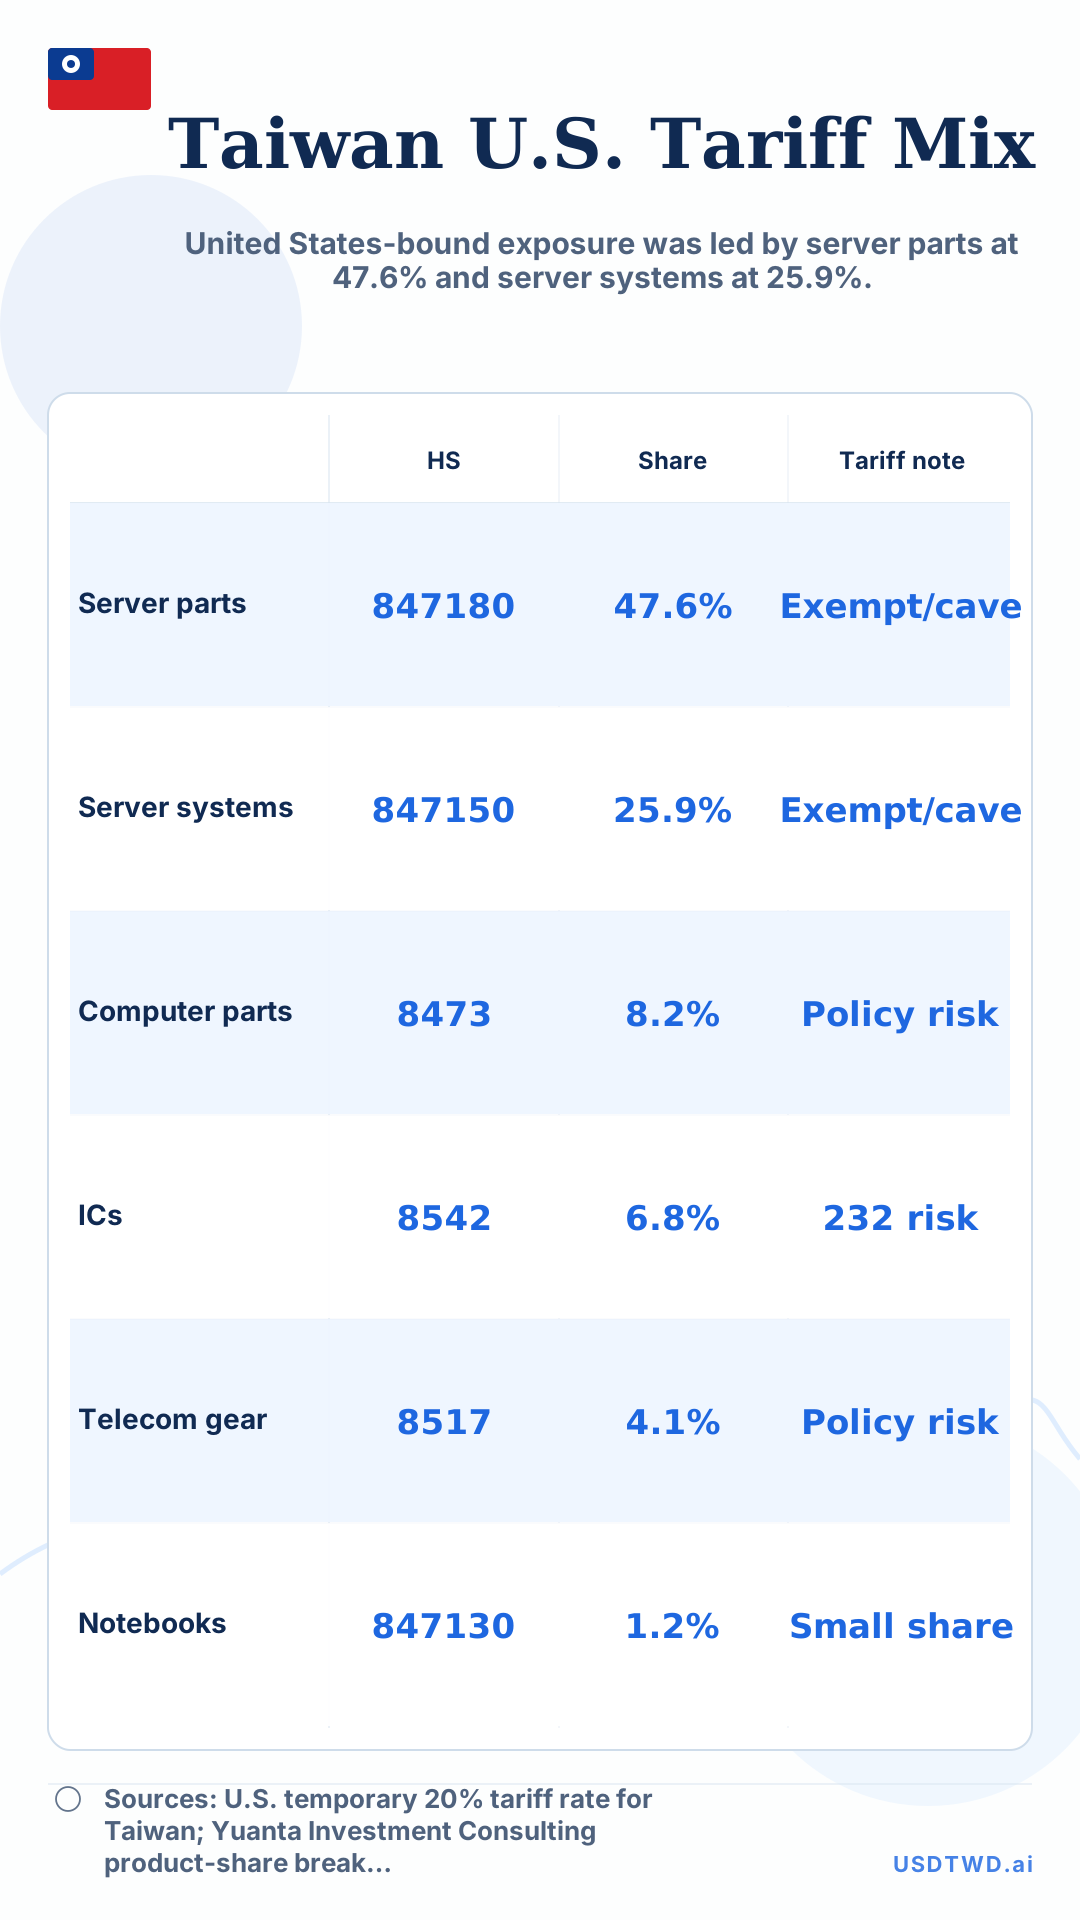
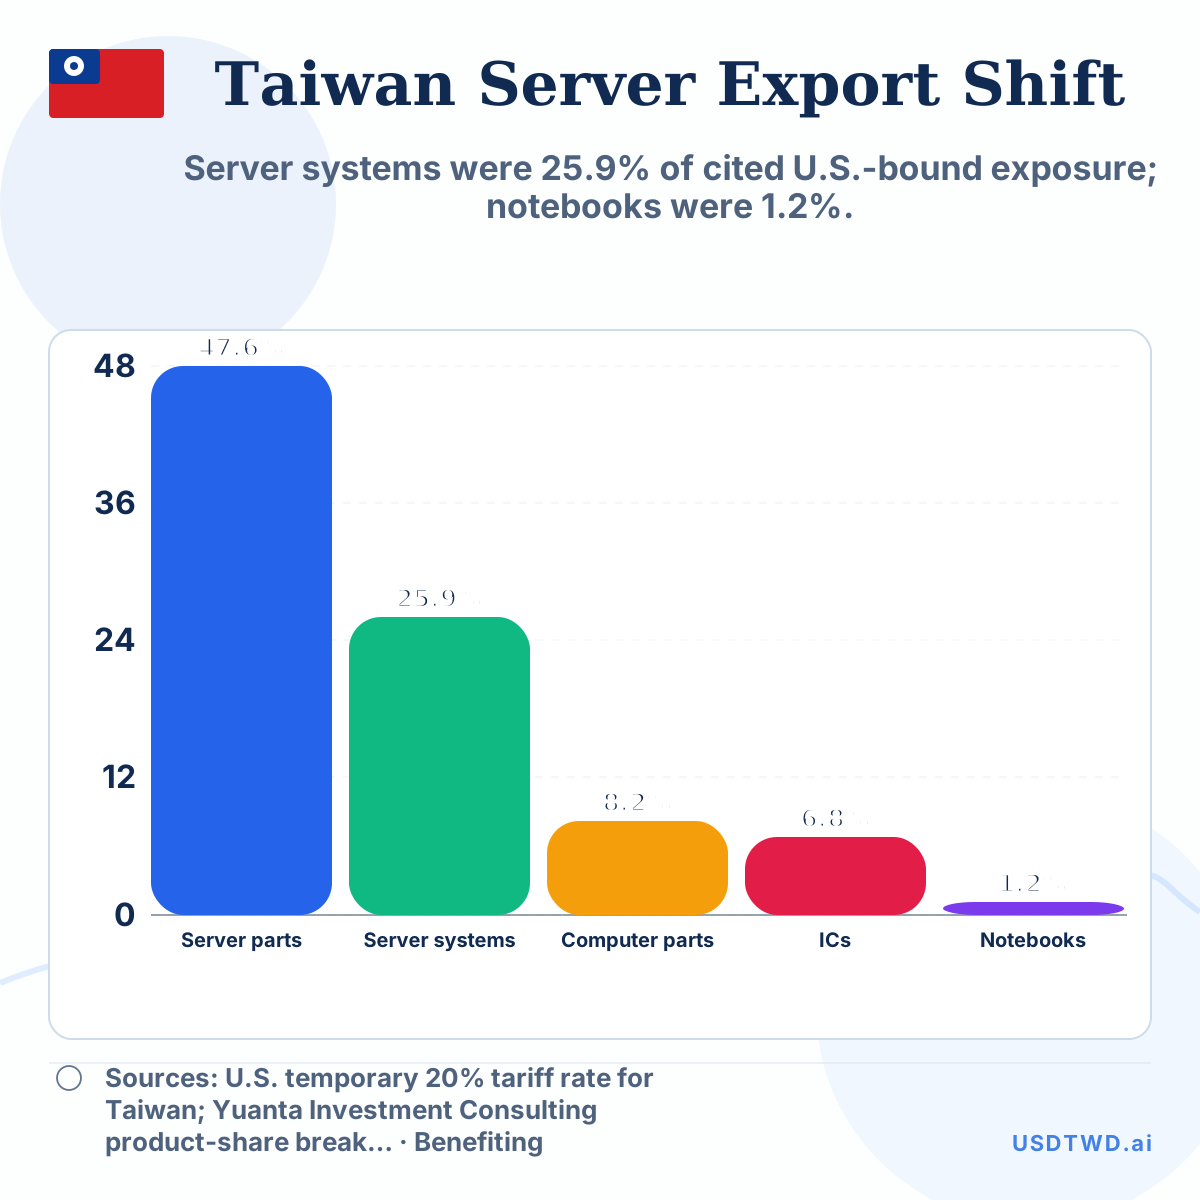
United States-bound exposure was led by server parts at 47.6% and server systems at 25.9%.
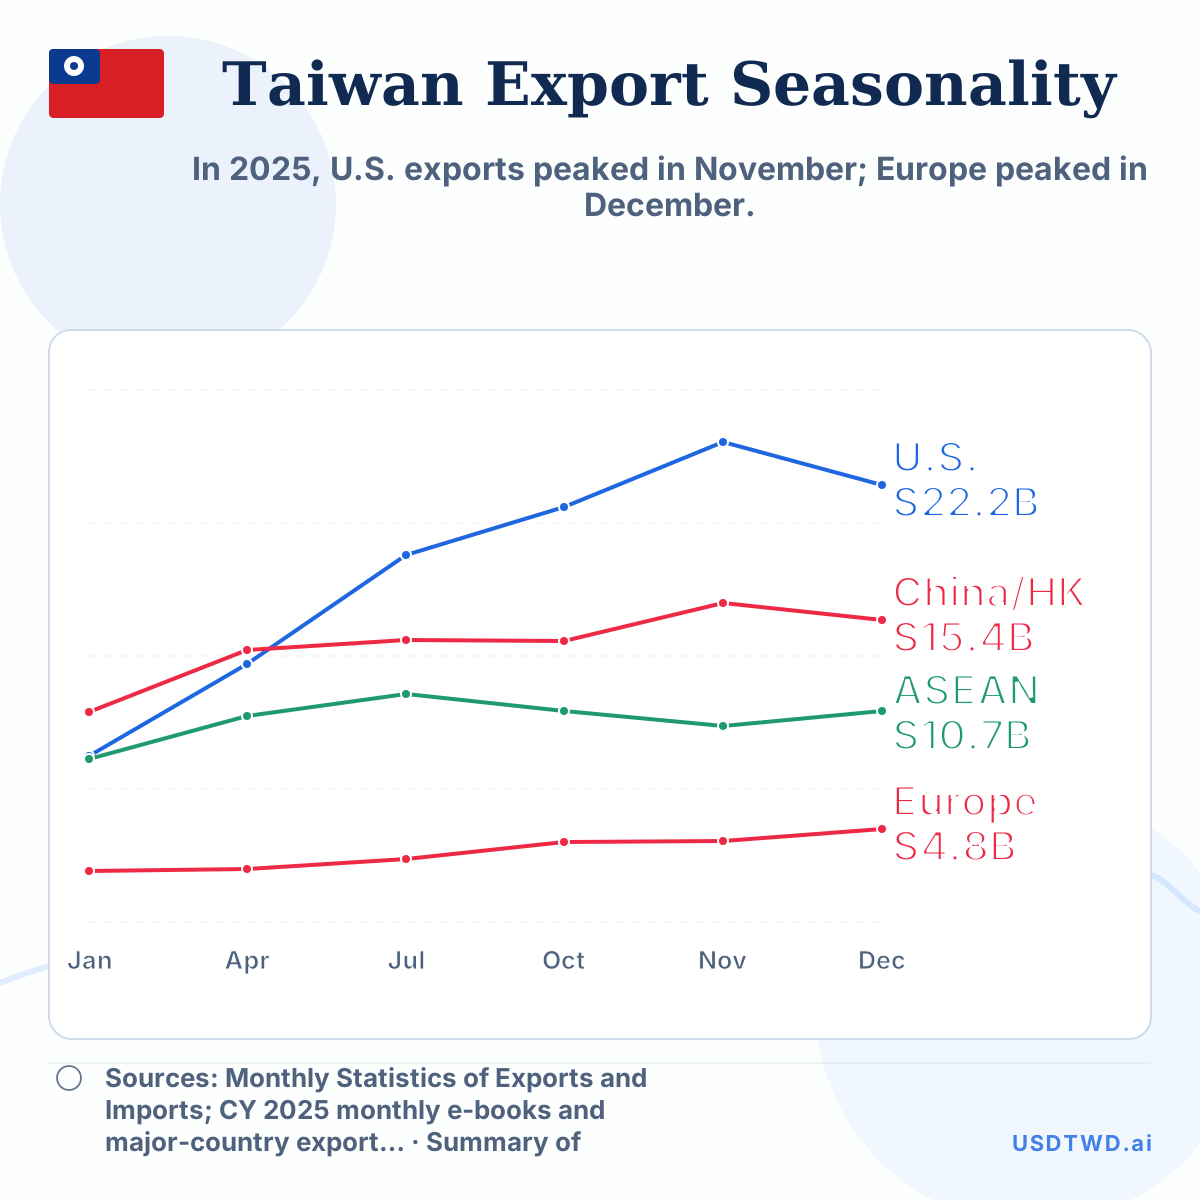
In 2025, U.S. exports peaked in November; Europe peaked in December.
Server systems were 25.9% of cited U.S.-bound exposure; notebooks were 1.2%.
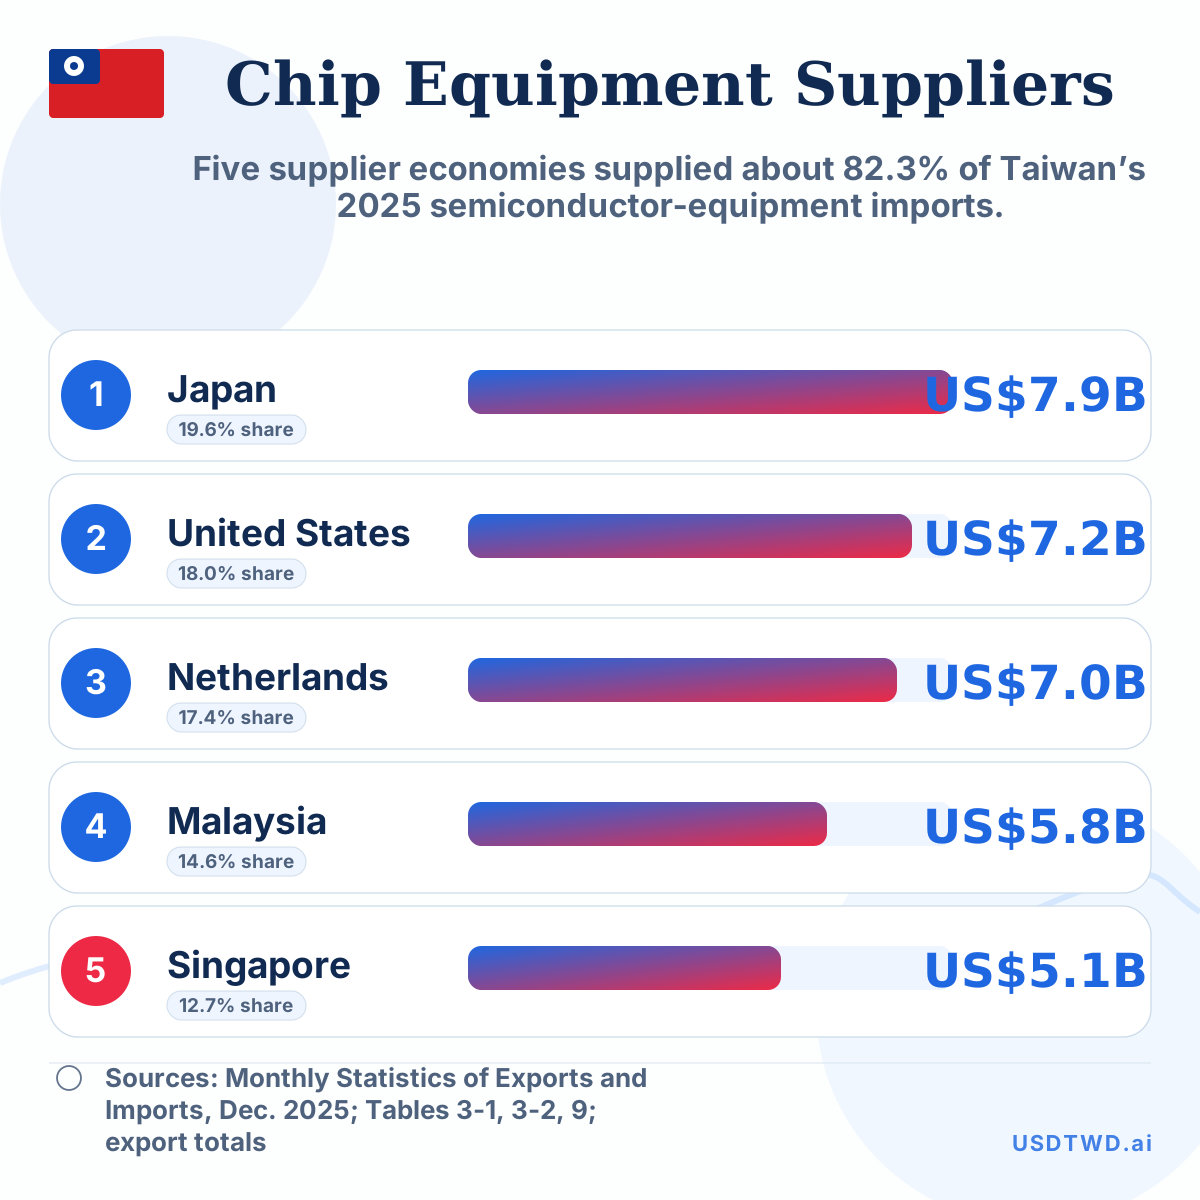
Five supplier economies supplied about 82.3% of Taiwan’s 2025 semiconductor-equipment imports.
Electronic-product orders were about 131% of electronic-parts customs exports in 2025.
Taiwan’s 2025 goods exports equalled about US$95.1k per export container.