Start with these Economy graphics
Newest source-labelled pages in this topic, with source blocks and data tables attached.
Graphics archive
GDP, trade, productivity, income, industrial structure and national-accounts graphics that explain Taiwan’s macro engine.
Newest source-labelled pages in this topic, with source blocks and data tables attached.
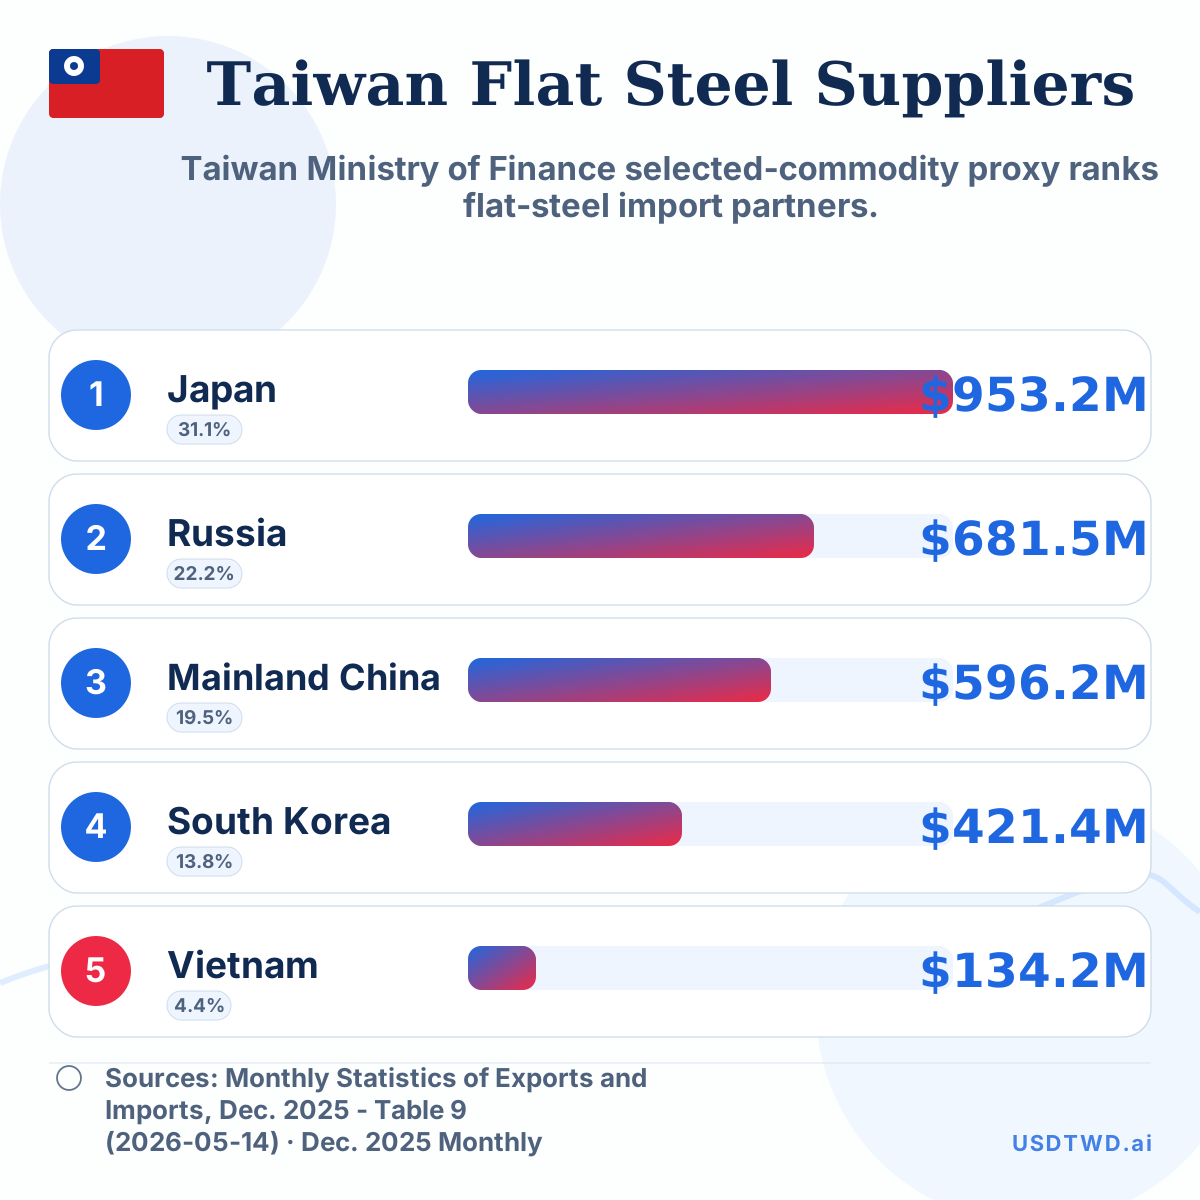
Taiwan Ministry of Finance selected-commodity proxy ranks flat-steel import partners.
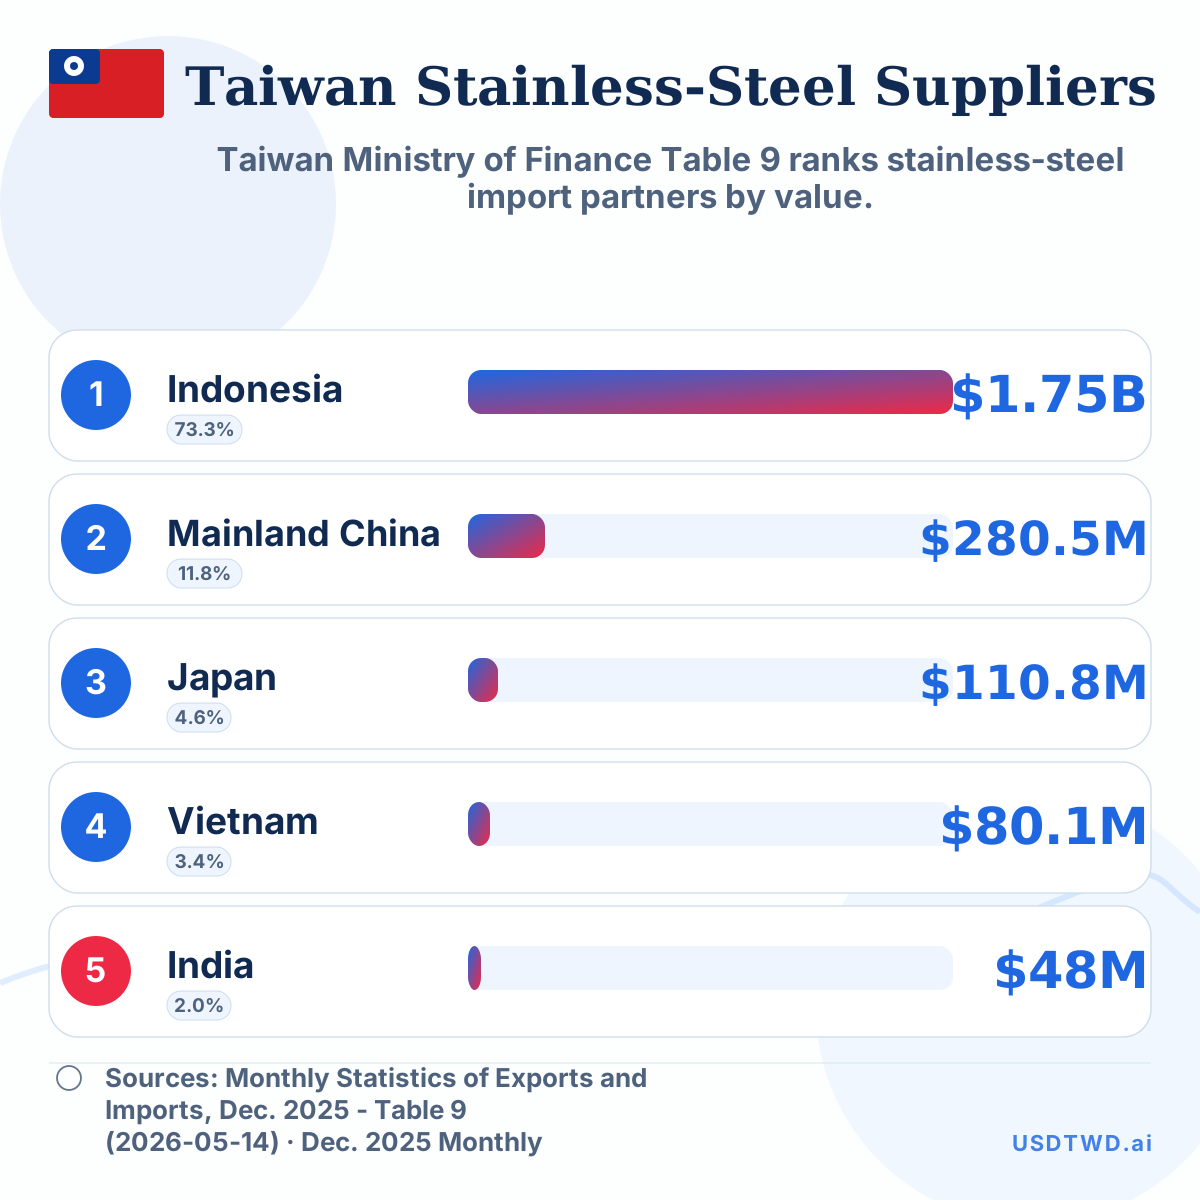
Taiwan Ministry of Finance Table 9 ranks stainless-steel import partners by value.
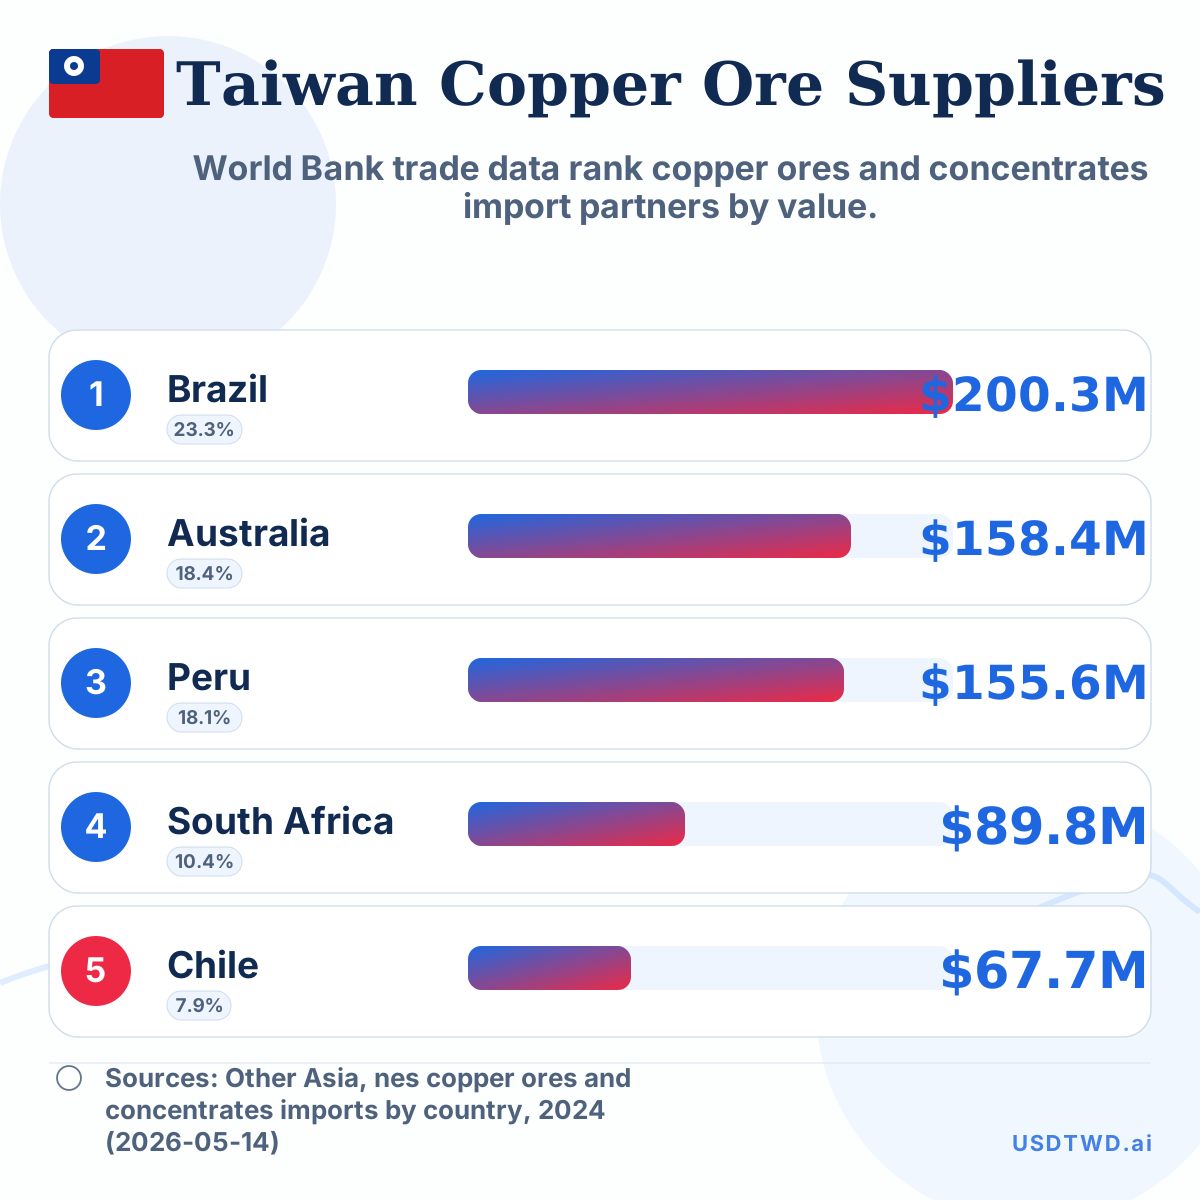
World Bank trade data rank copper ores and concentrates import partners by value.
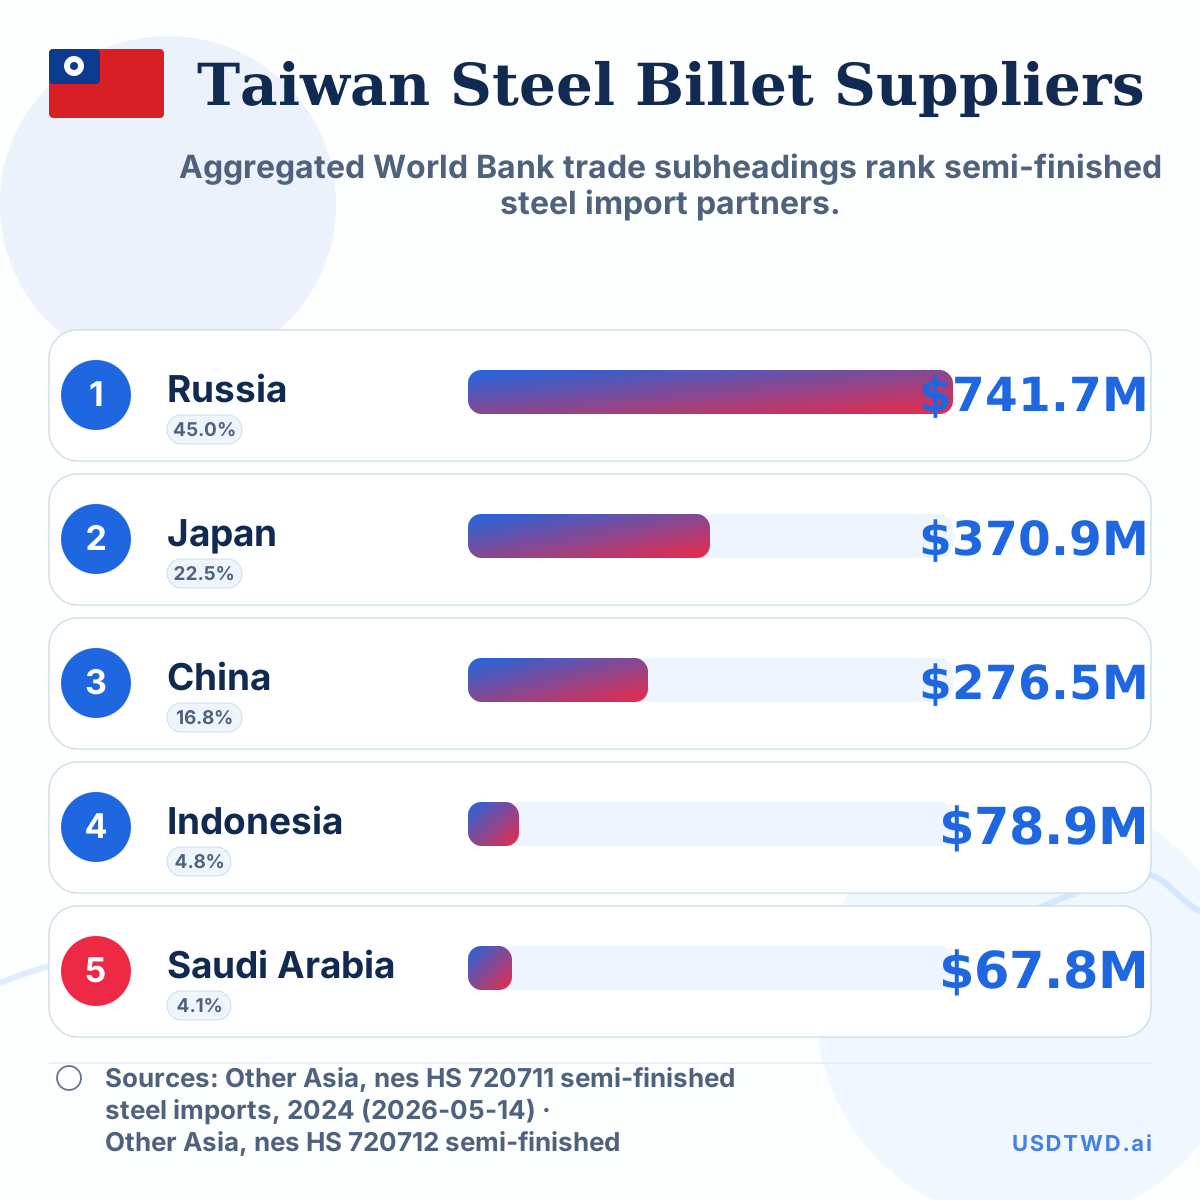
Aggregated World Bank trade subheadings rank semi-finished steel import partners.
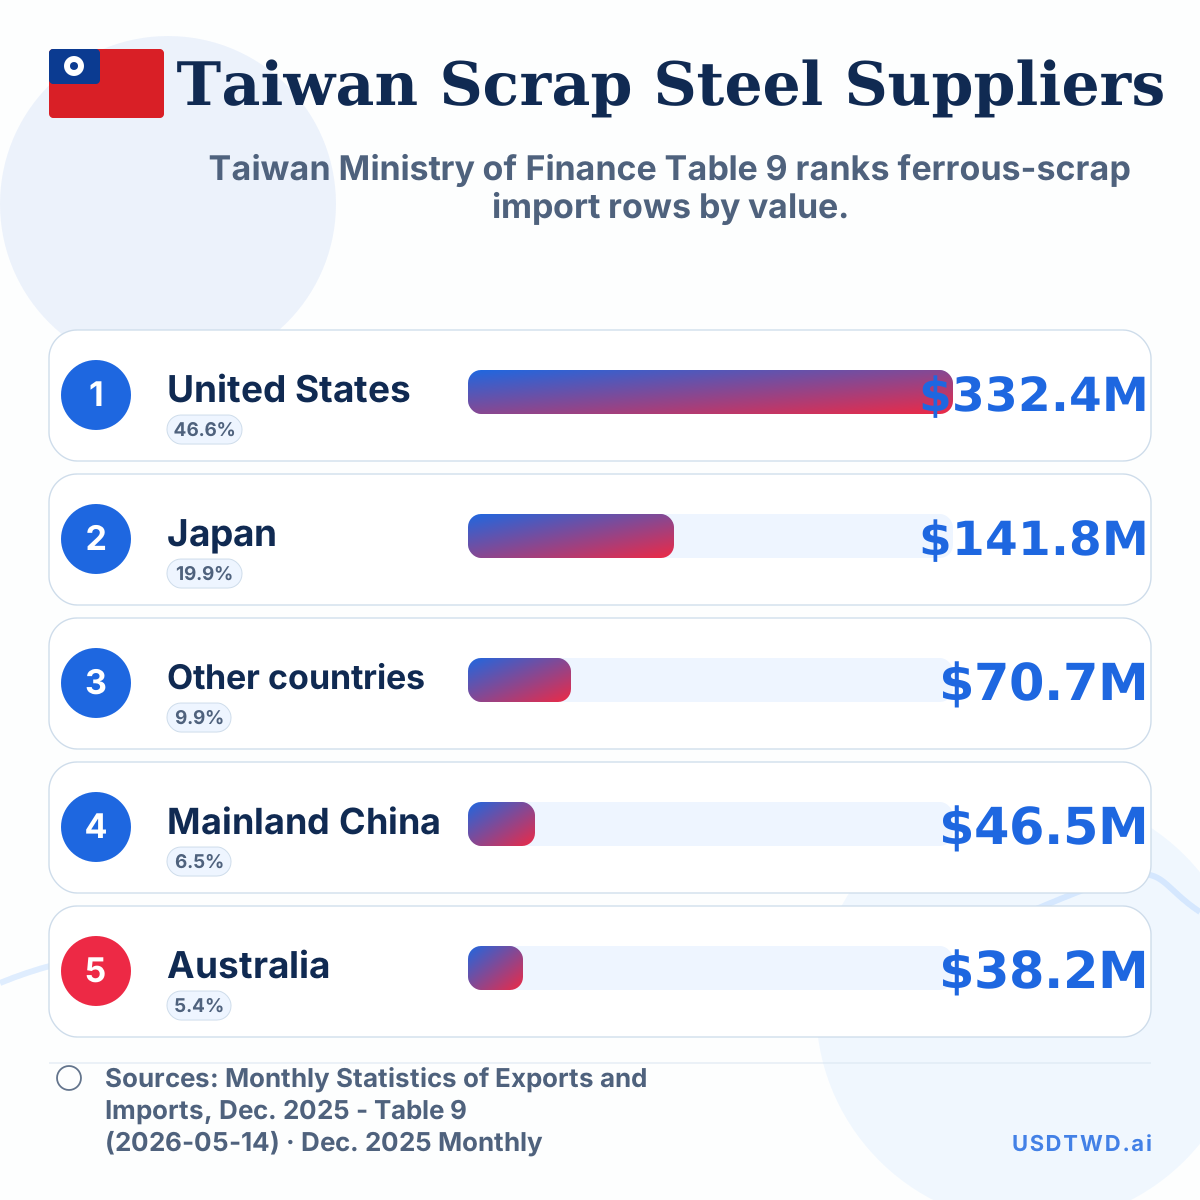
Taiwan Ministry of Finance Table 9 ranks ferrous-scrap import rows by value.
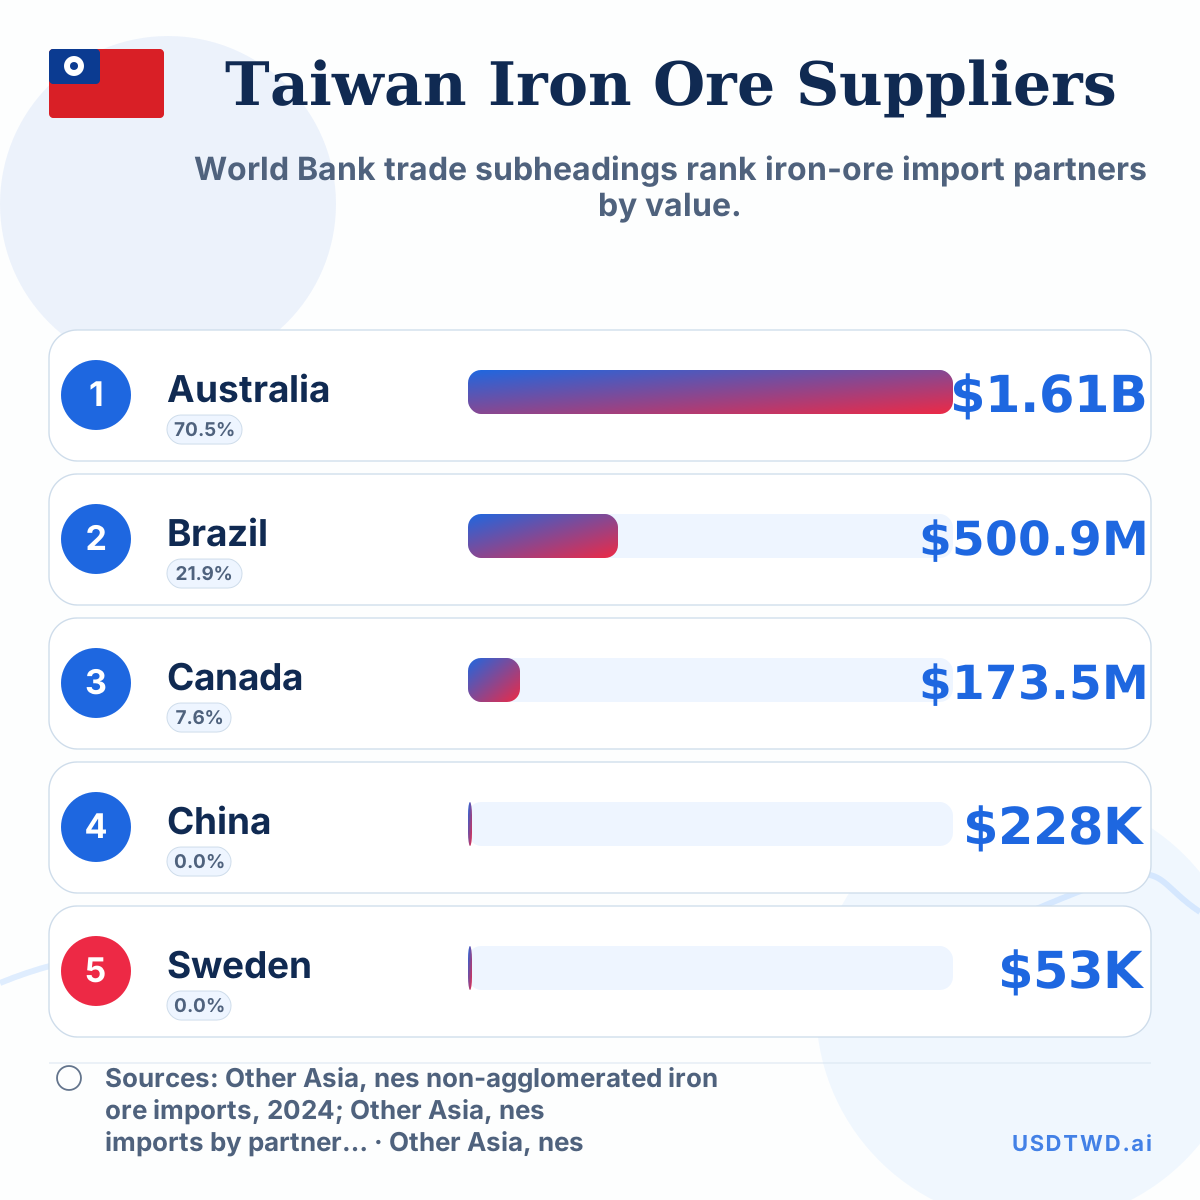
World Bank trade subheadings rank iron-ore import partners by value.
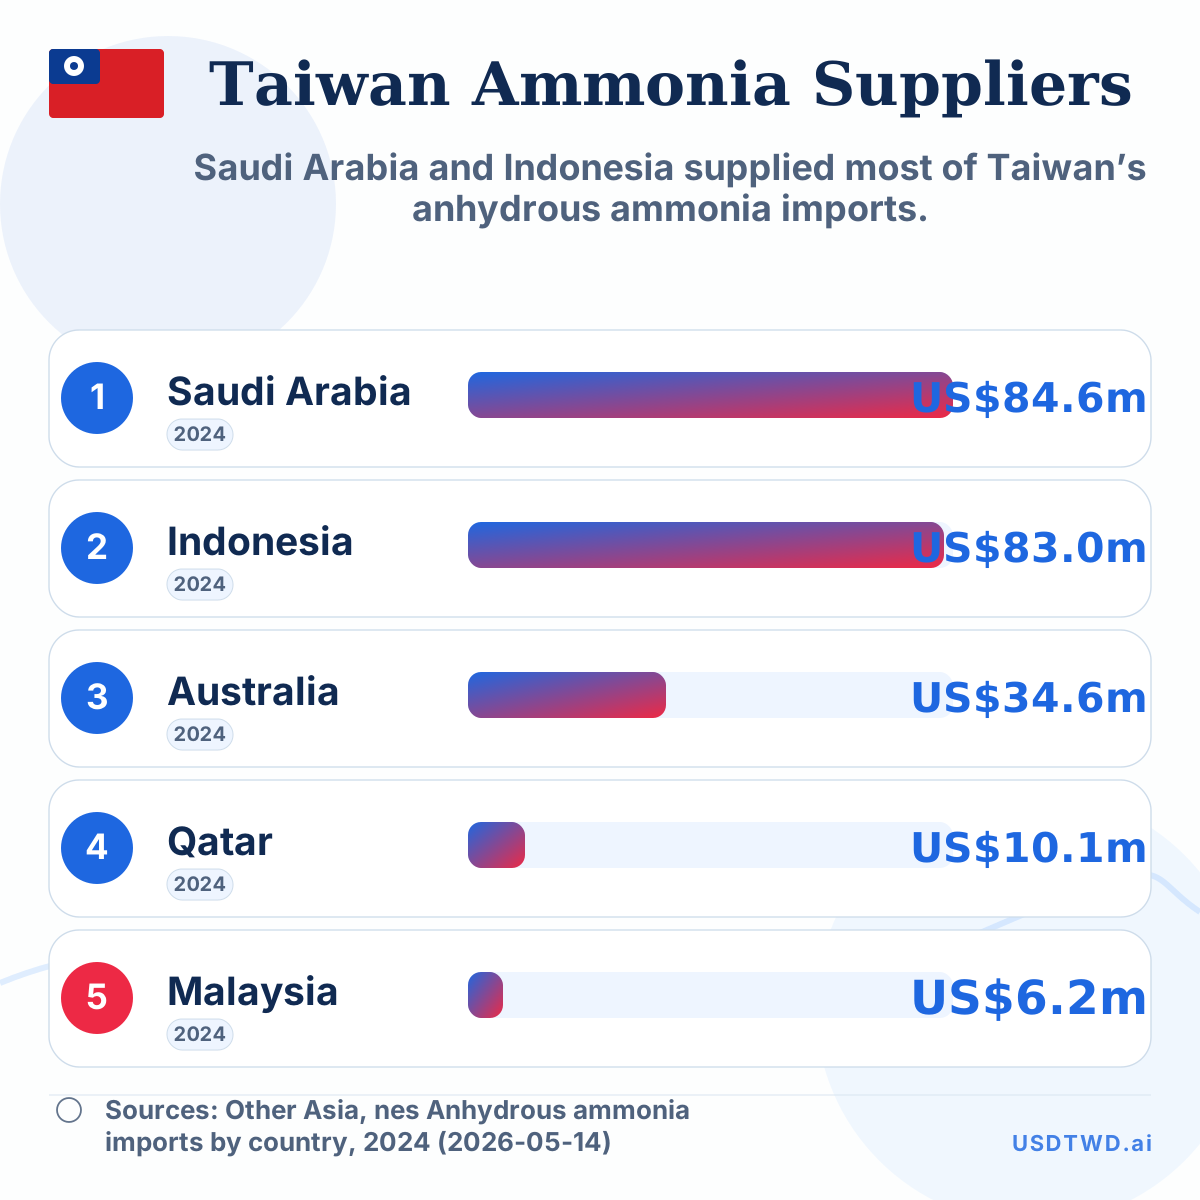
Saudi Arabia and Indonesia supplied most of Taiwan’s anhydrous ammonia imports.
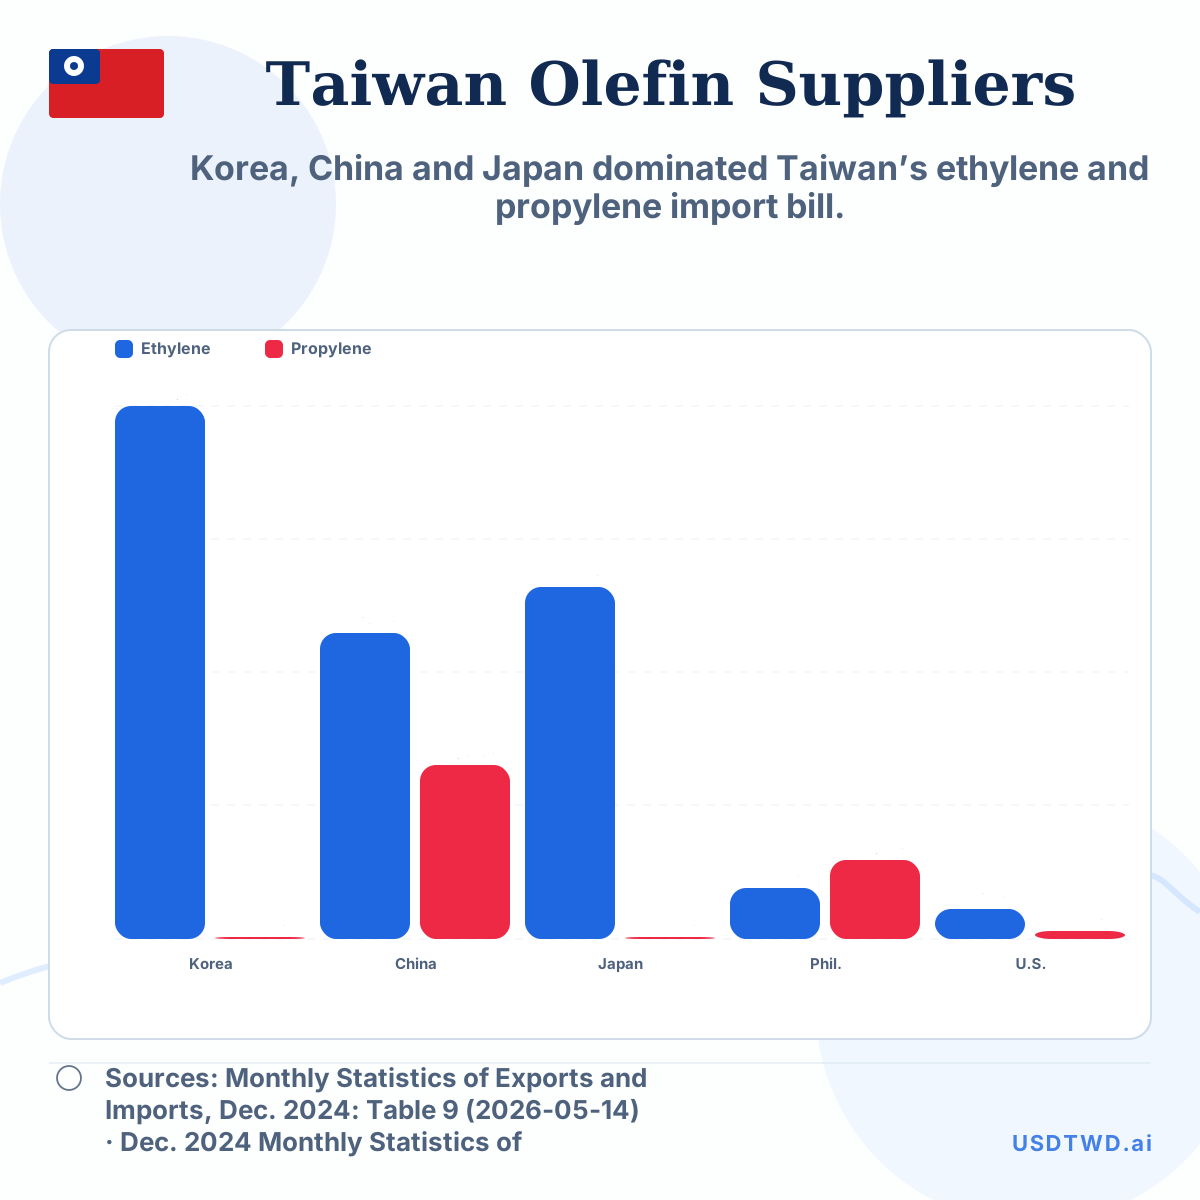
Korea, China and Japan dominated Taiwan’s ethylene and propylene import bill.
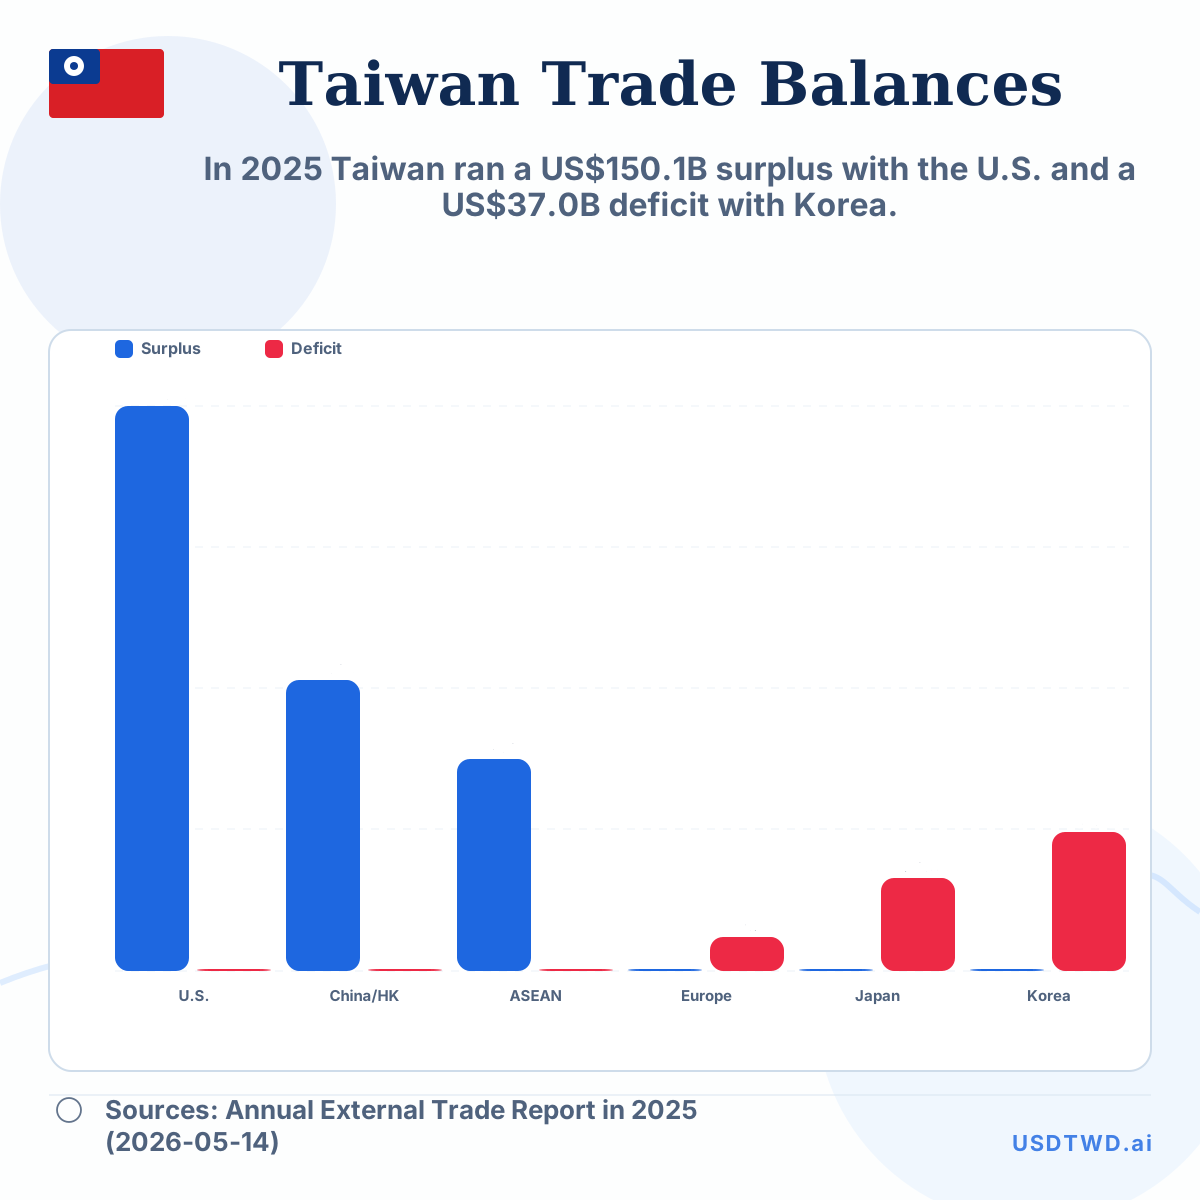
In 2025 Taiwan ran a US$150.1B surplus with the U.S. and a US$37.0B deficit with Korea.
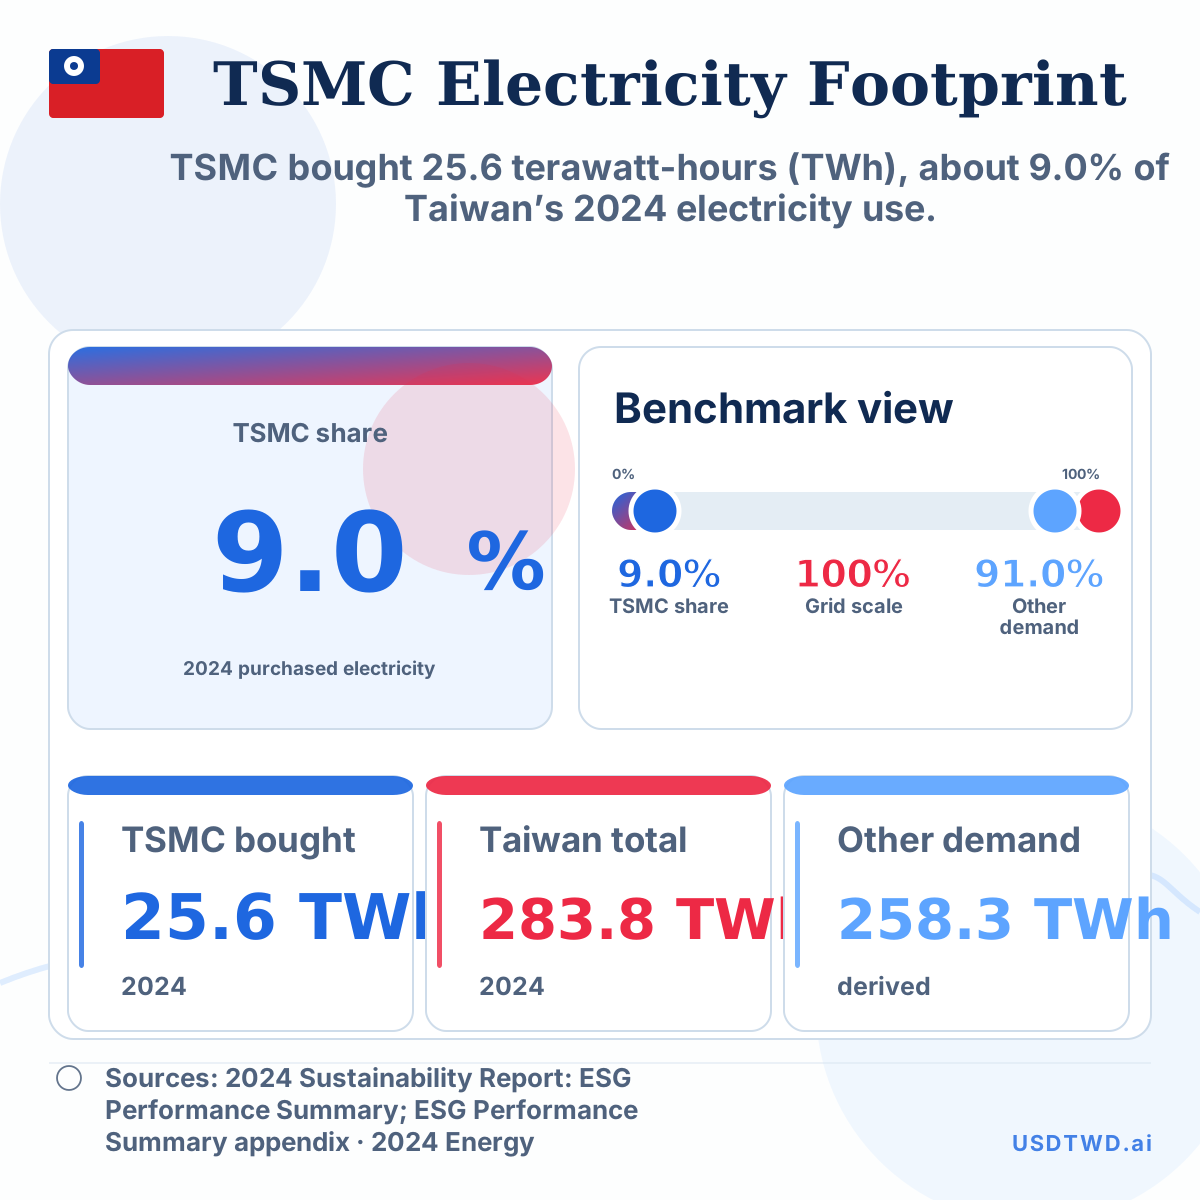
TSMC bought 25.6 terawatt-hours (TWh), about 9.0% of Taiwan’s 2024 electricity use.