Start with these Economy graphics
Newest source-labelled pages in this topic, with source blocks and data tables attached.
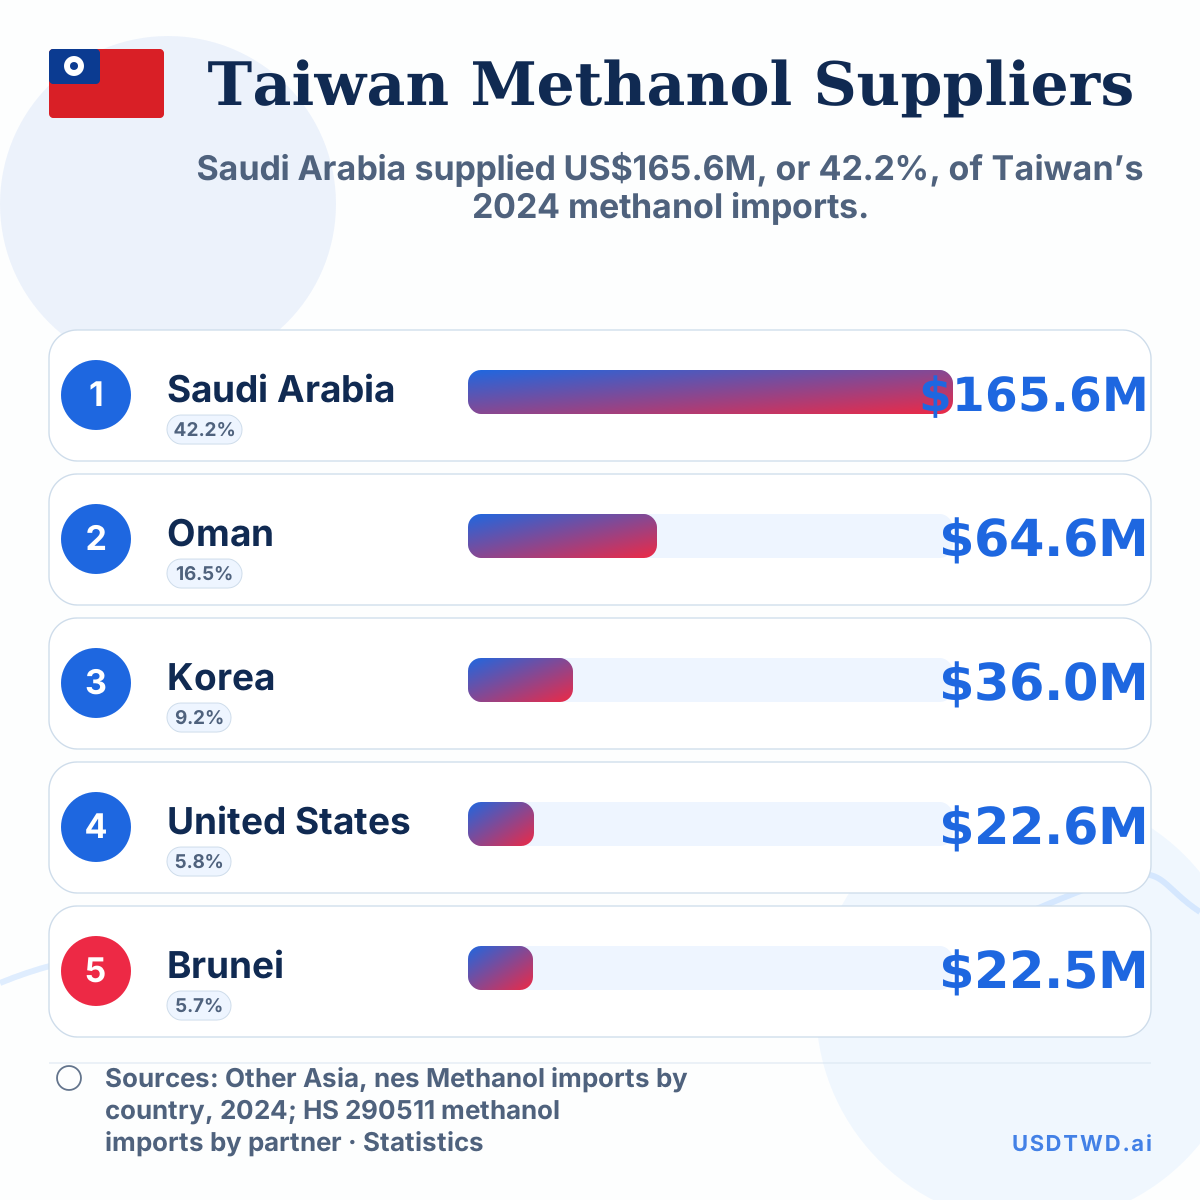 Taiwan’s 5 largest methanol suppliersSaudi Arabia supplied US$165.6M, or 42.2%, of Taiwan’s 2024 methanol imports.
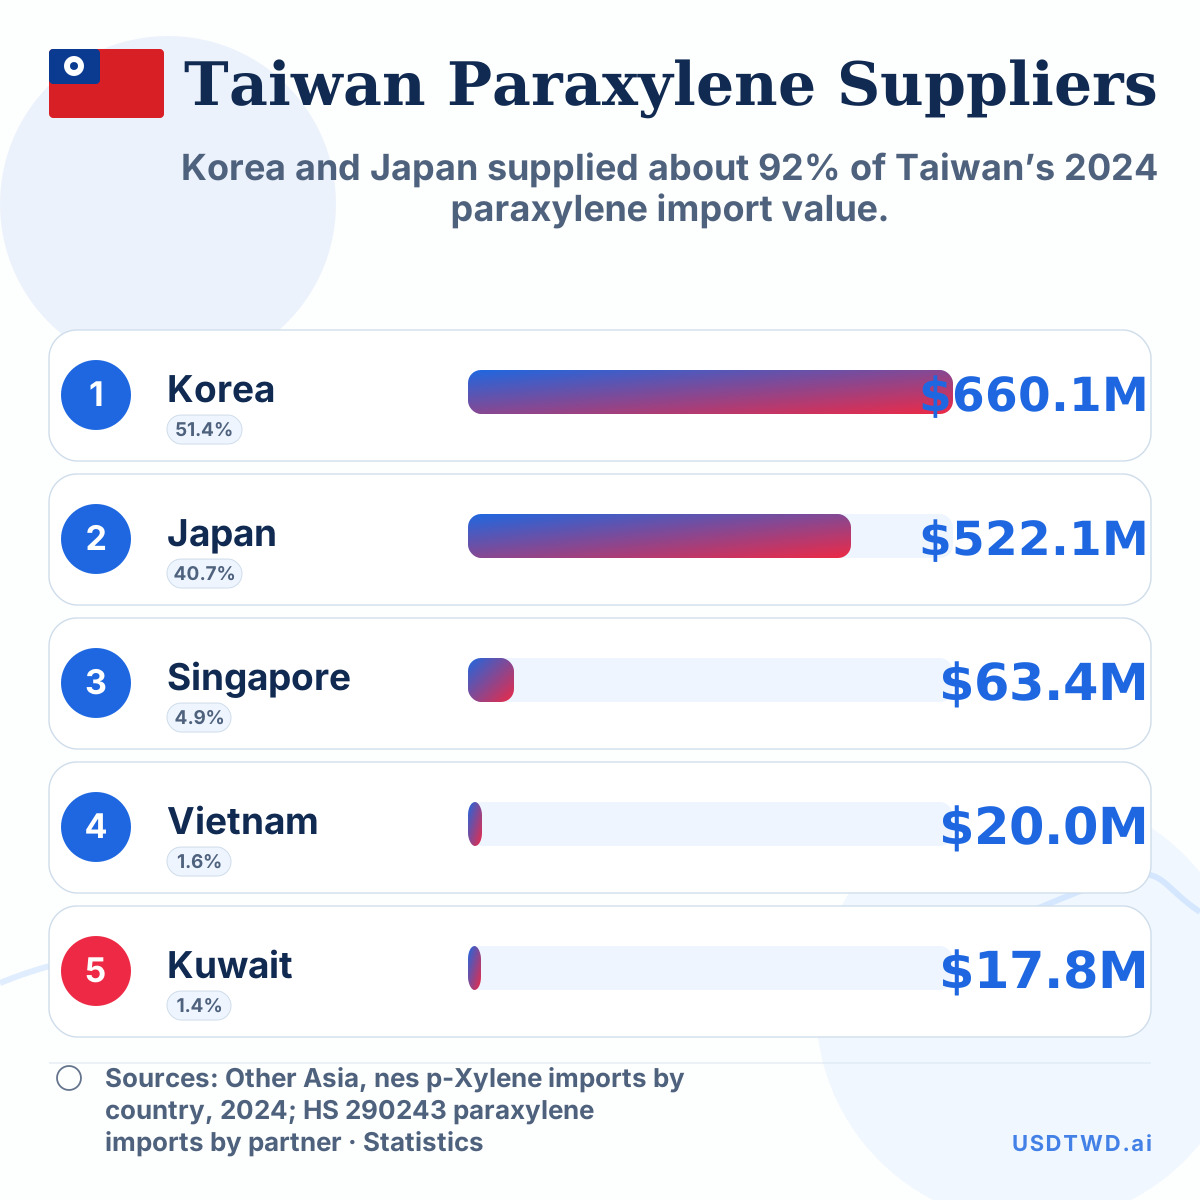 Taiwan’s 5 largest paraxylene suppliersKorea and Japan supplied about 92% of Taiwan’s 2024 paraxylene import value.
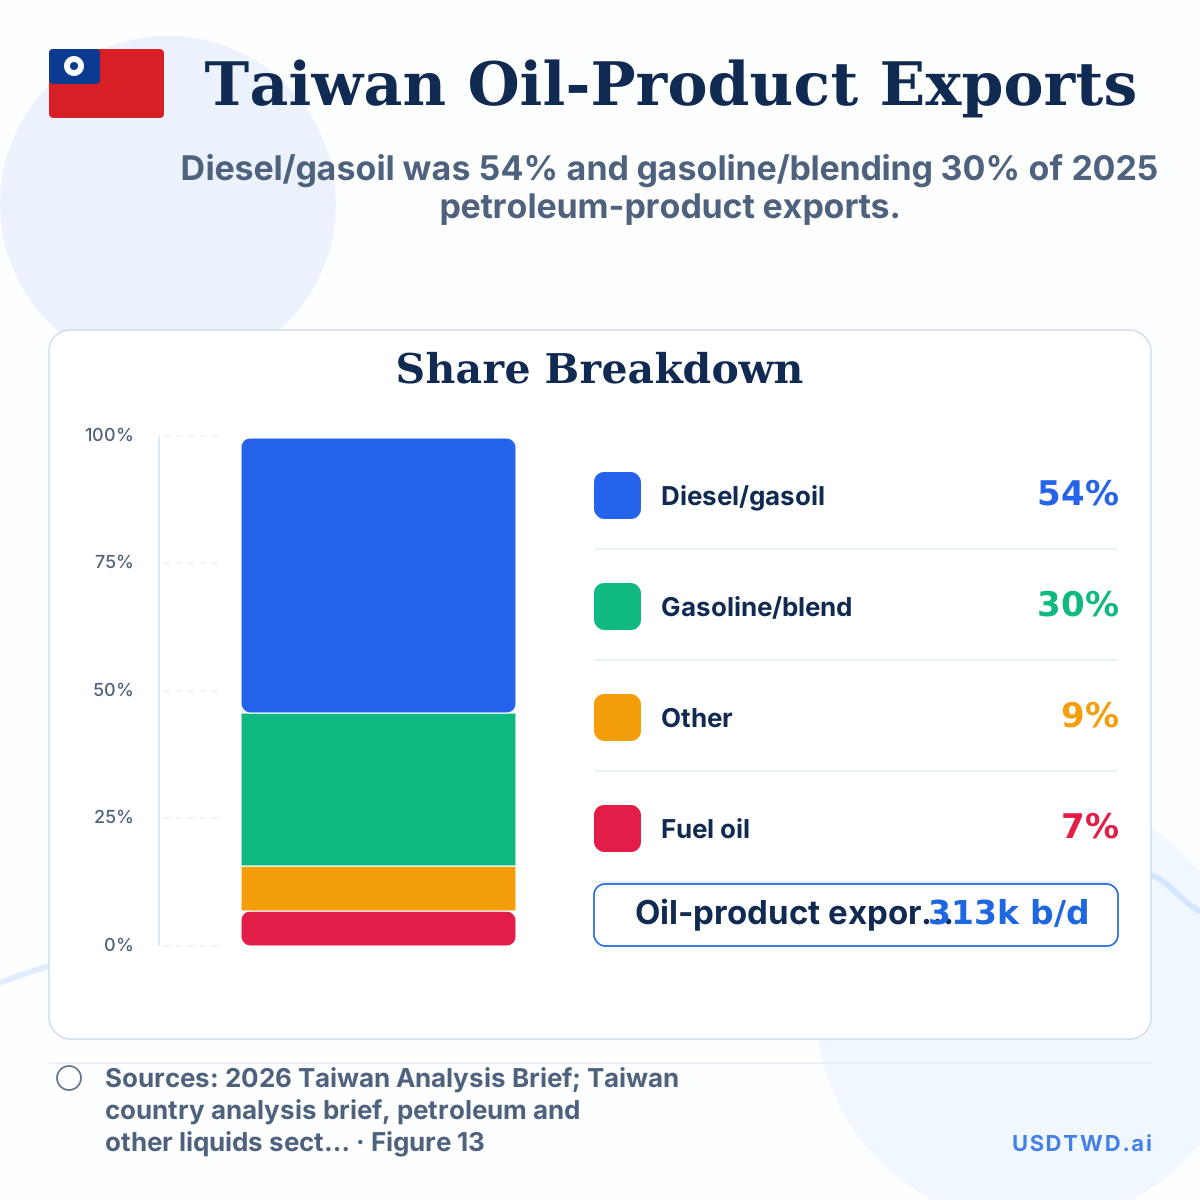 Taiwan petroleum-product exports by typeDiesel/gasoil was 54% and gasoline/blending 30% of 2025 petroleum-product exports.