Start with these Economy graphics
Newest source-labelled pages in this topic, with source blocks and data tables attached.
Graphics archive
GDP, trade, productivity, income, industrial structure and national-accounts graphics that explain Taiwan’s macro engine.
Newest source-labelled pages in this topic, with source blocks and data tables attached.
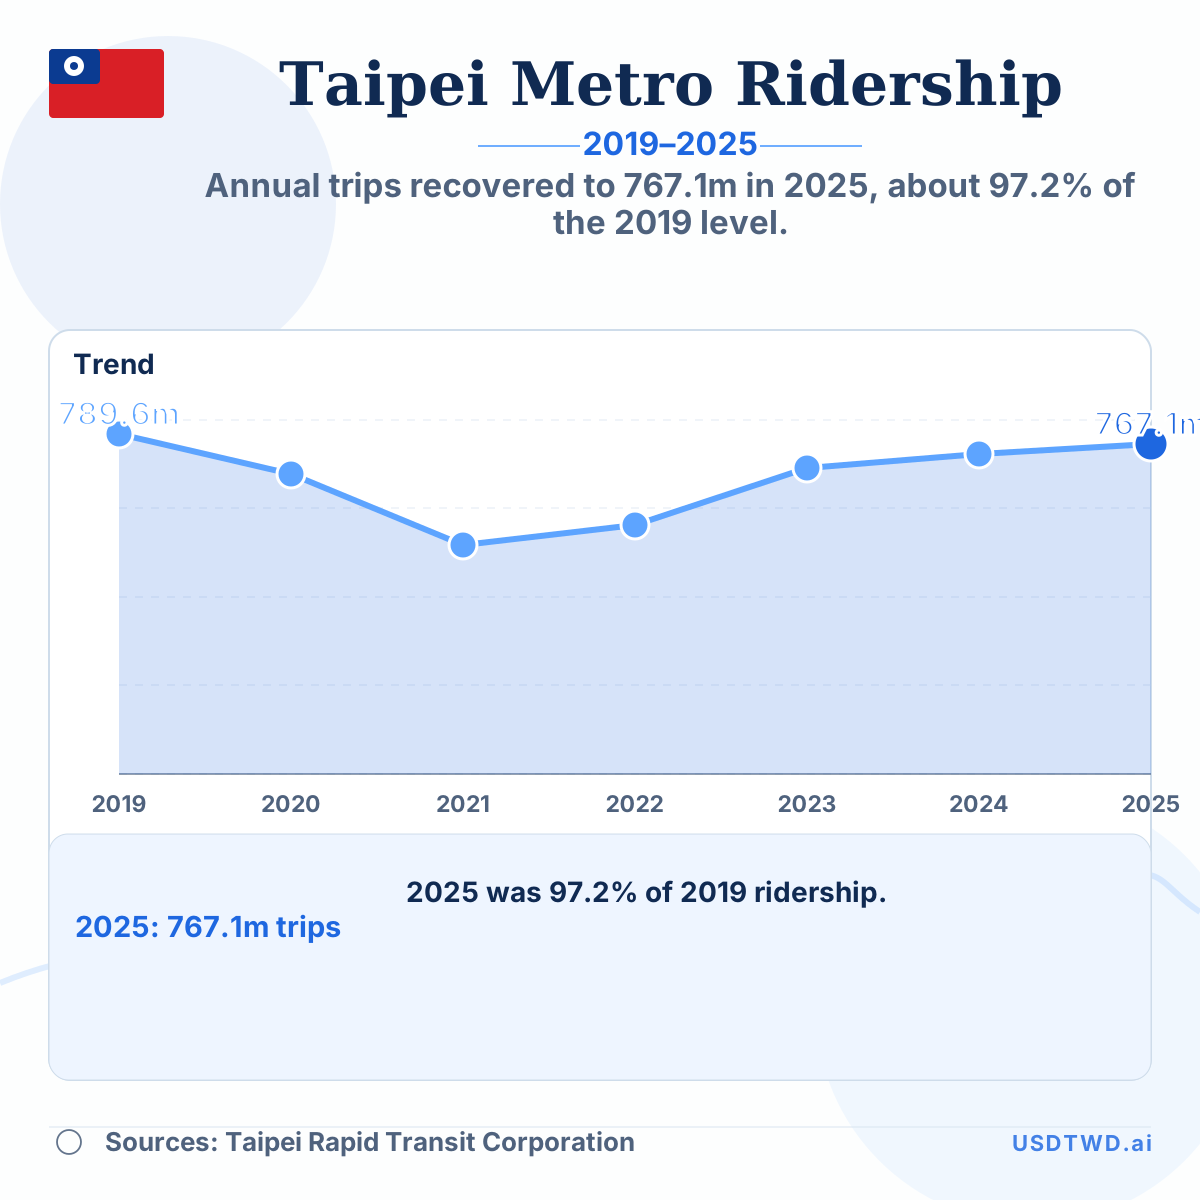
Annual trips recovered to 767.1m in 2025, about 97.2% of the 2019 level.
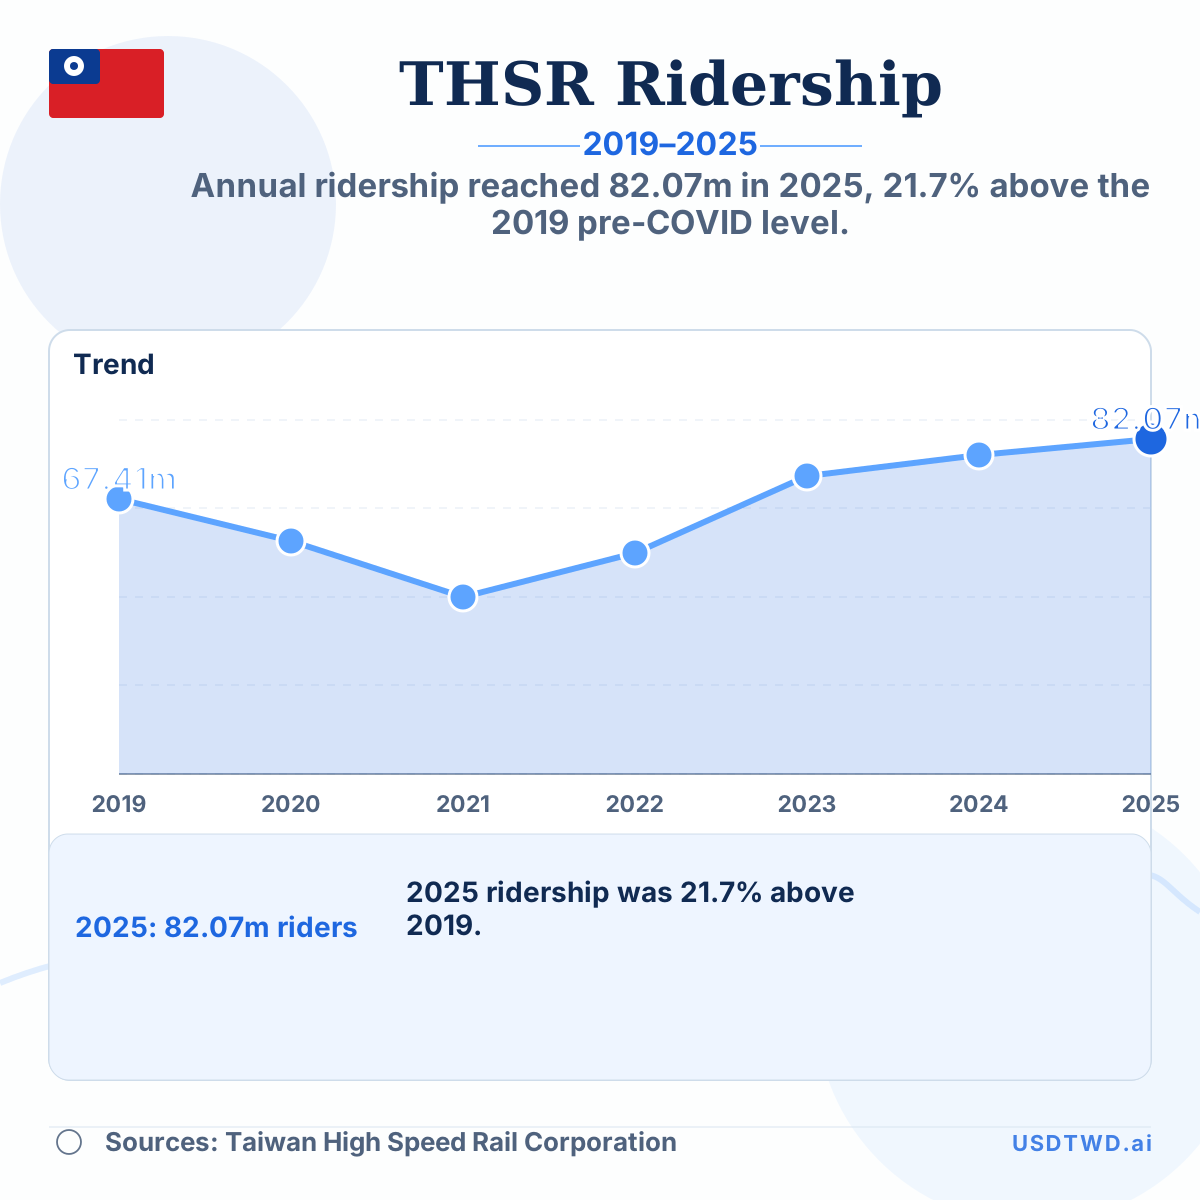
Annual ridership reached 82.07m in 2025, 21.7% above the 2019 pre-COVID level.
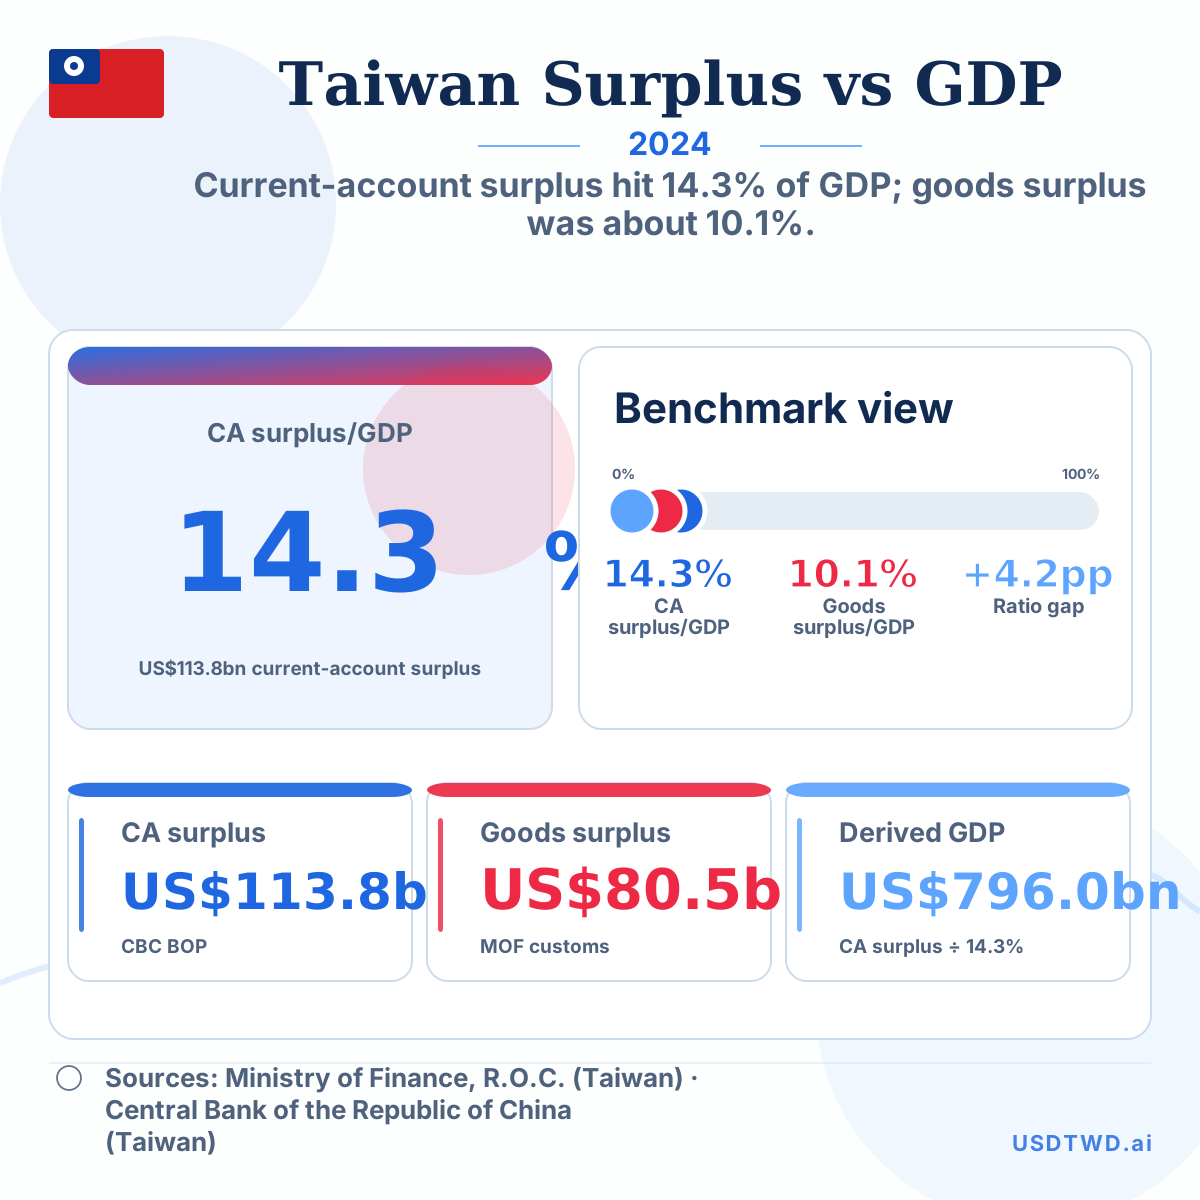
Current-account surplus hit 14.3% of GDP; goods surplus was about 10.1%.
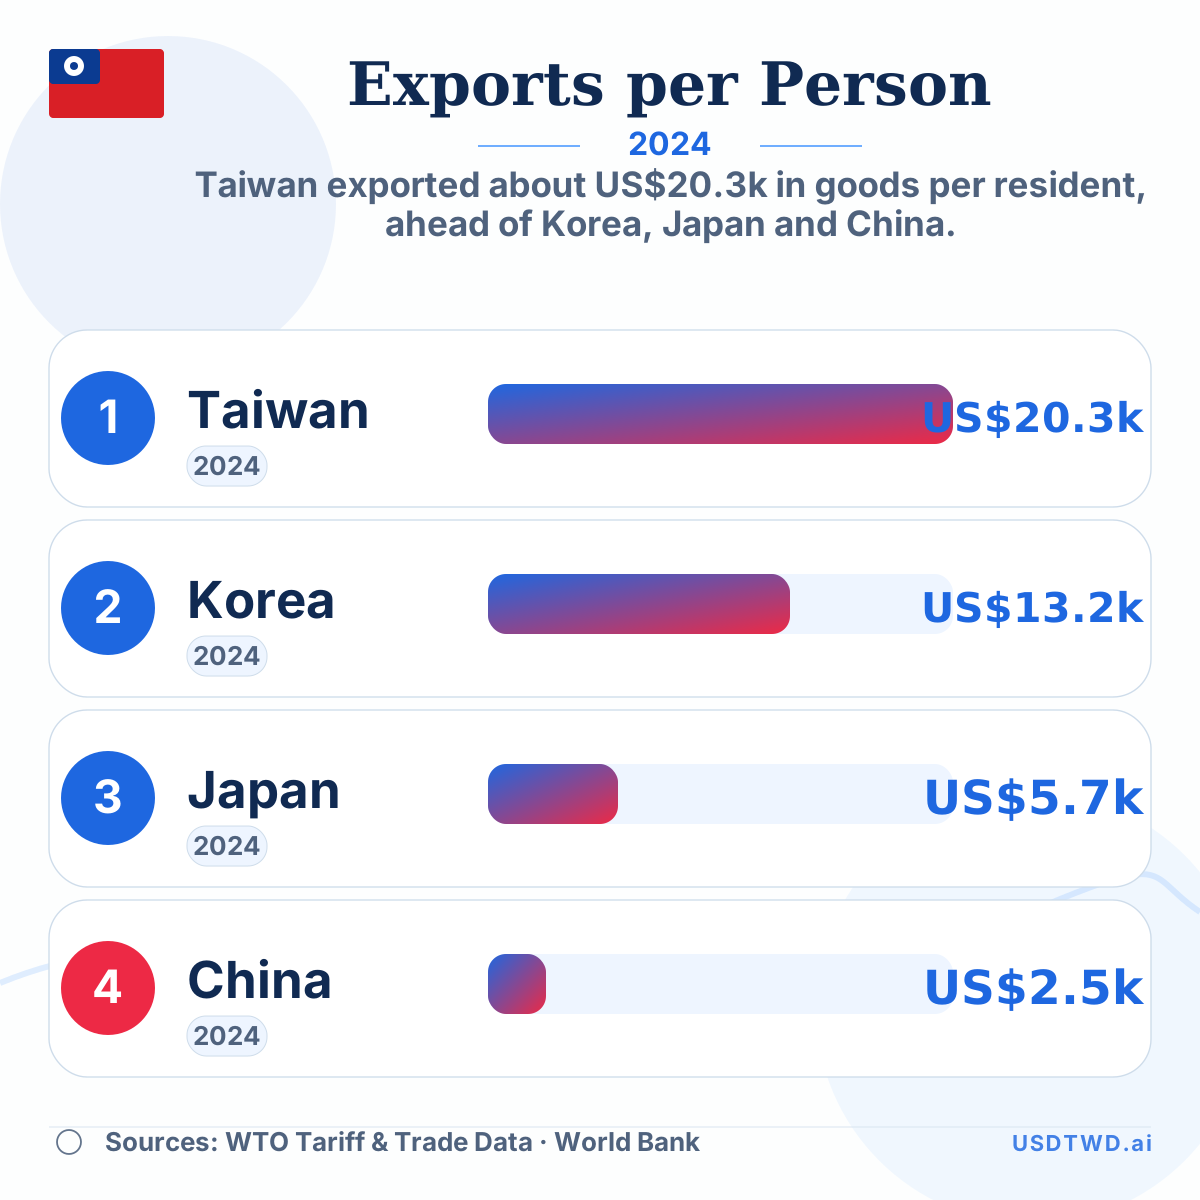
Taiwan exported about US$20.3k in goods per resident, ahead of Korea, Japan and China.
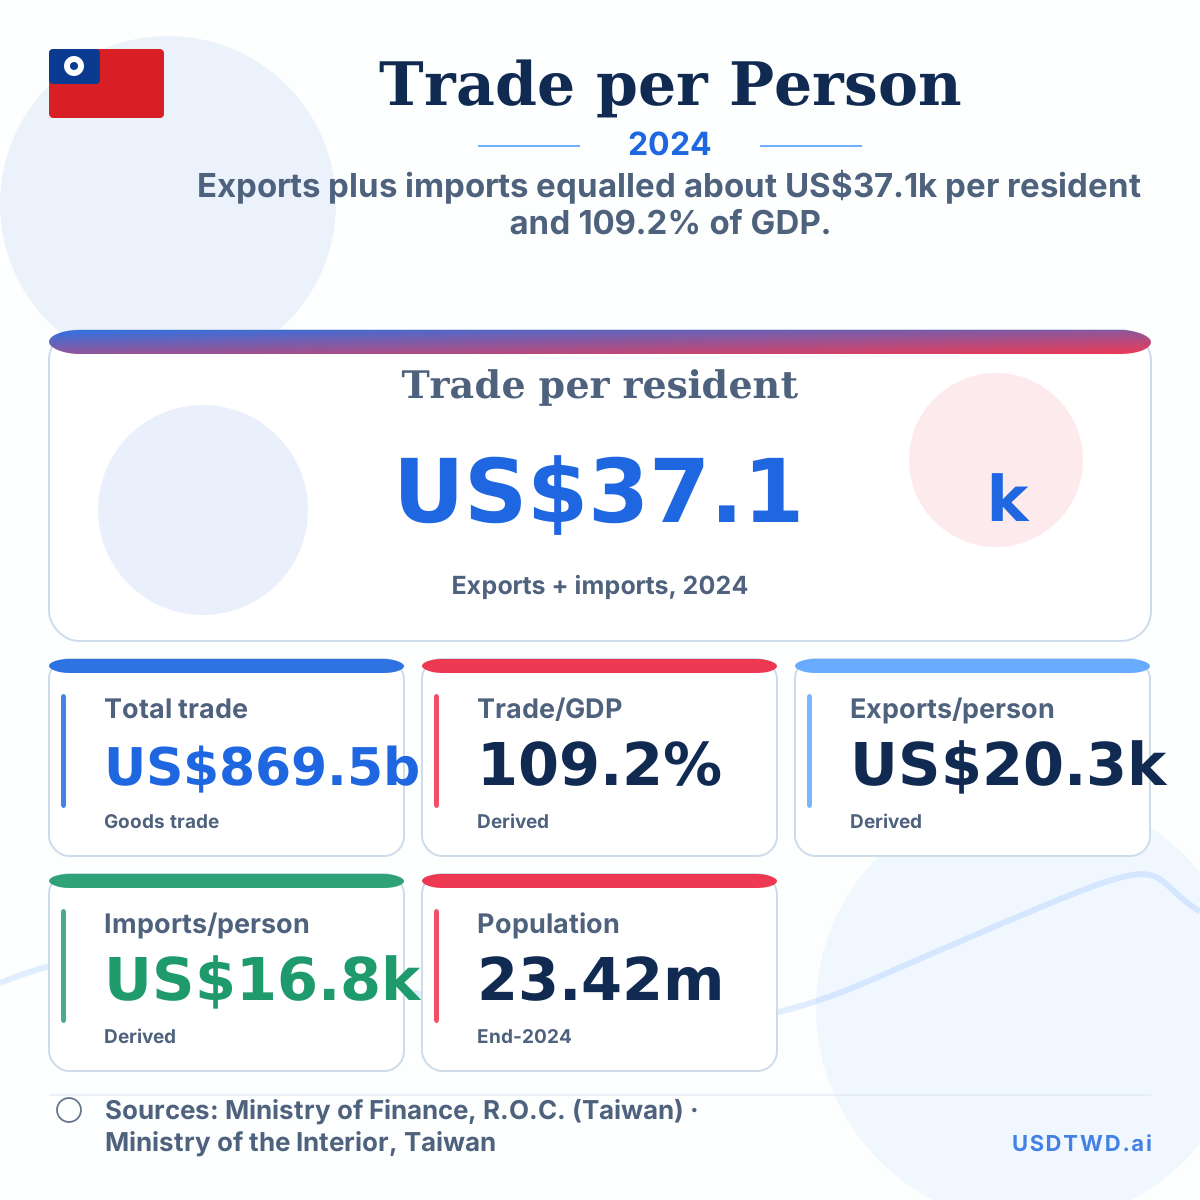
Exports plus imports equalled about US$37.1k per resident and 109.2% of GDP.
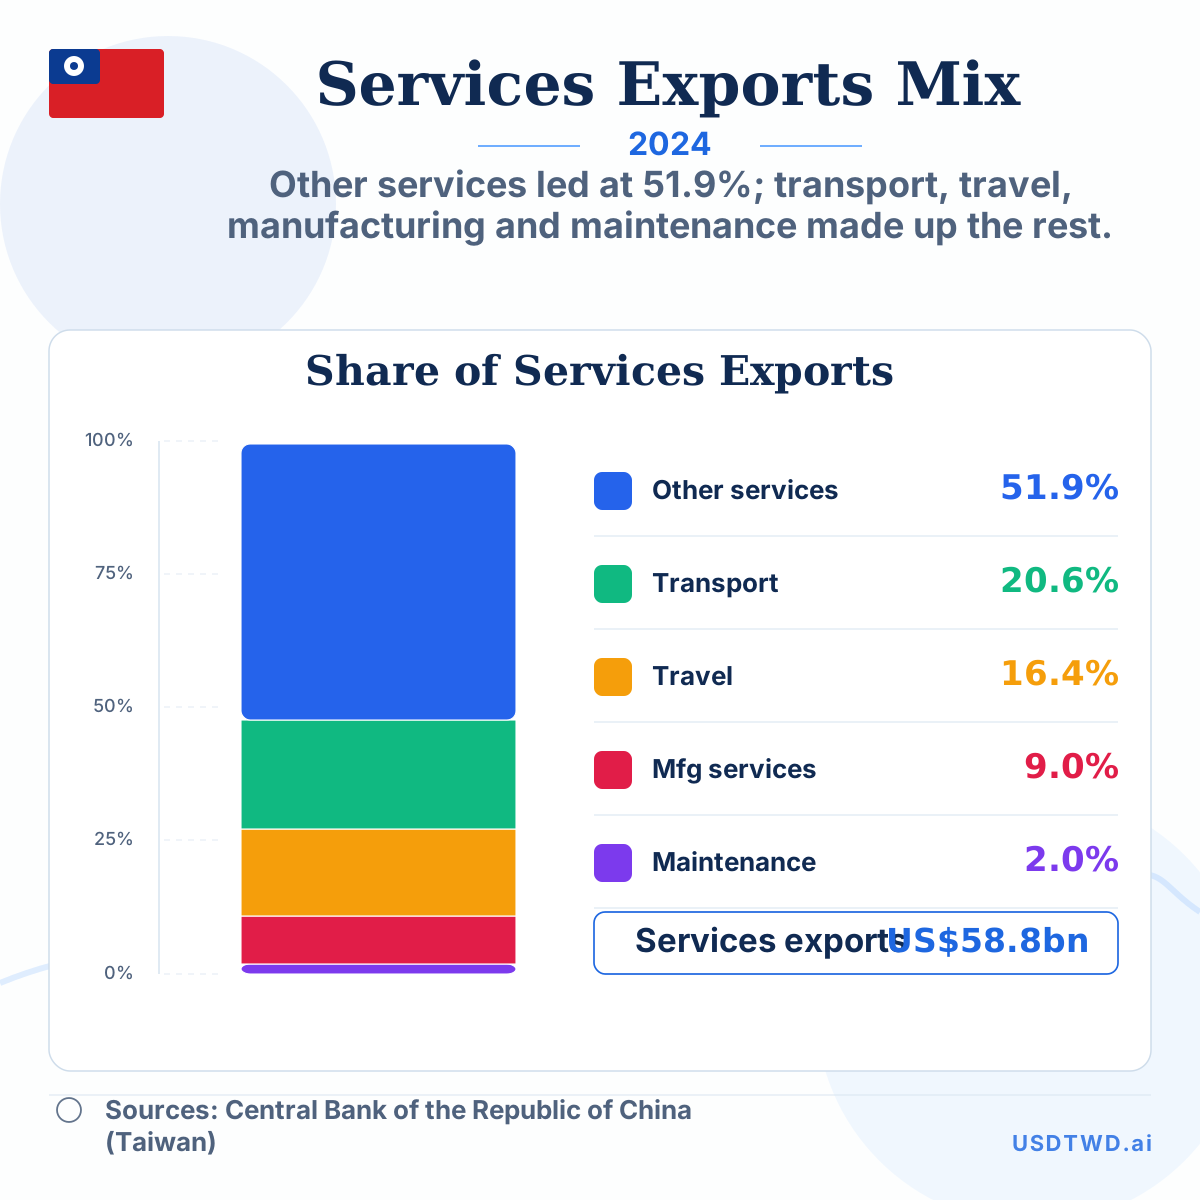
Other services led at 51.9%; transport, travel, manufacturing and maintenance made up the rest.
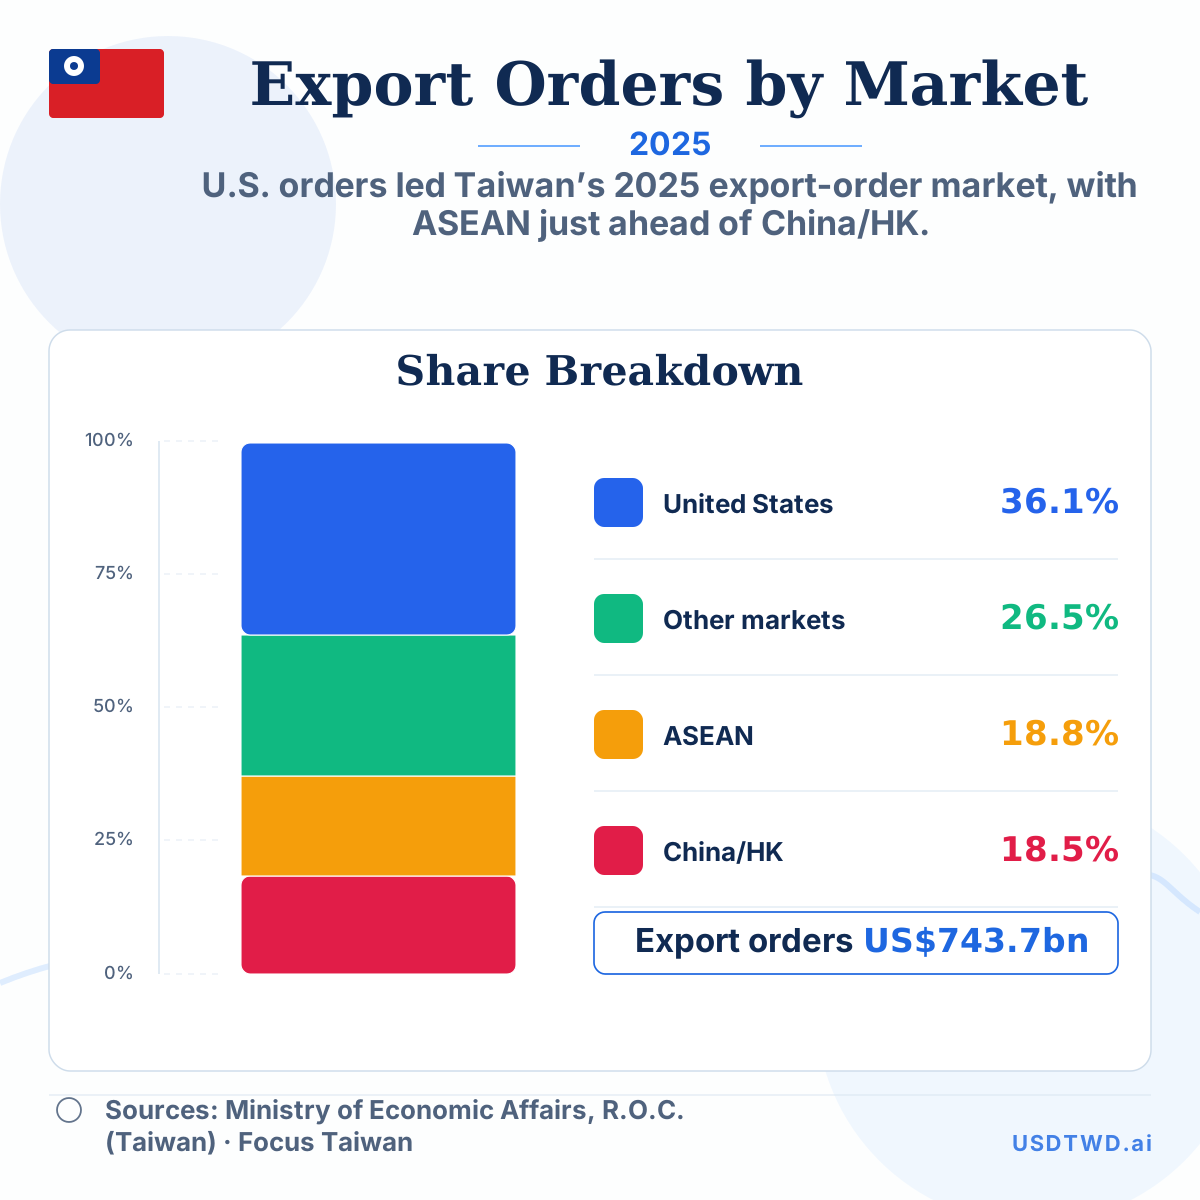
U.S. orders led Taiwan’s 2025 export-order market, with ASEAN just ahead of China/HK.
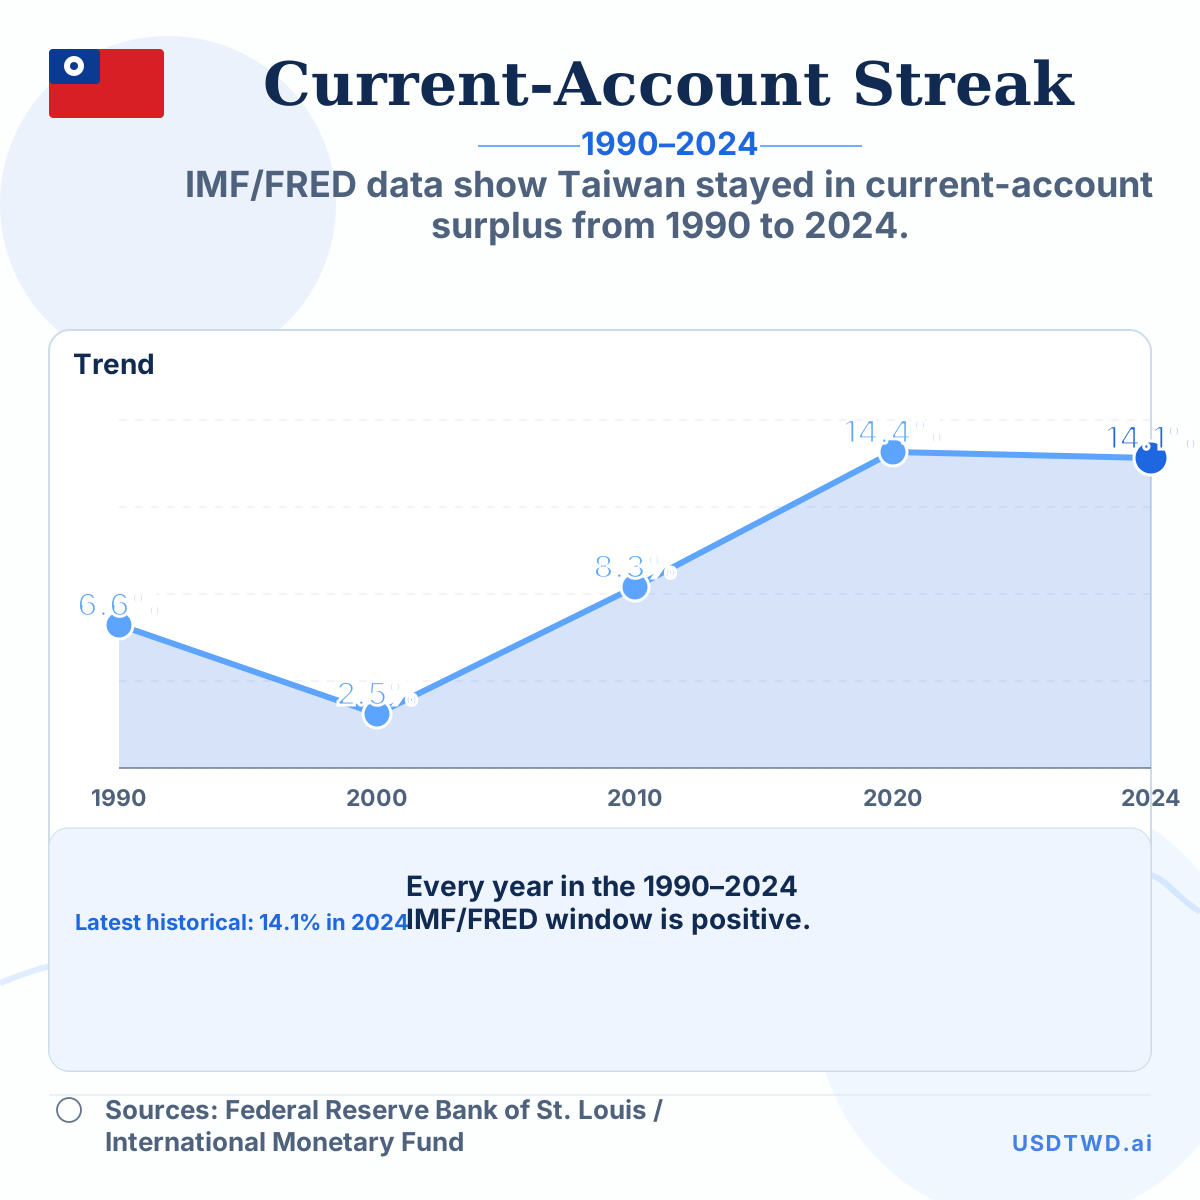
IMF/FRED data show Taiwan stayed in current-account surplus from 1990 to 2024.
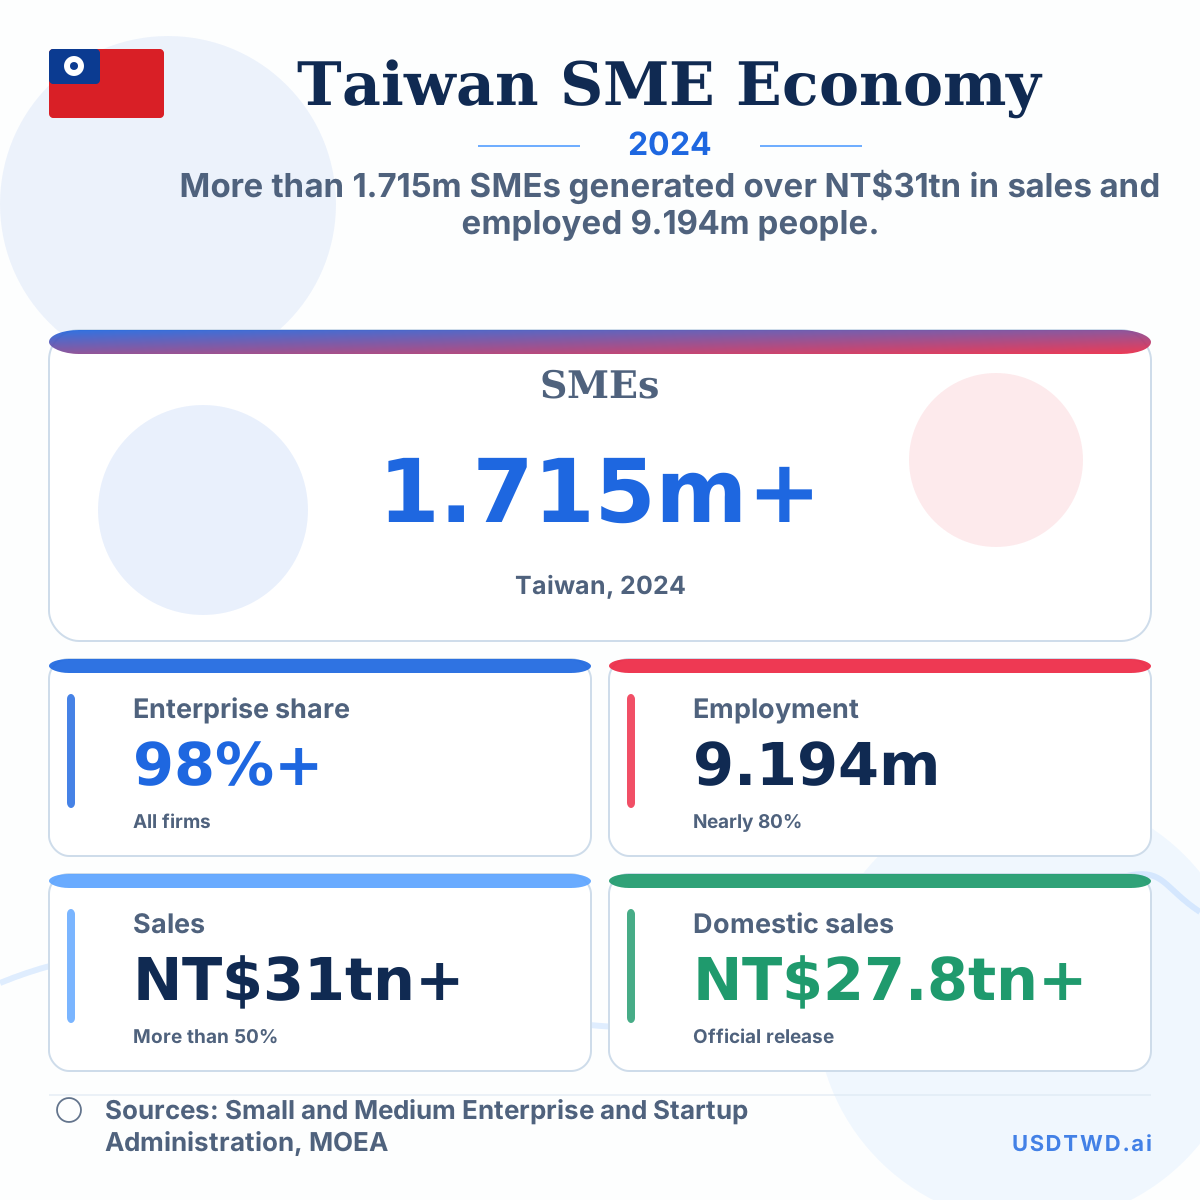
More than 1.715m SMEs generated over NT$31tn in sales and employed 9.194m people.
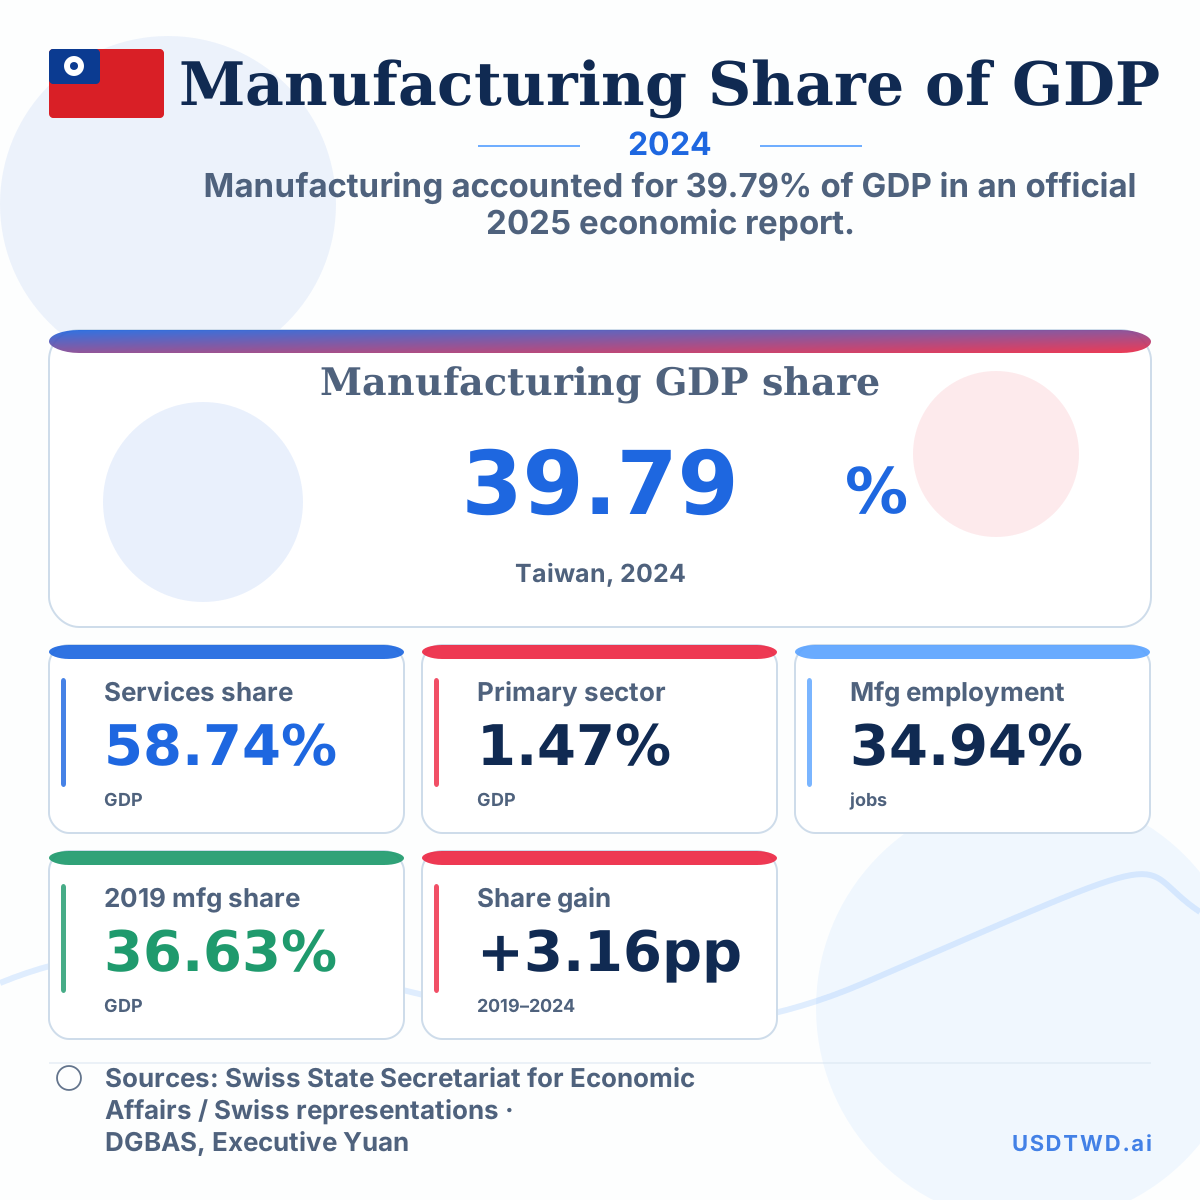
Manufacturing accounted for 39.79% of GDP in an official 2025 economic report.