Start with these Economy graphics
Newest source-labelled pages in this topic, with source blocks and data tables attached.
Graphics archive
GDP, trade, productivity, income, industrial structure and national-accounts graphics that explain Taiwan’s macro engine.
Newest source-labelled pages in this topic, with source blocks and data tables attached.
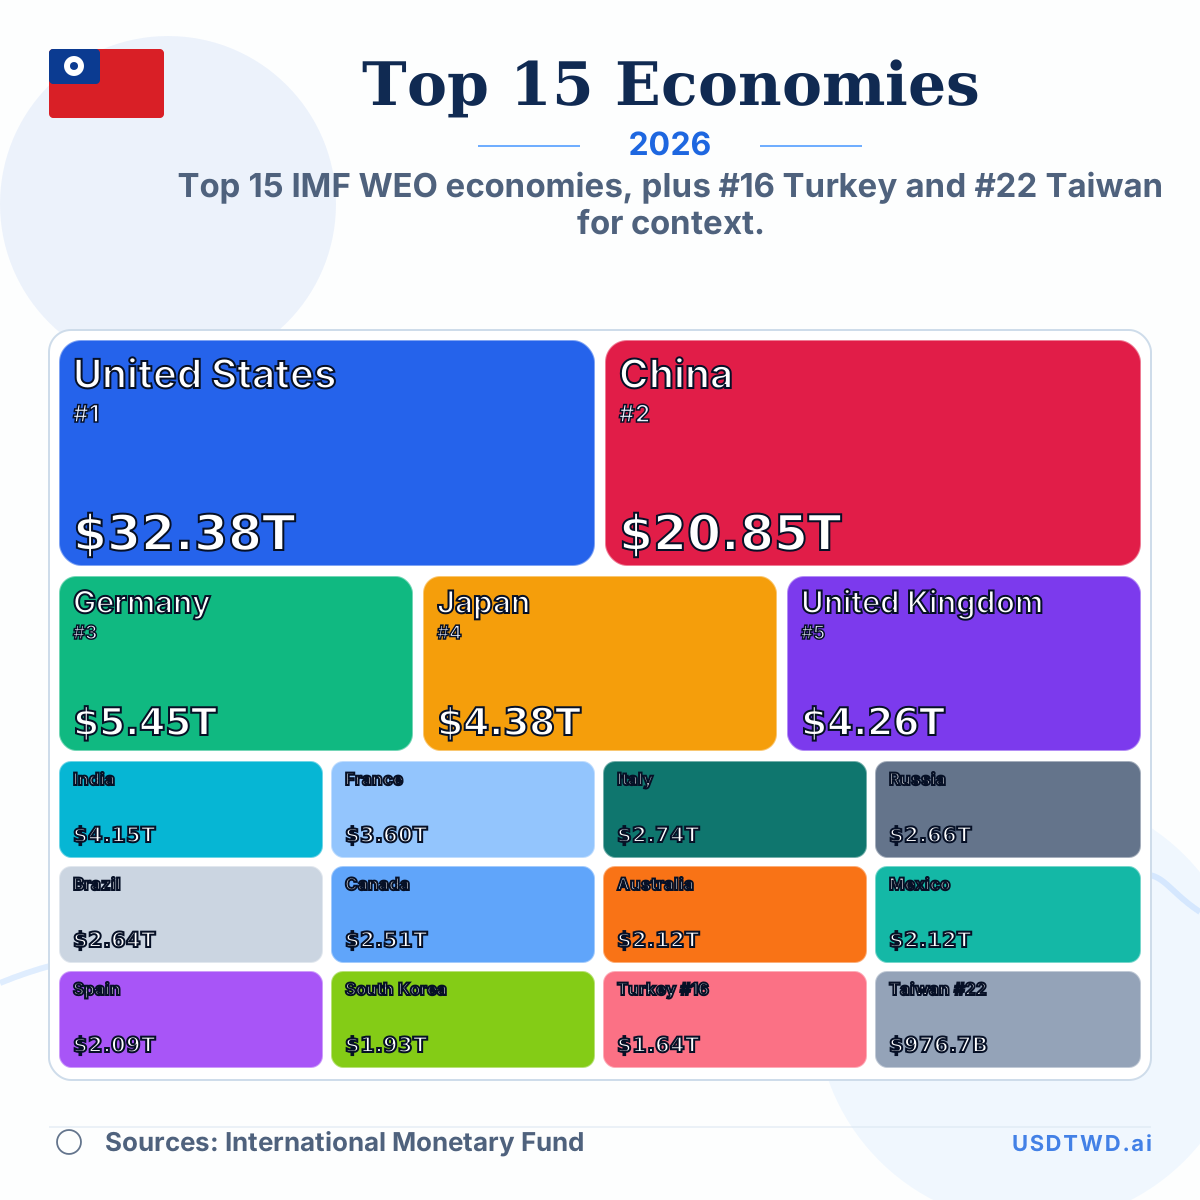
Top 15 IMF WEO economies, plus #16 Turkey and #22 Taiwan for context.
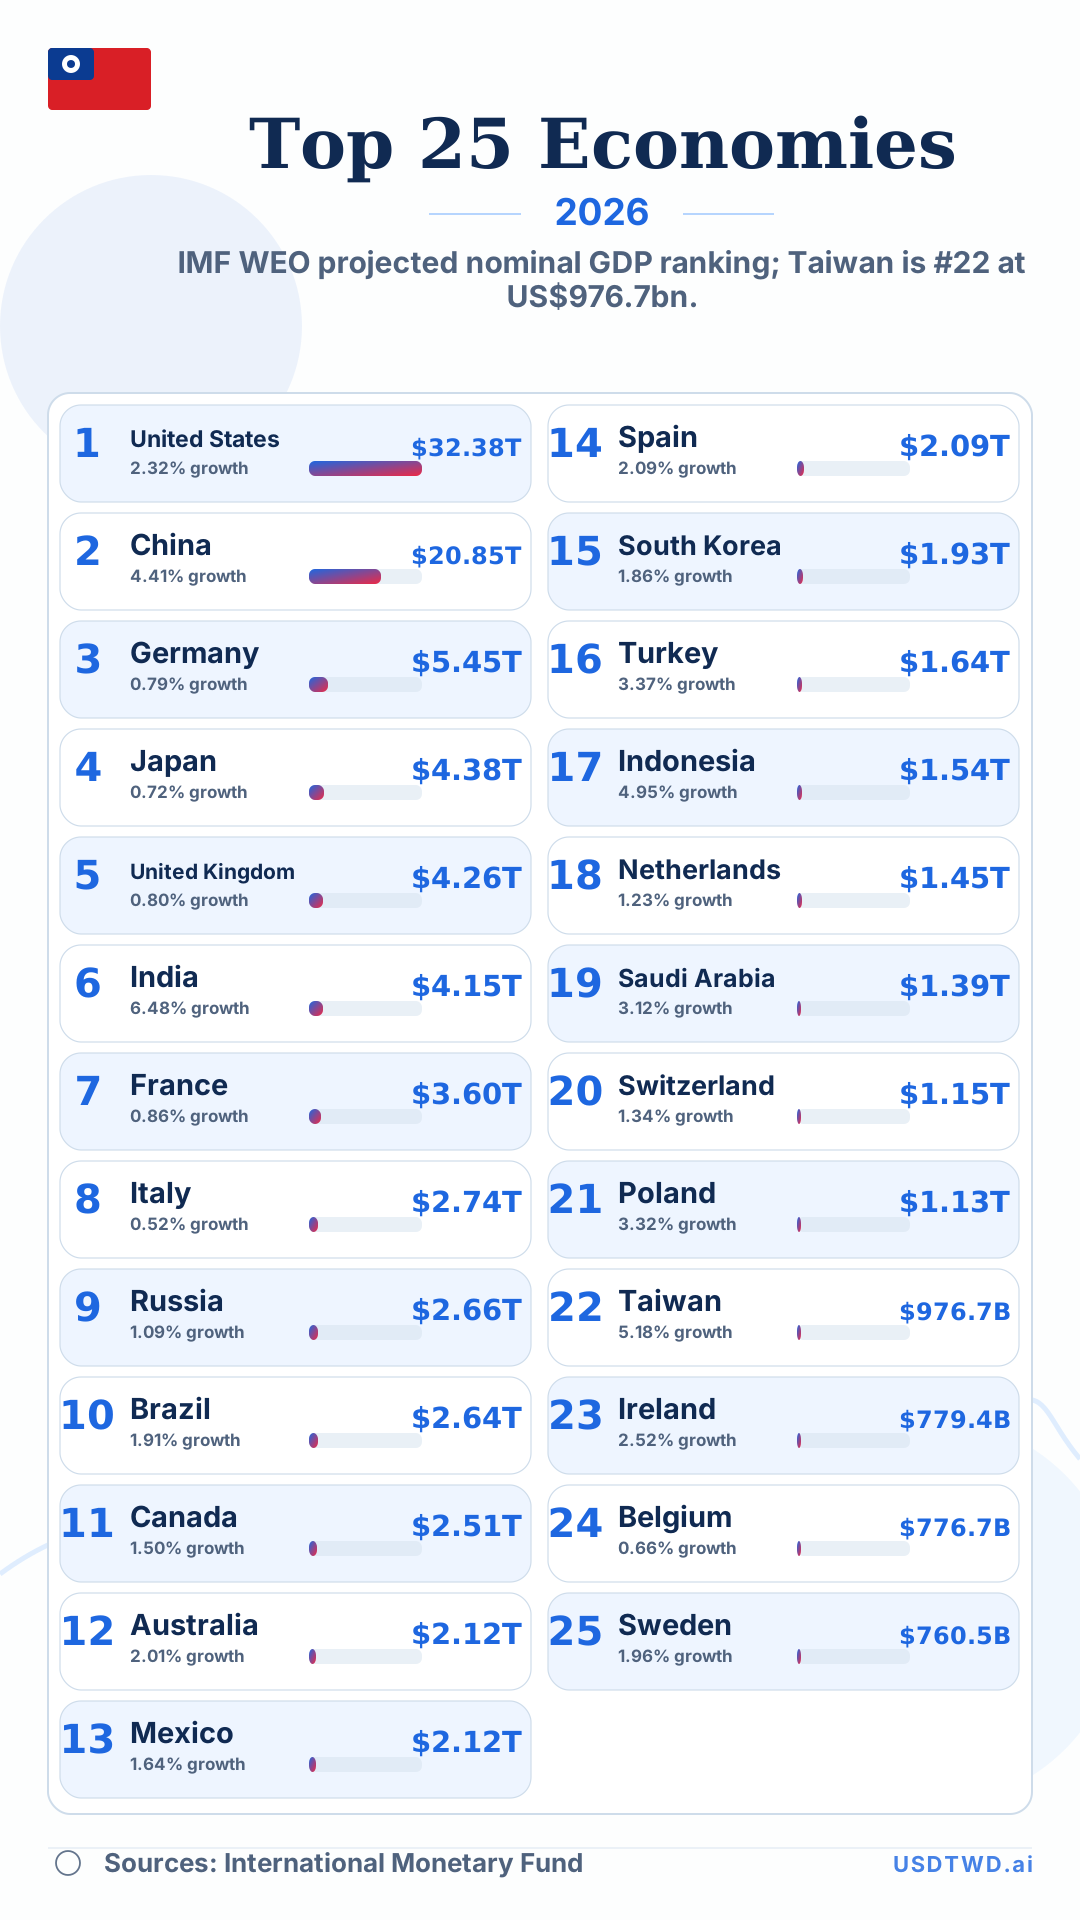
IMF WEO projected nominal GDP ranking; Taiwan is #22 at US$976.7bn.
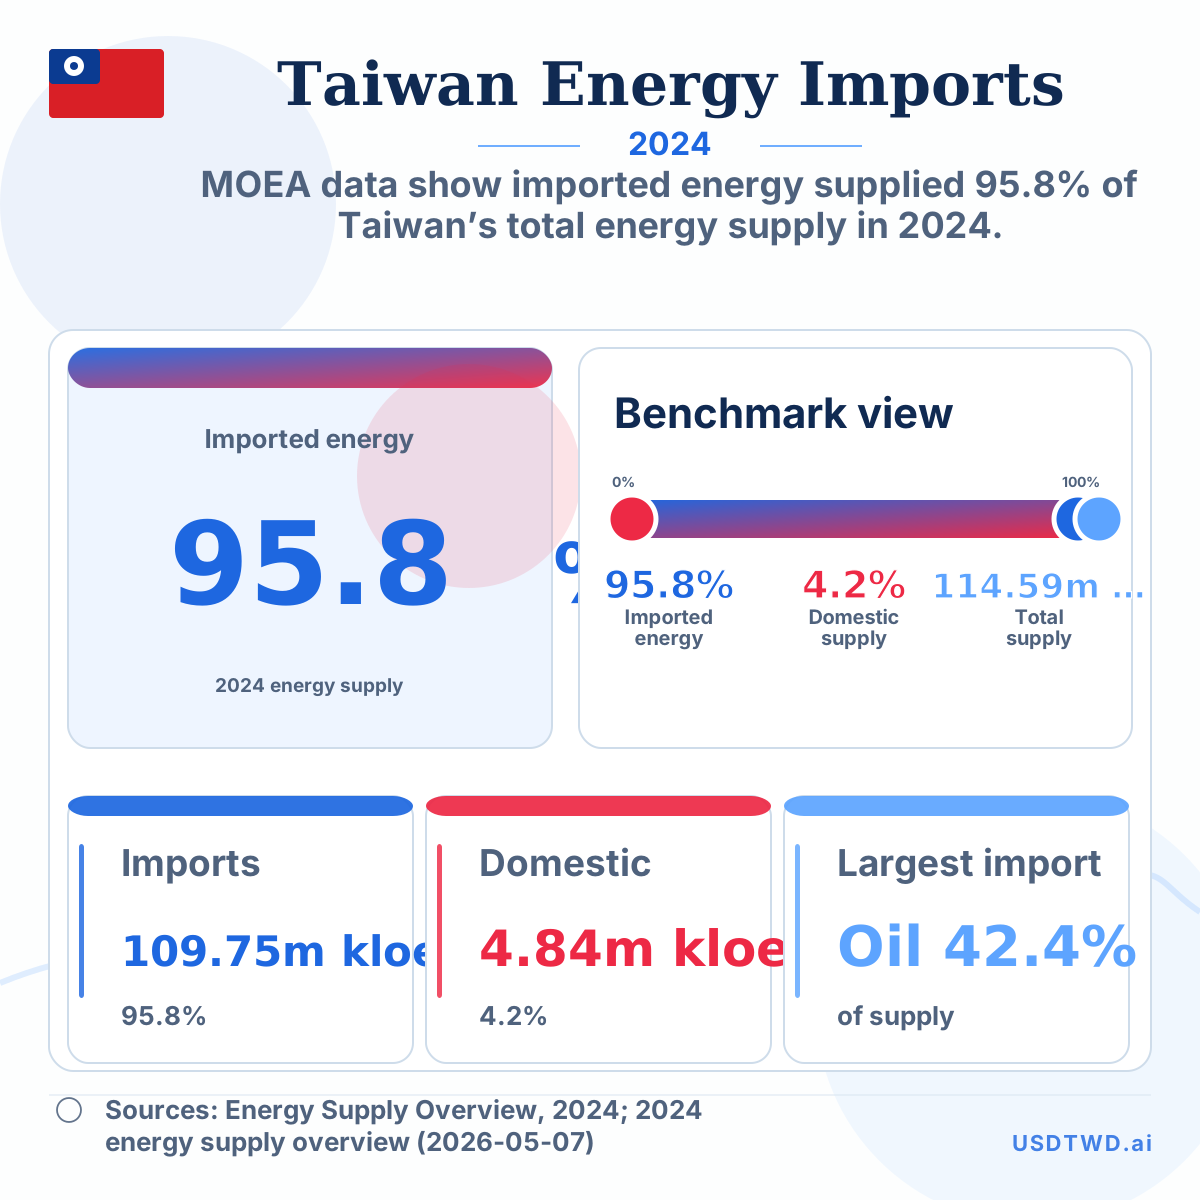
MOEA data show imported energy supplied 95.8% of Taiwan’s total energy supply in 2024.
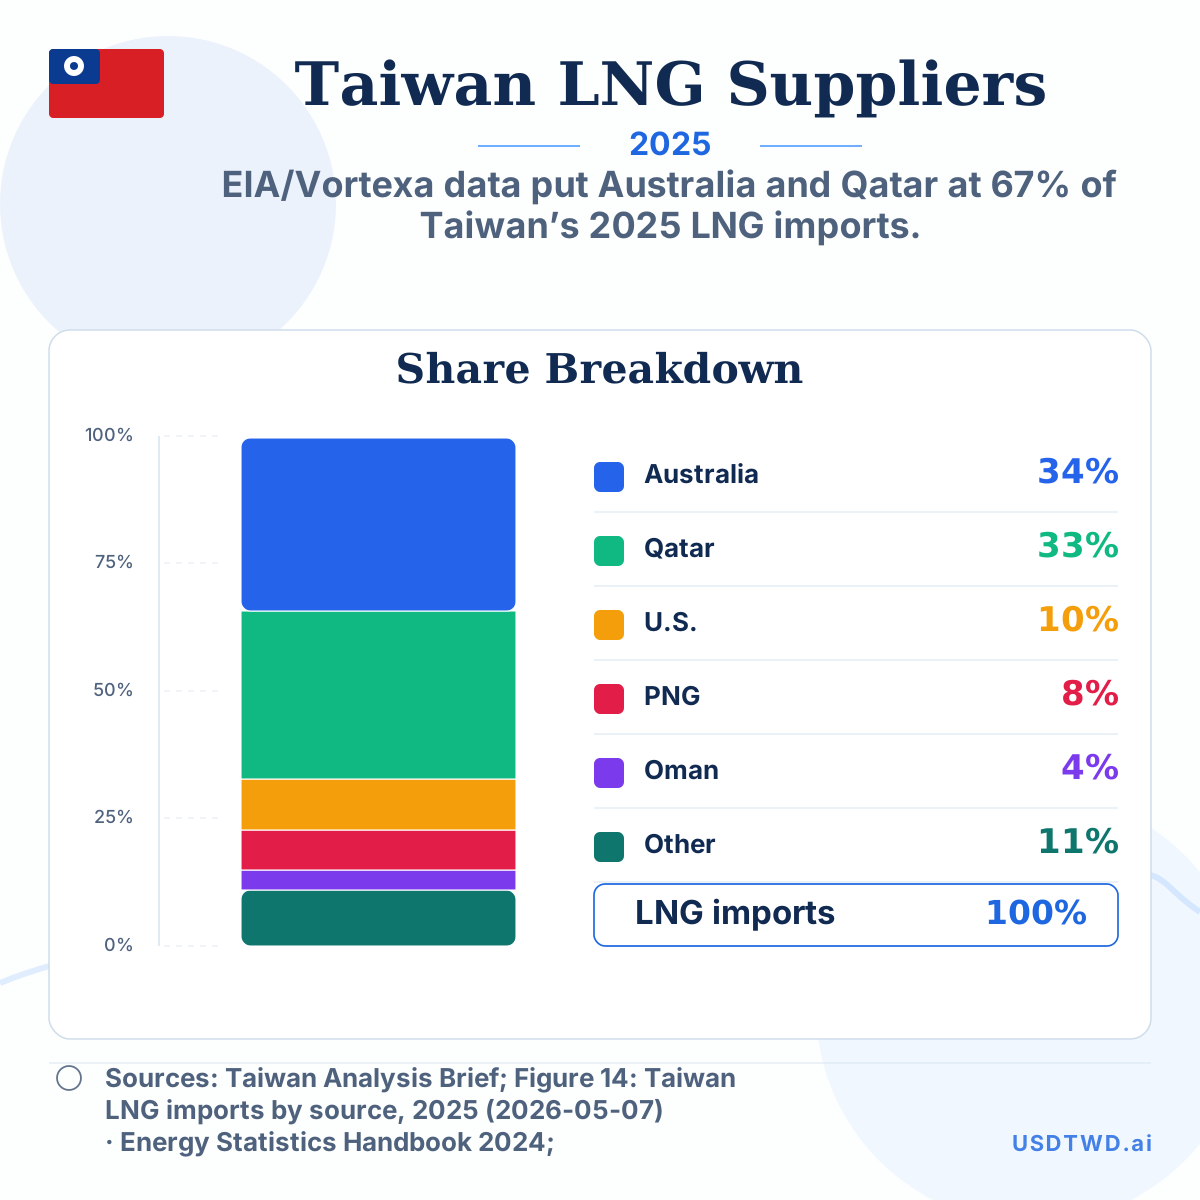
EIA/Vortexa data put Australia and Qatar at 67% of Taiwan’s 2025 LNG imports.
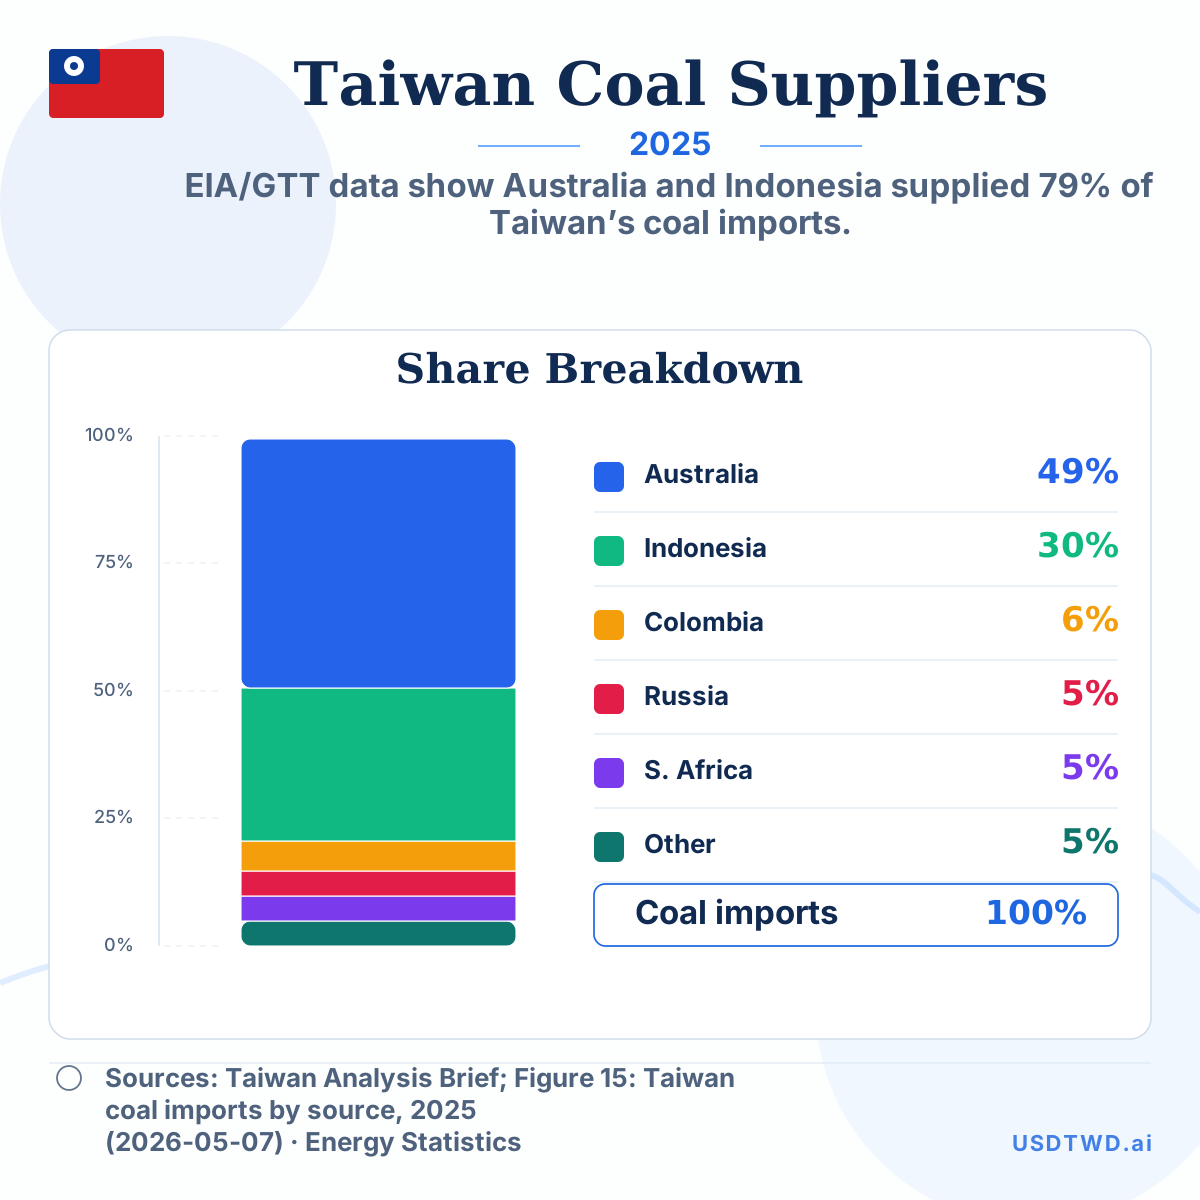
EIA/GTT data show Australia and Indonesia supplied 79% of Taiwan’s coal imports.
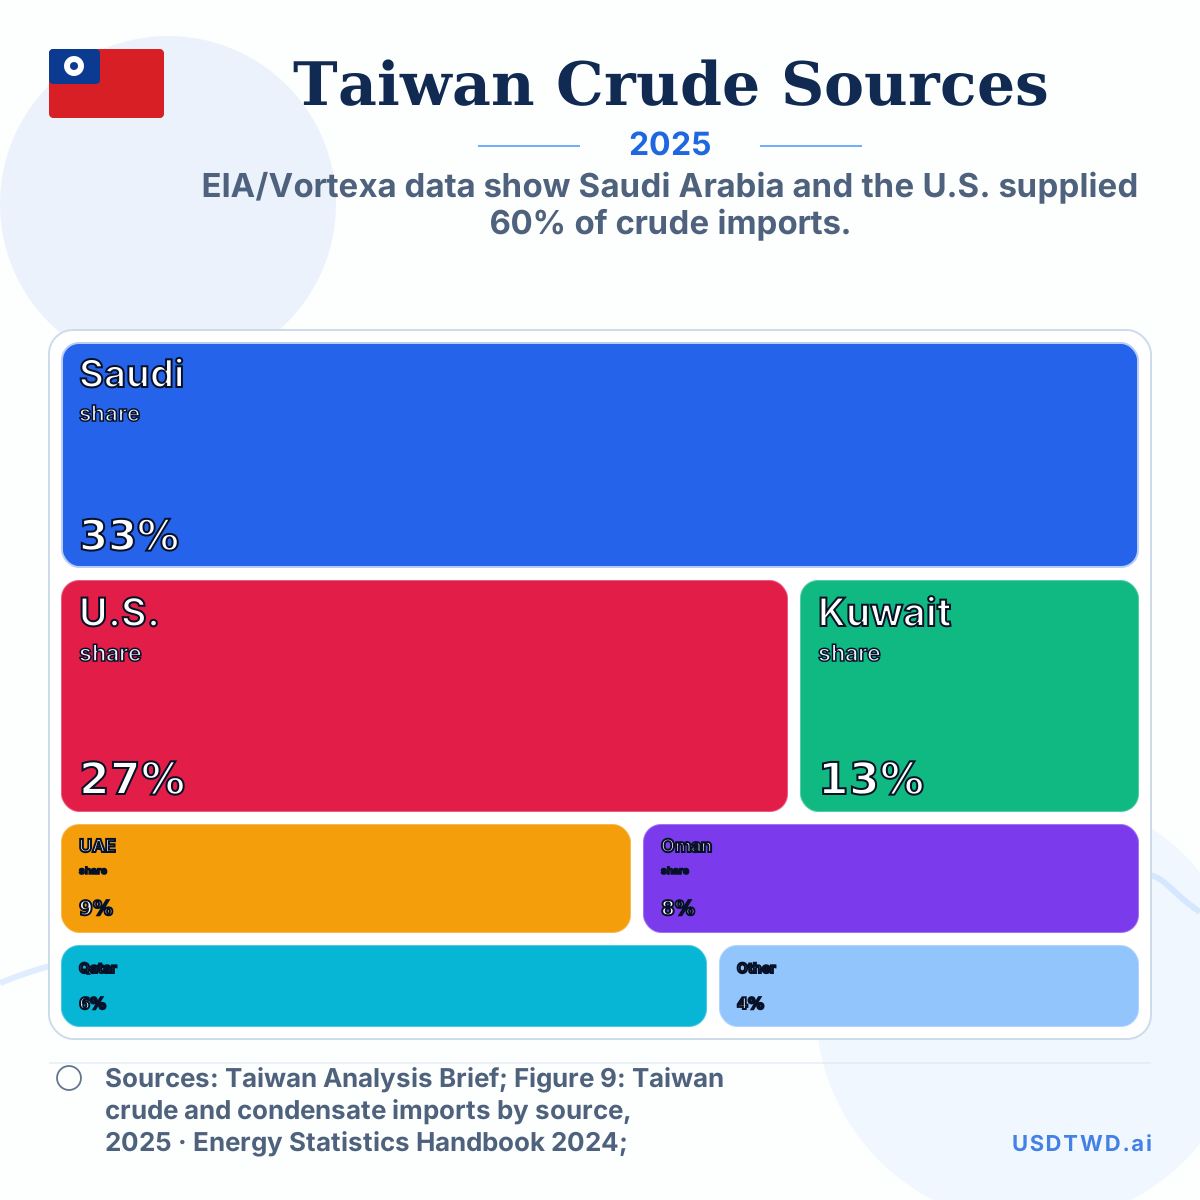
EIA/Vortexa data show Saudi Arabia and the U.S. supplied 60% of crude imports.
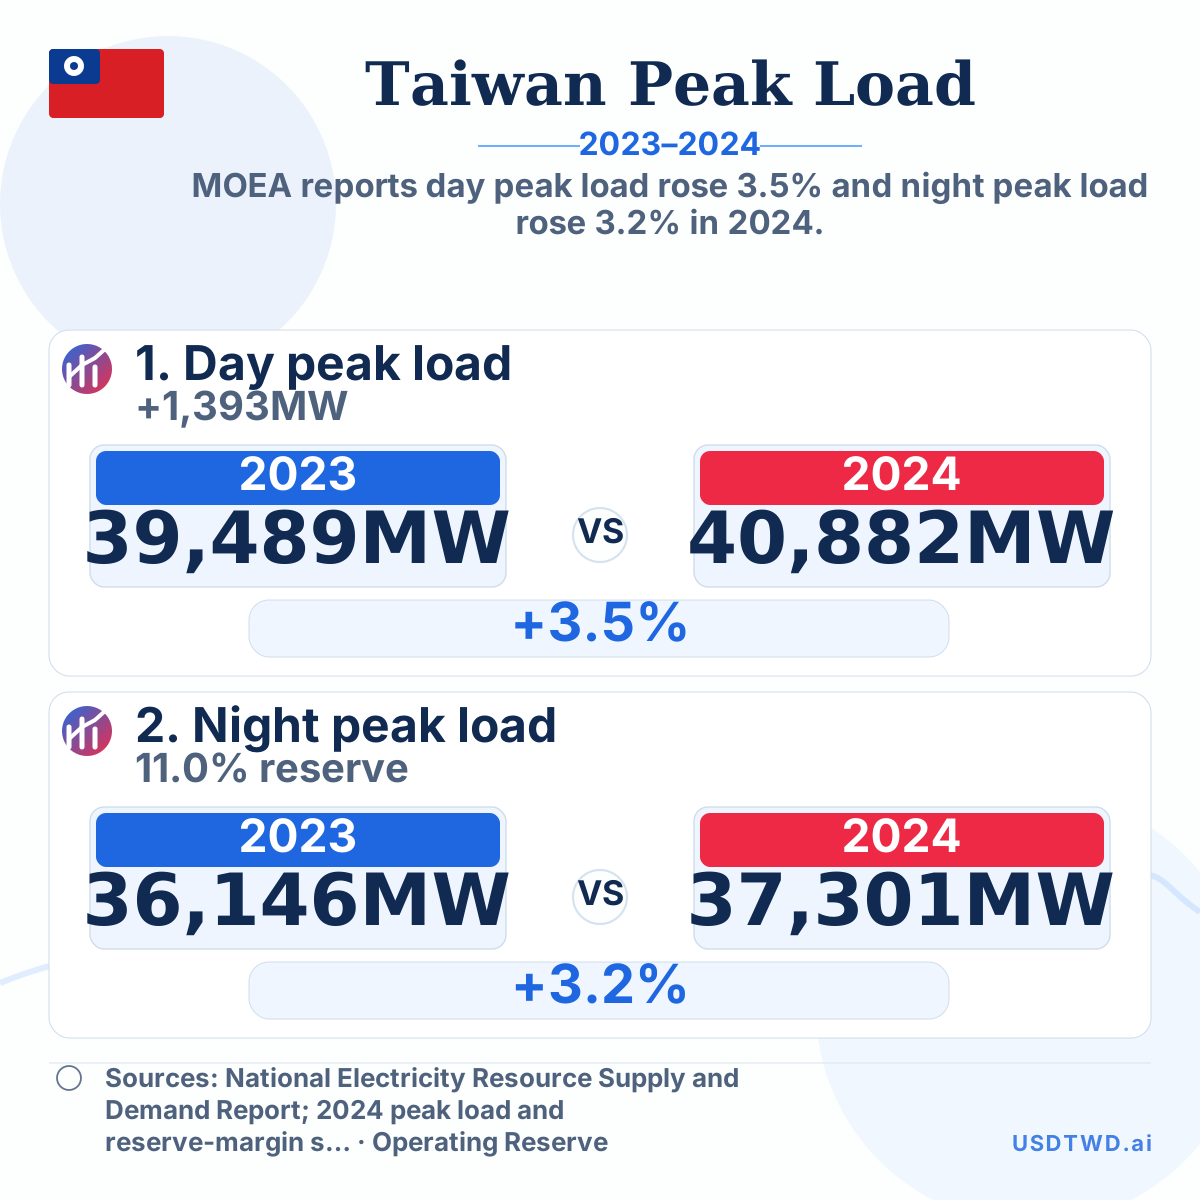
MOEA reports day peak load rose 3.5% and night peak load rose 3.2% in 2024.
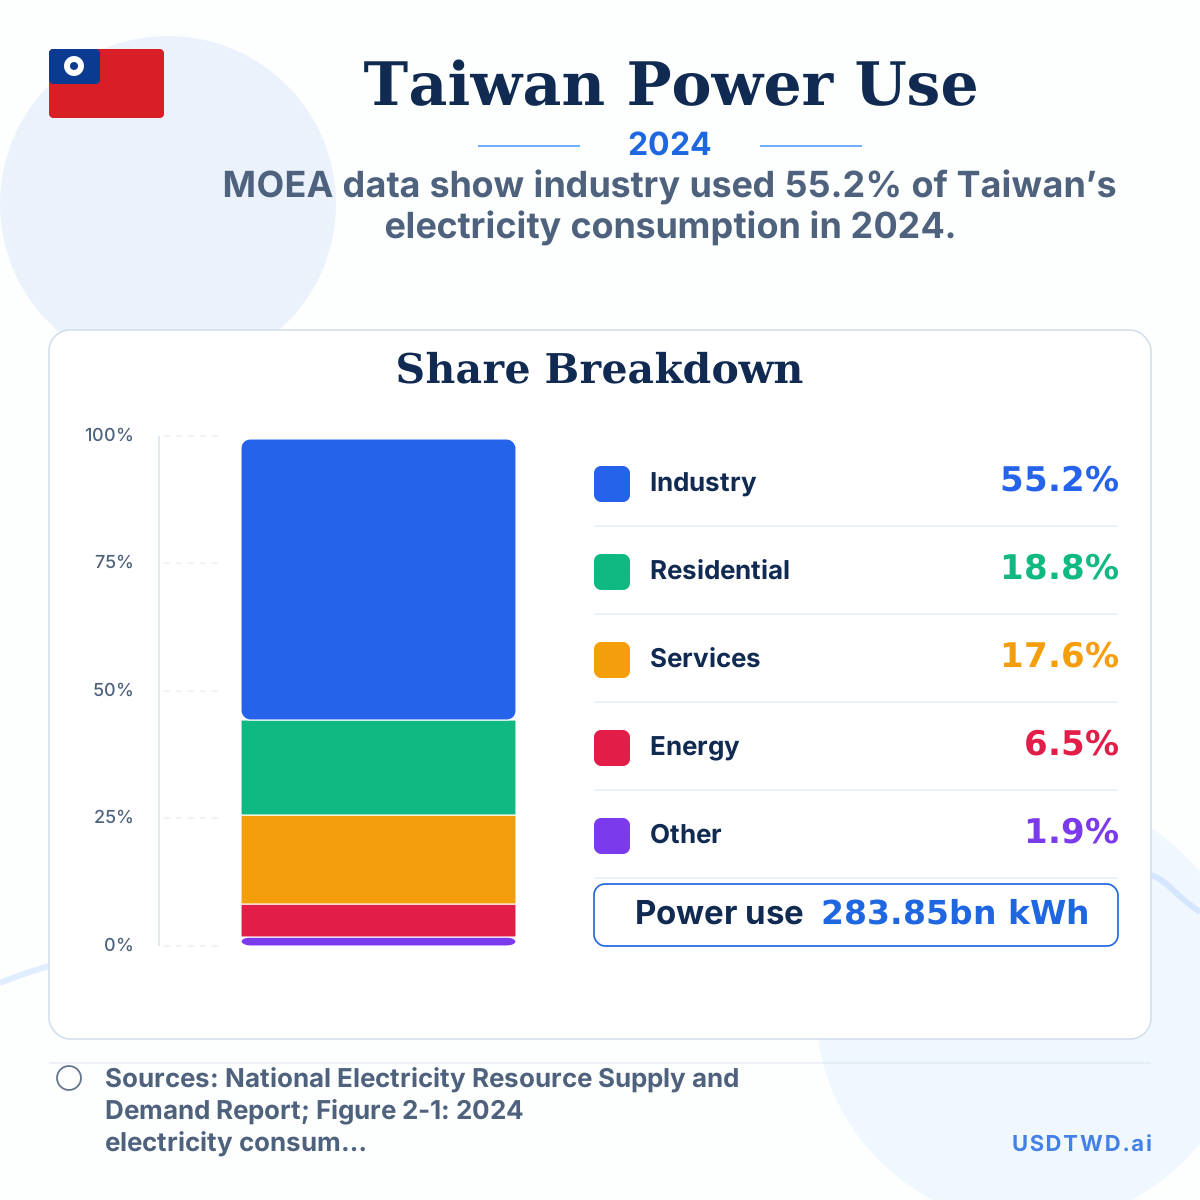
MOEA data show industry used 55.2% of Taiwan’s electricity consumption in 2024.
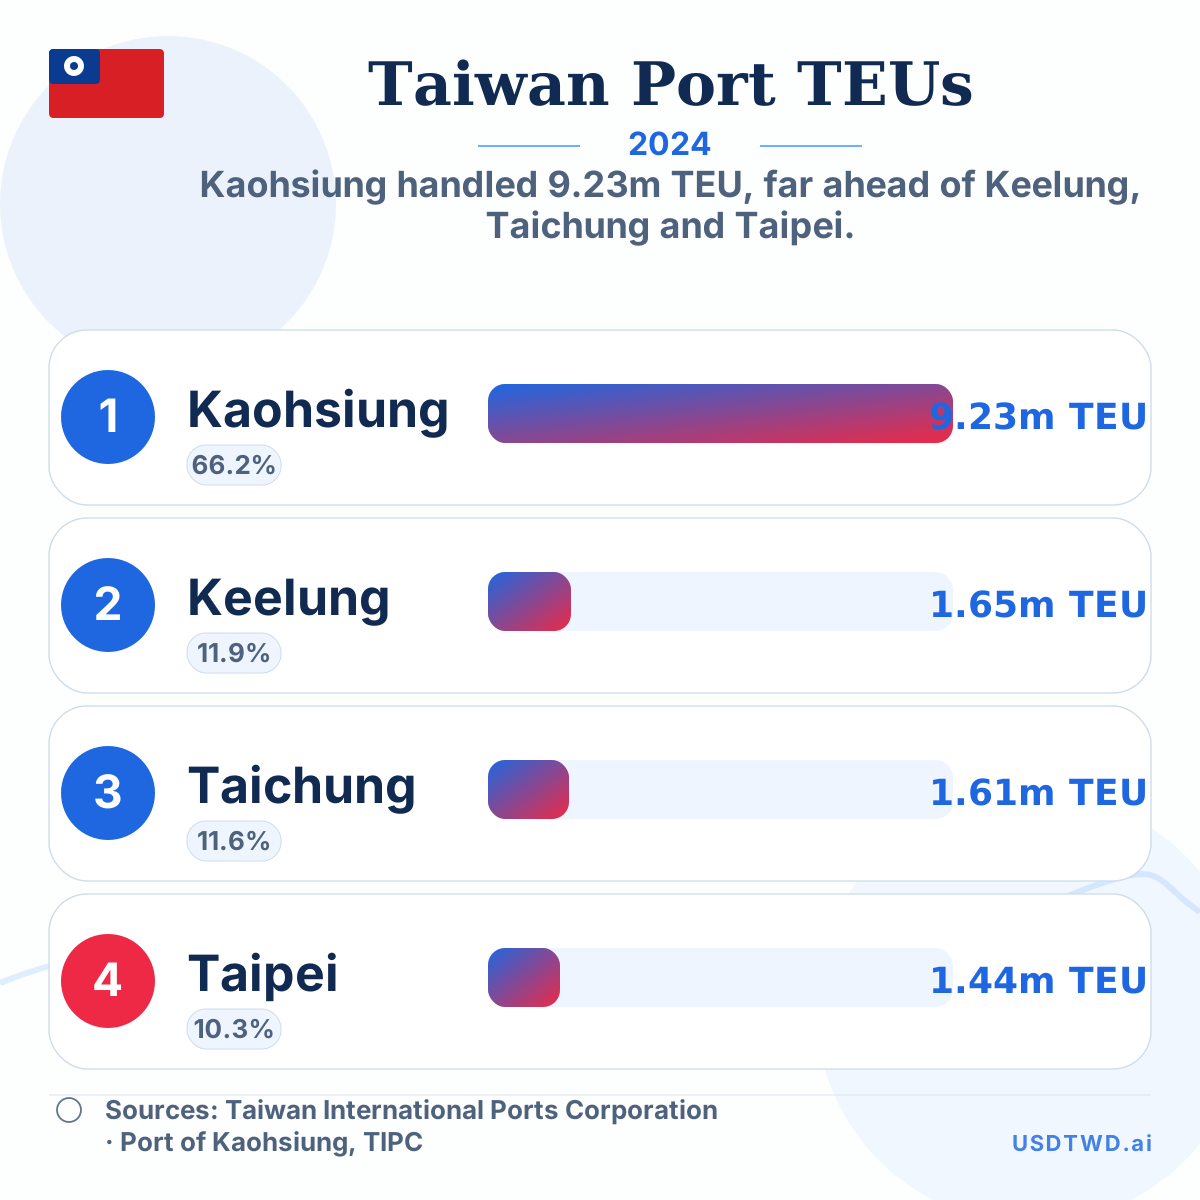
Kaohsiung handled 9.23m TEU, far ahead of Keelung, Taichung and Taipei.
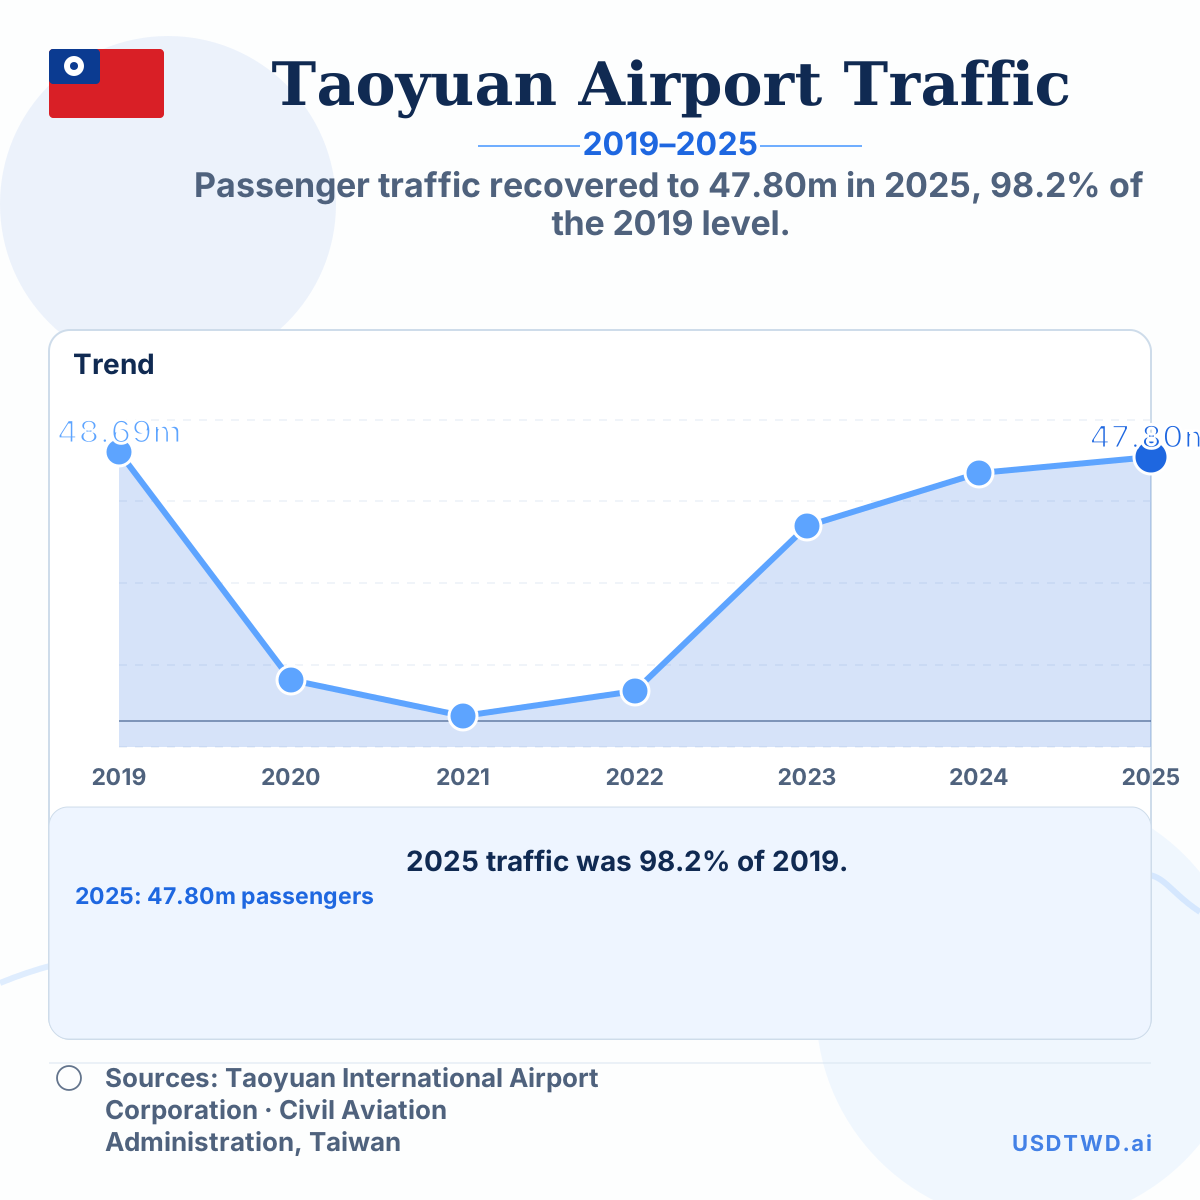
Passenger traffic recovered to 47.80m in 2025, 98.2% of the 2019 level.