
Economy
GDP, trade, productivity, wages, consumption, investment and the macro machinery behind Taiwan’s growth.
Start with these Economy graphics
Representative pages with source notes, methodology and reusable image variants.
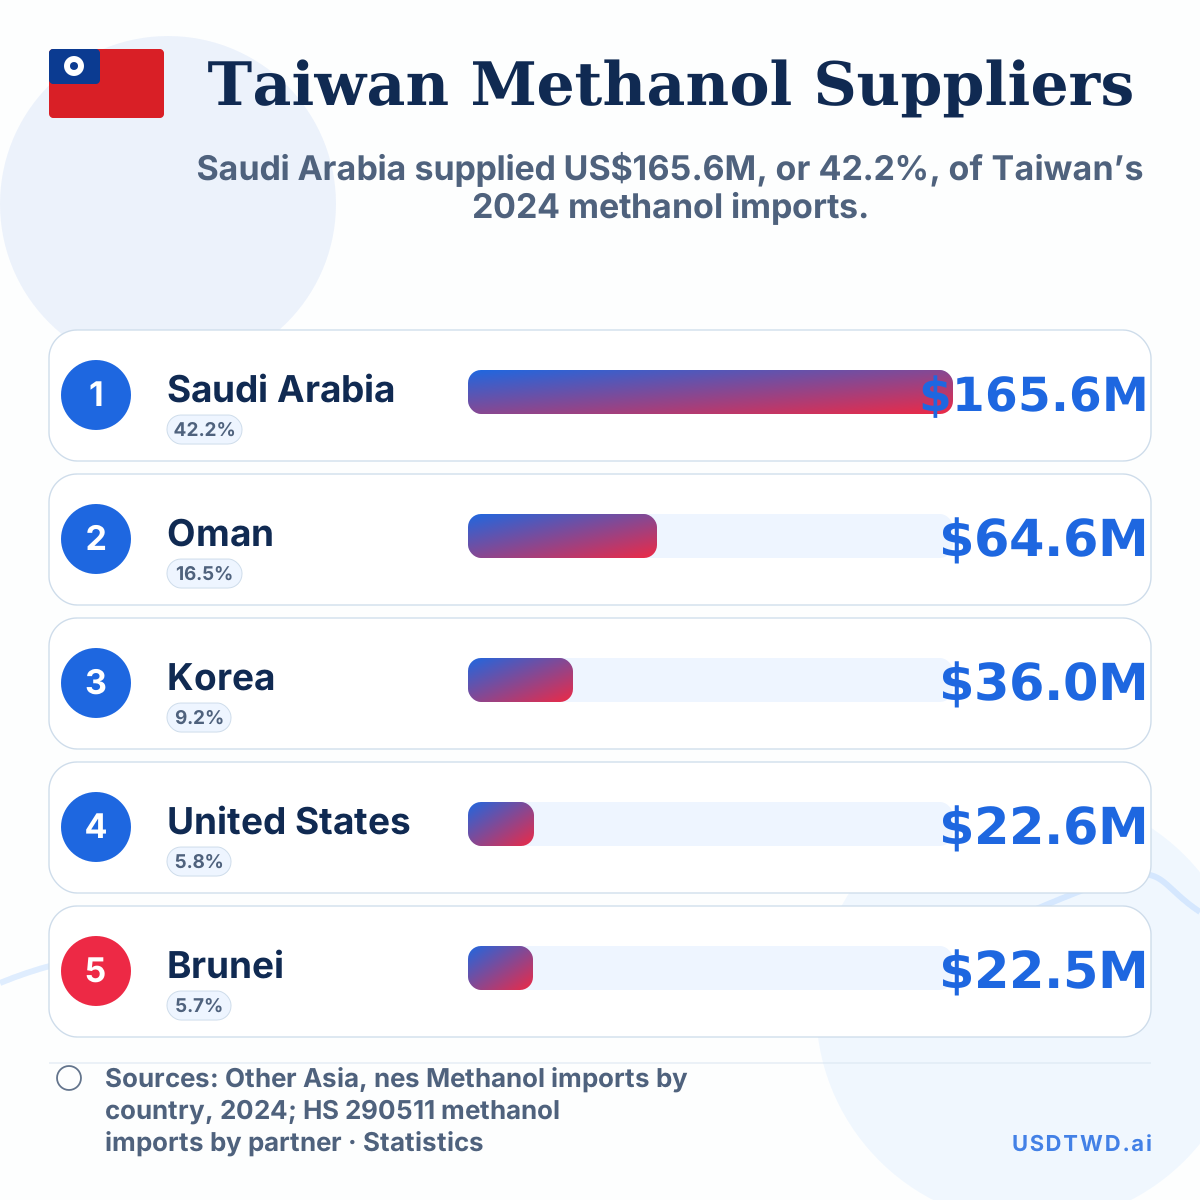 Taiwan’s 5 largest methanol suppliersSaudi Arabia supplied US$165.6M, or 42.2%, of Taiwan’s 2024 methanol…
Featured
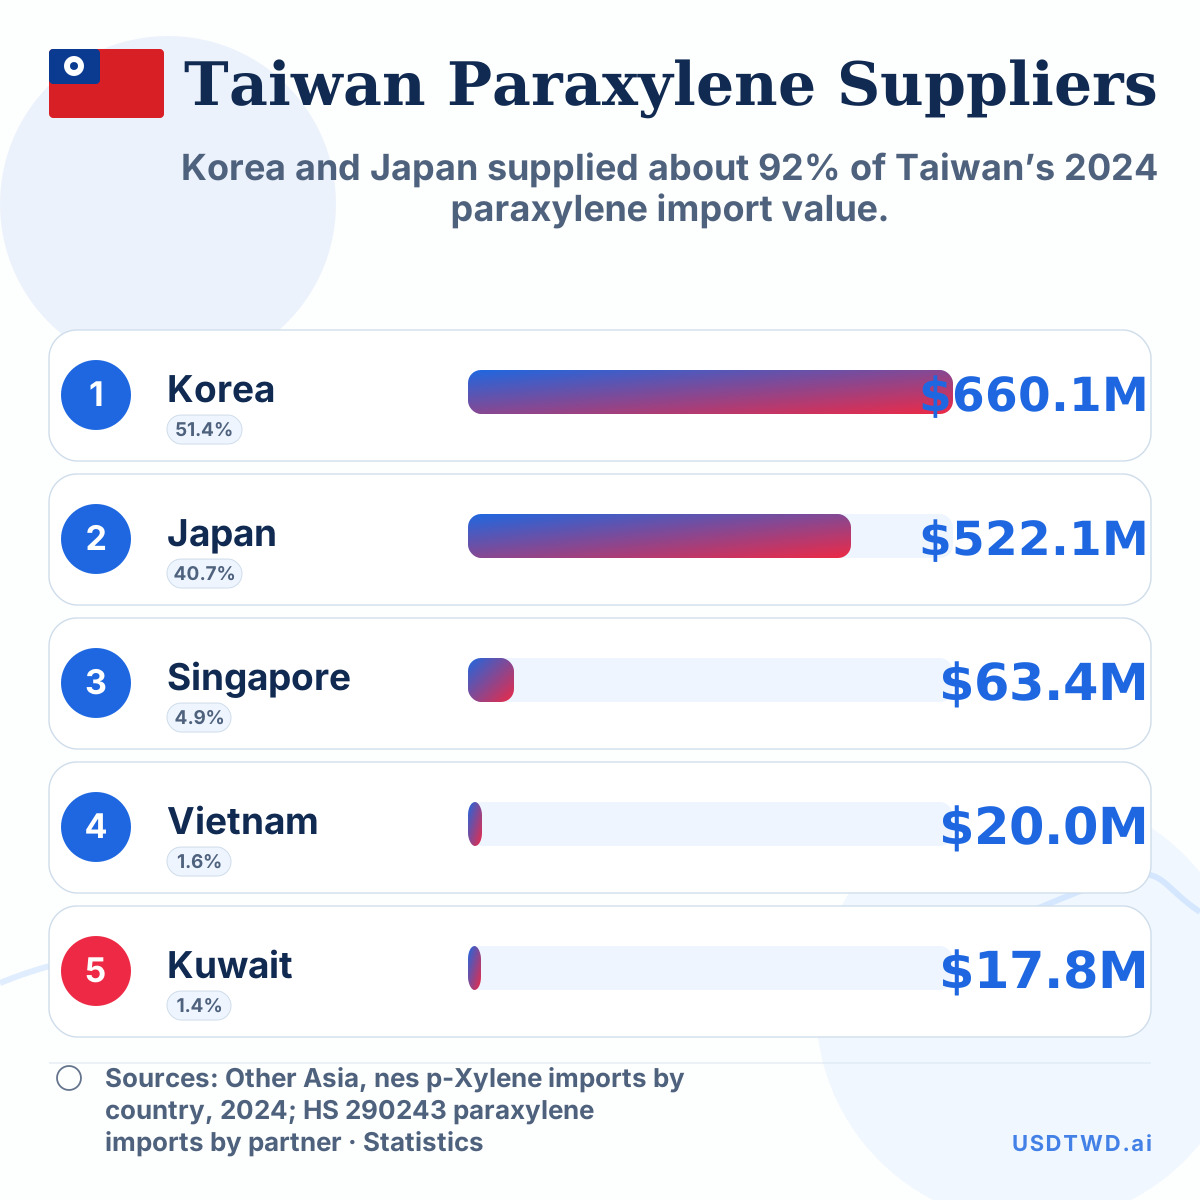 Taiwan’s 5 largest paraxylene suppliersKorea and Japan supplied about 92% of Taiwan’s 2024 paraxylene…
Featured
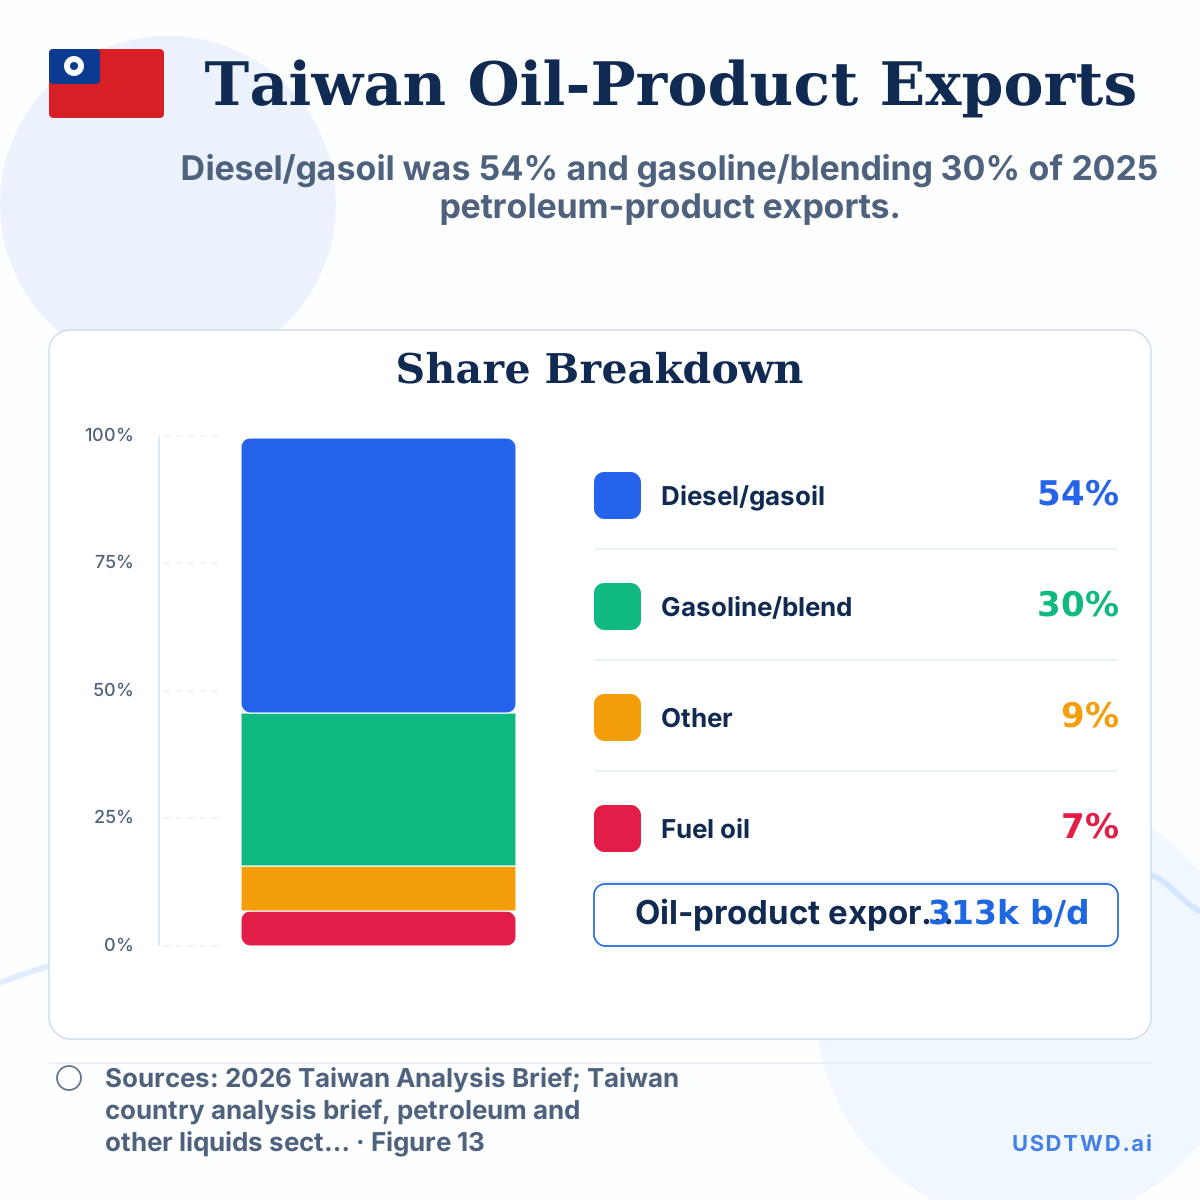 Taiwan petroleum-product exports by typeDiesel/gasoil was 54% and gasoline/blending 30% of 2025 petroleum-product exports.
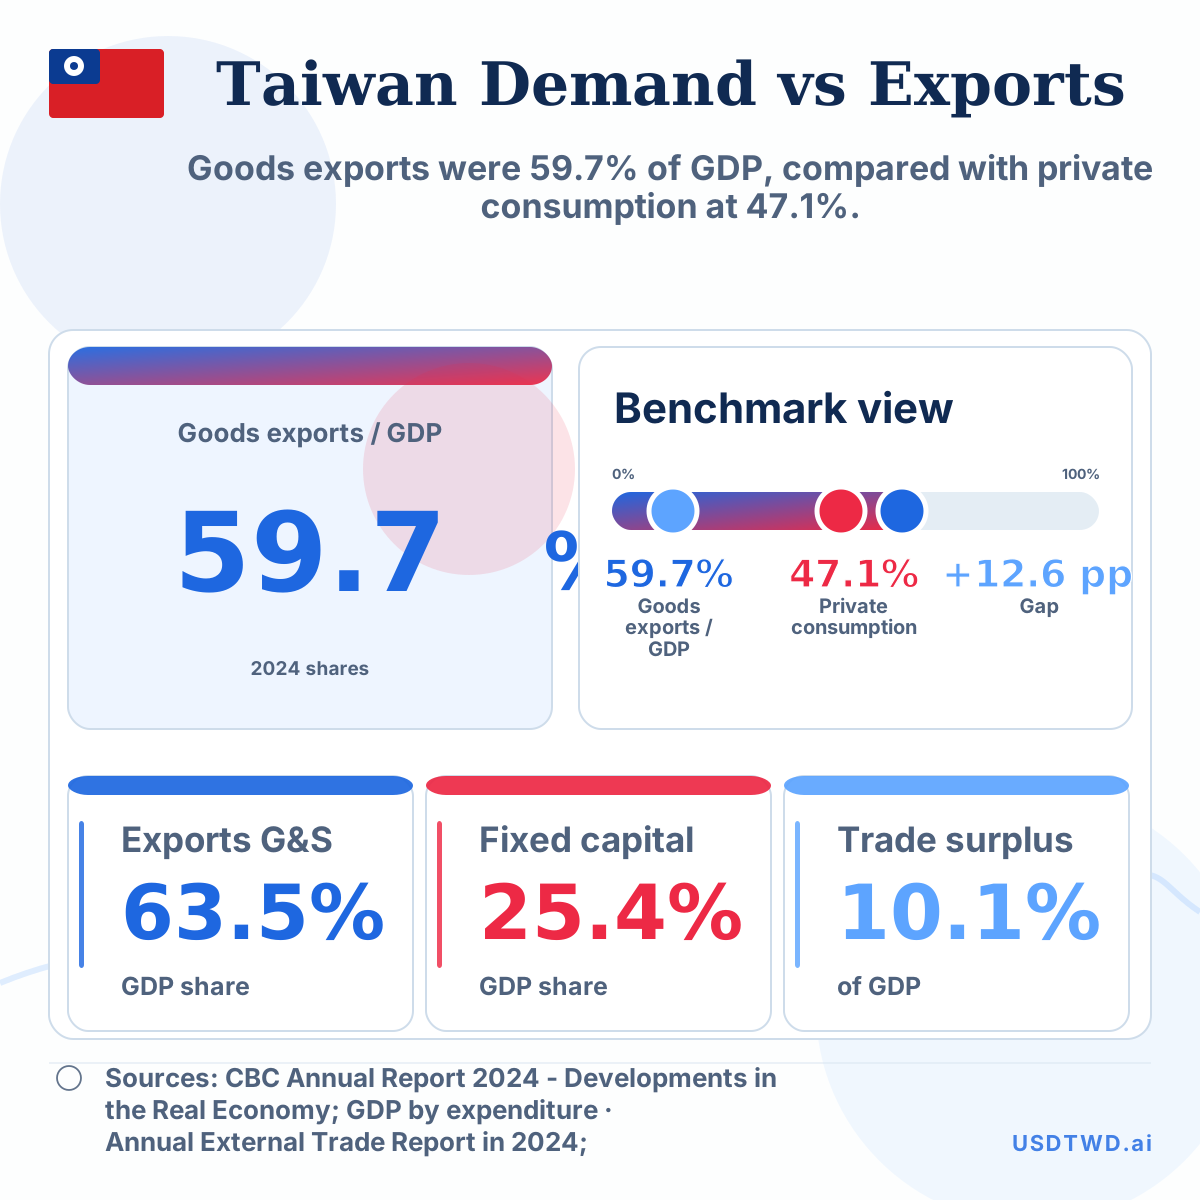
Taiwan Consumption vs Goods Exports, 2024
Goods exports were 59.7% of GDP, compared with private consumption at 47.1%.
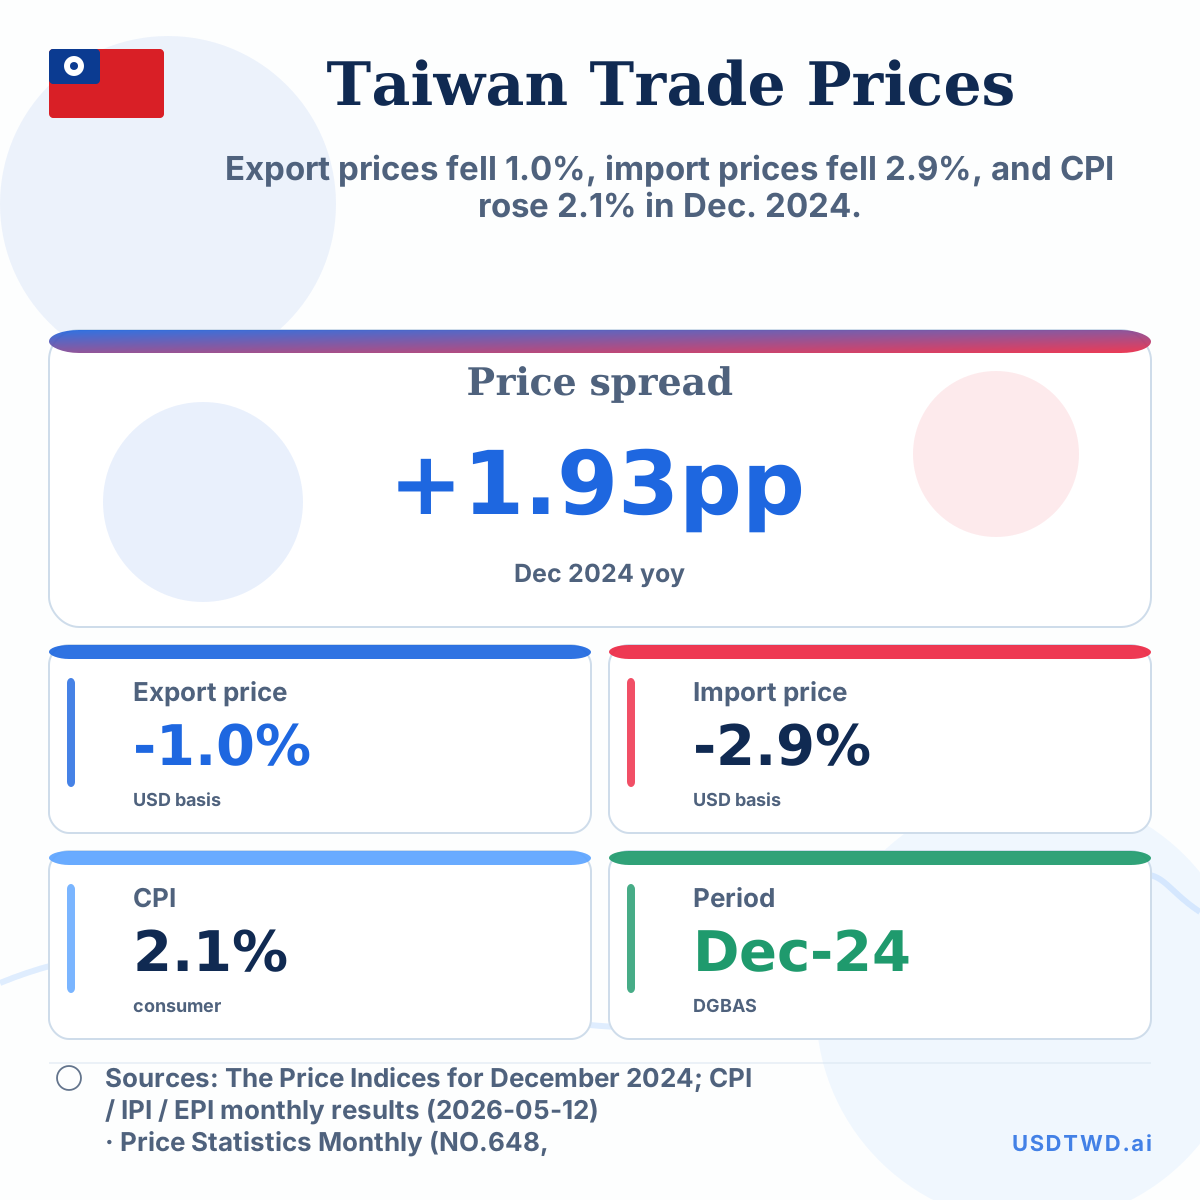
Taiwan Trade Prices and CPI, Dec 2024
Export prices fell 1.0%, import prices fell 2.9%, and CPI rose 2.1% in Dec. 2024.
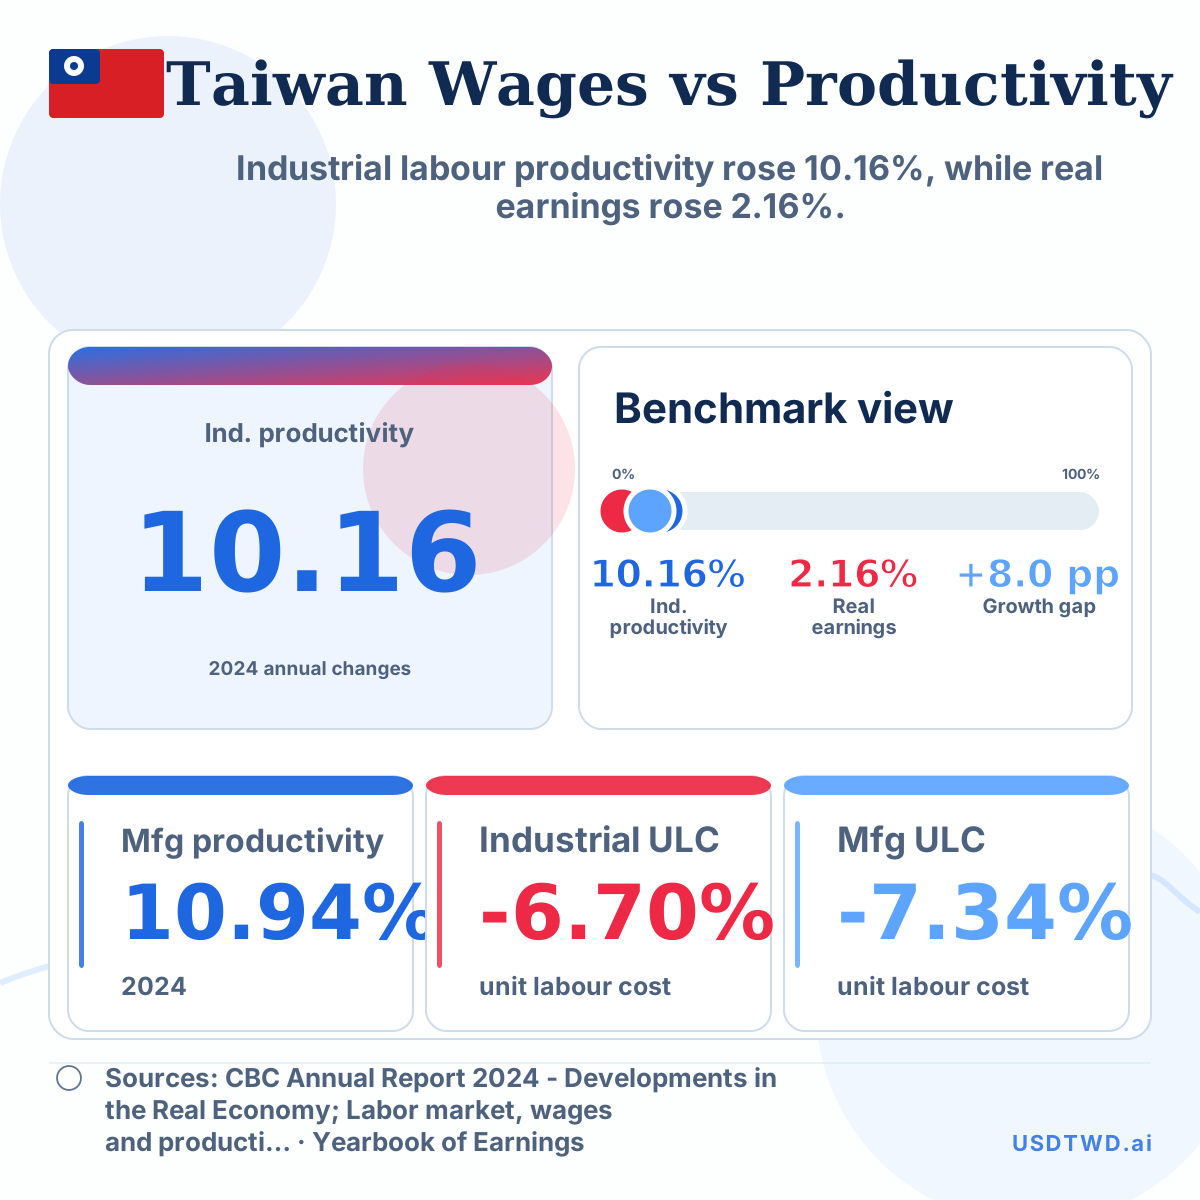
Taiwan Wages vs Productivity Growth, 2024
Industrial labour productivity rose 10.16%, while real earnings rose 2.16%.
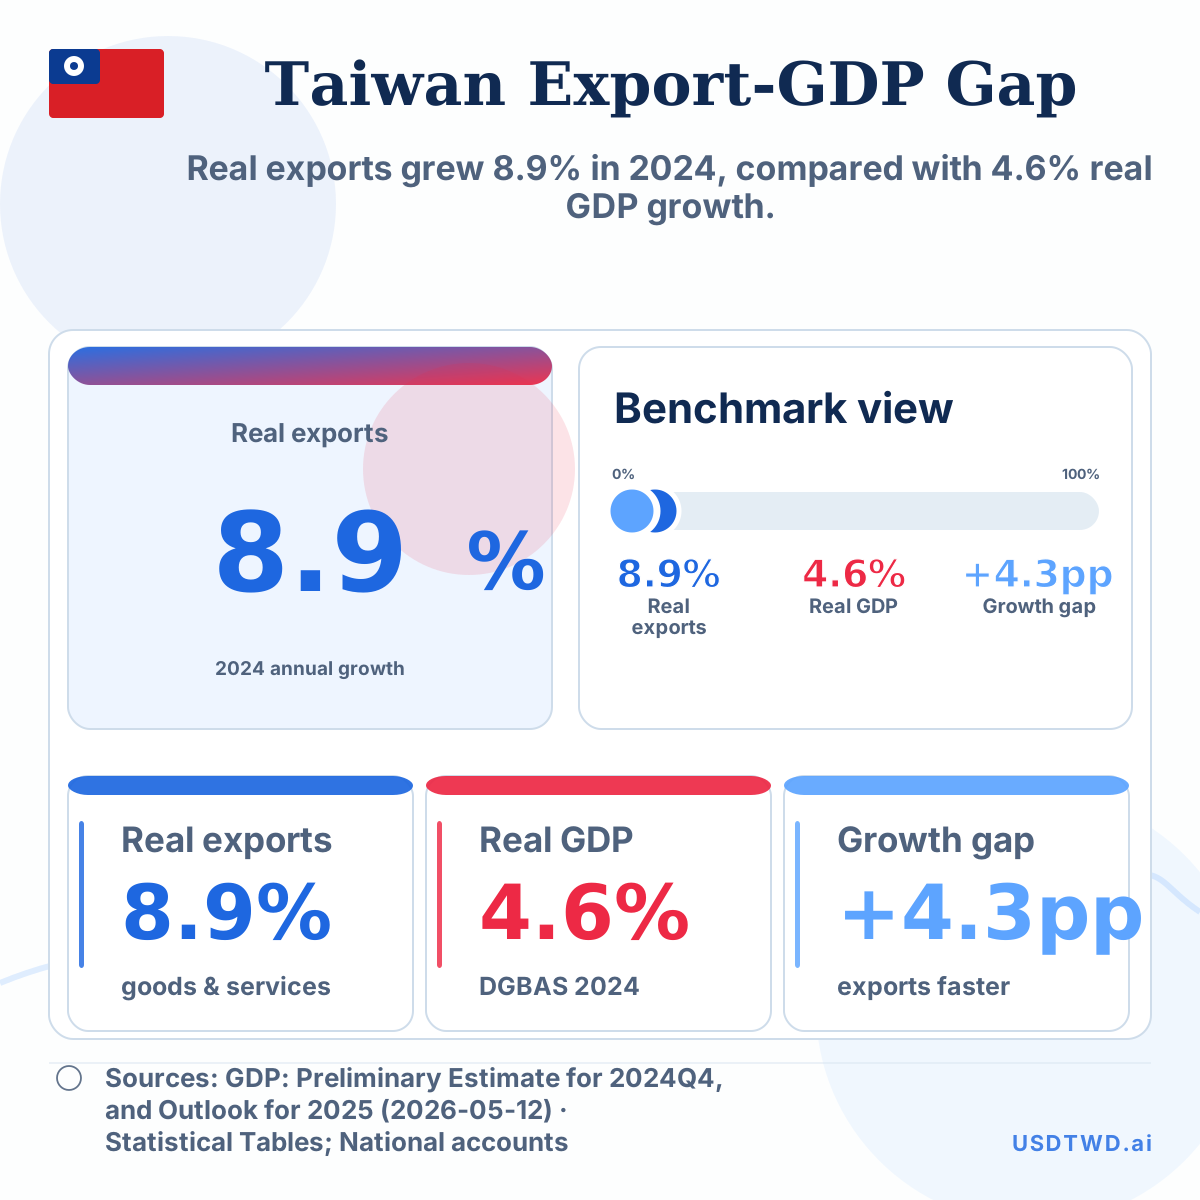
Taiwan Export Growth vs GDP Growth, 2024
Real exports grew 8.9% in 2024, compared with 4.6% real GDP growth.
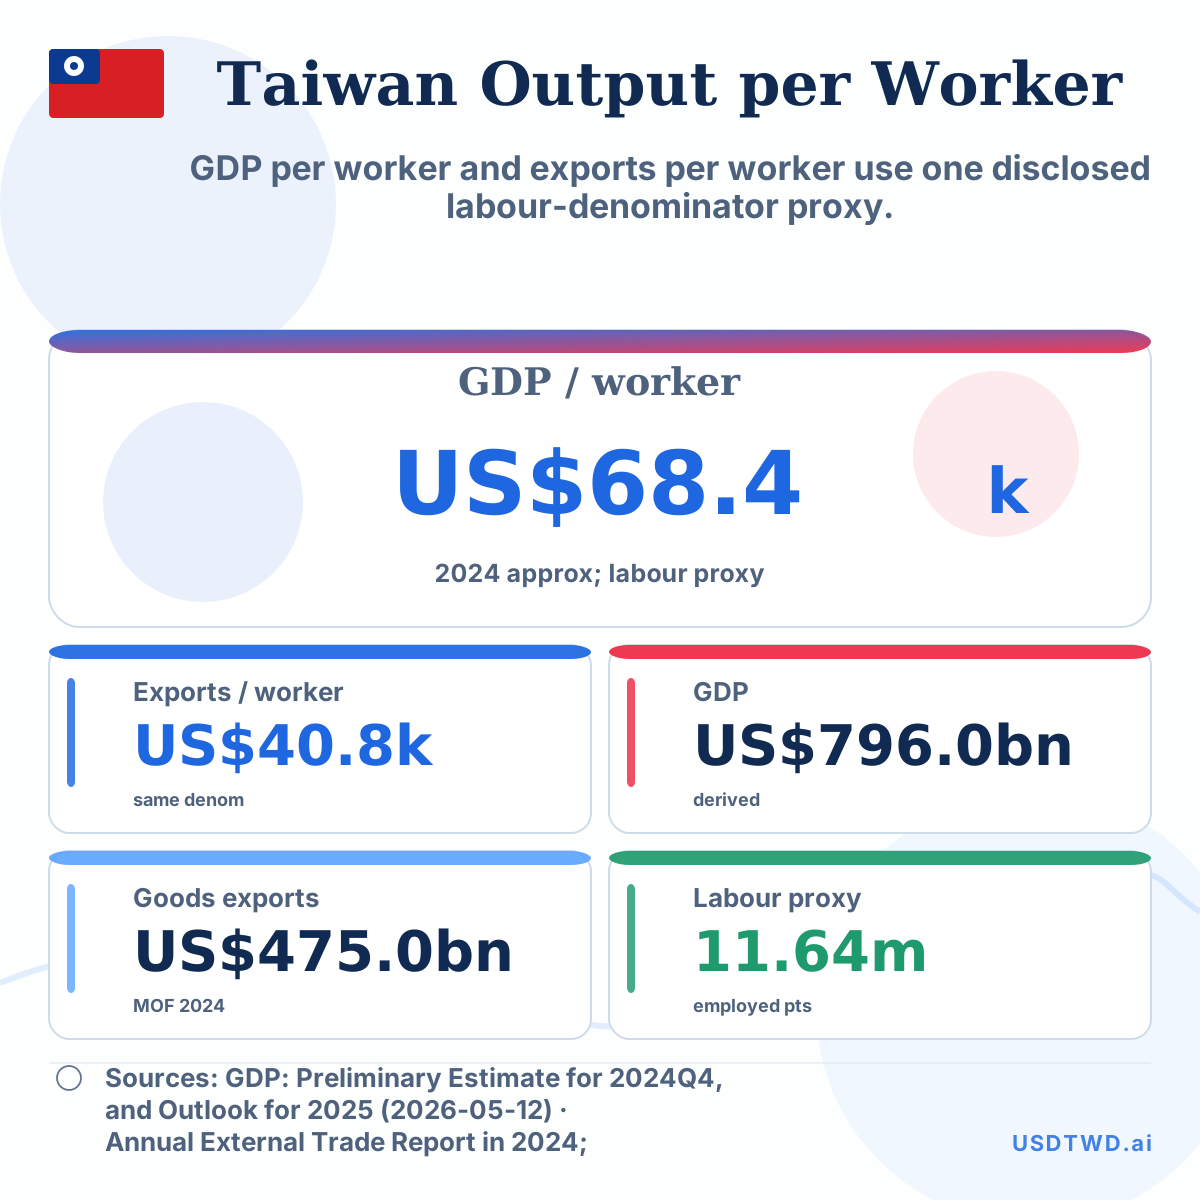
Taiwan GDP and Exports per Worker, 2024
GDP per worker and exports per worker use one disclosed labour-denominator proxy.
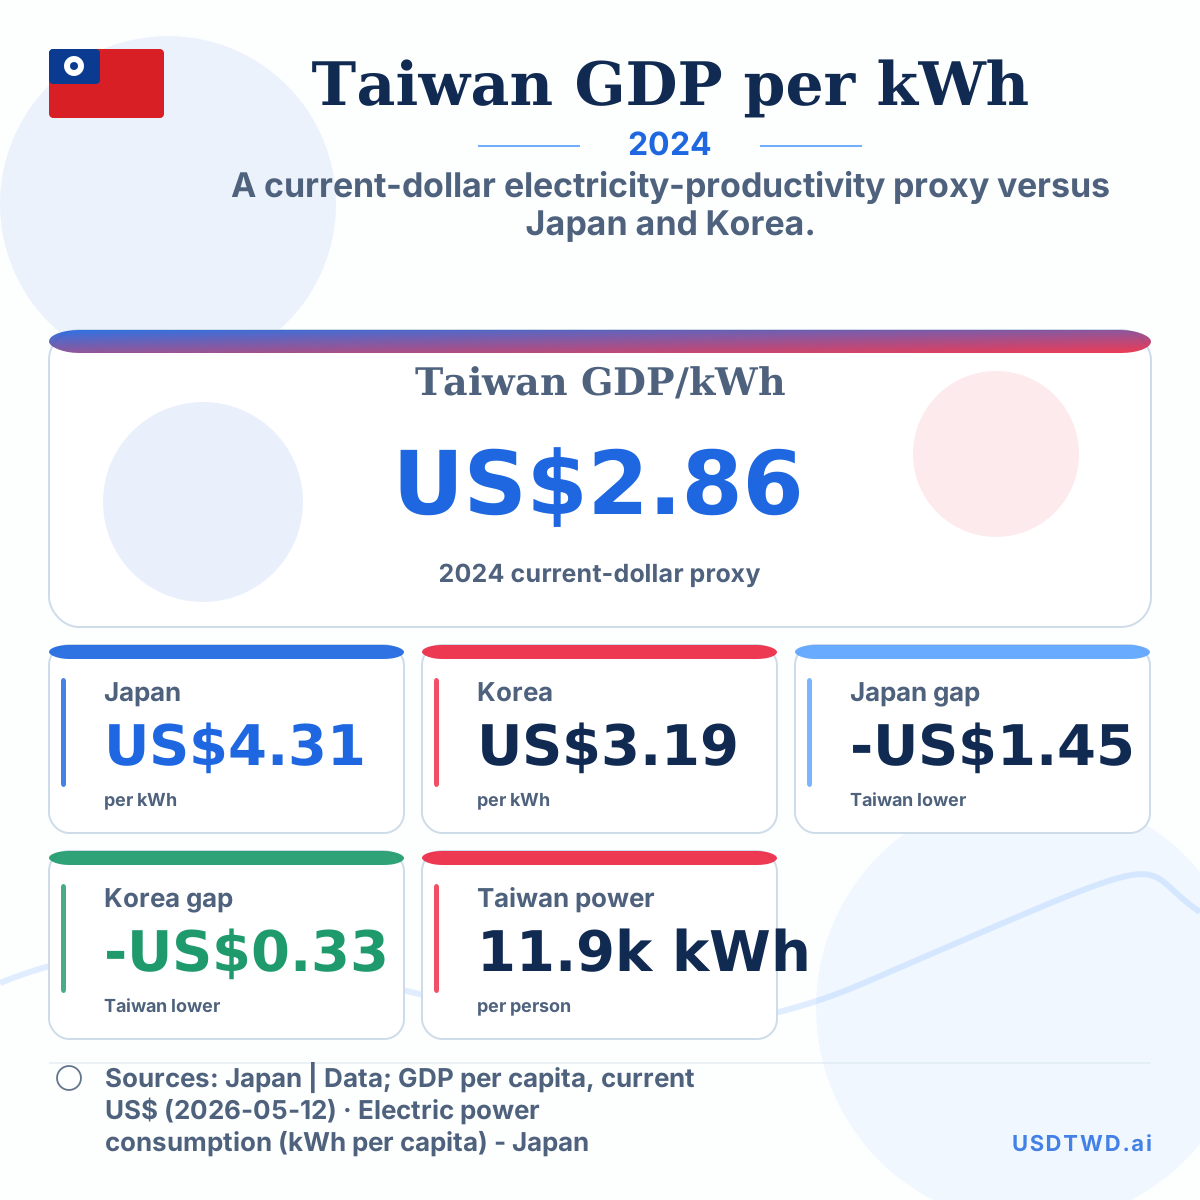
Taiwan GDP per kWh vs Japan and Korea, 2024
A current-dollar electricity-productivity proxy versus Japan and Korea.
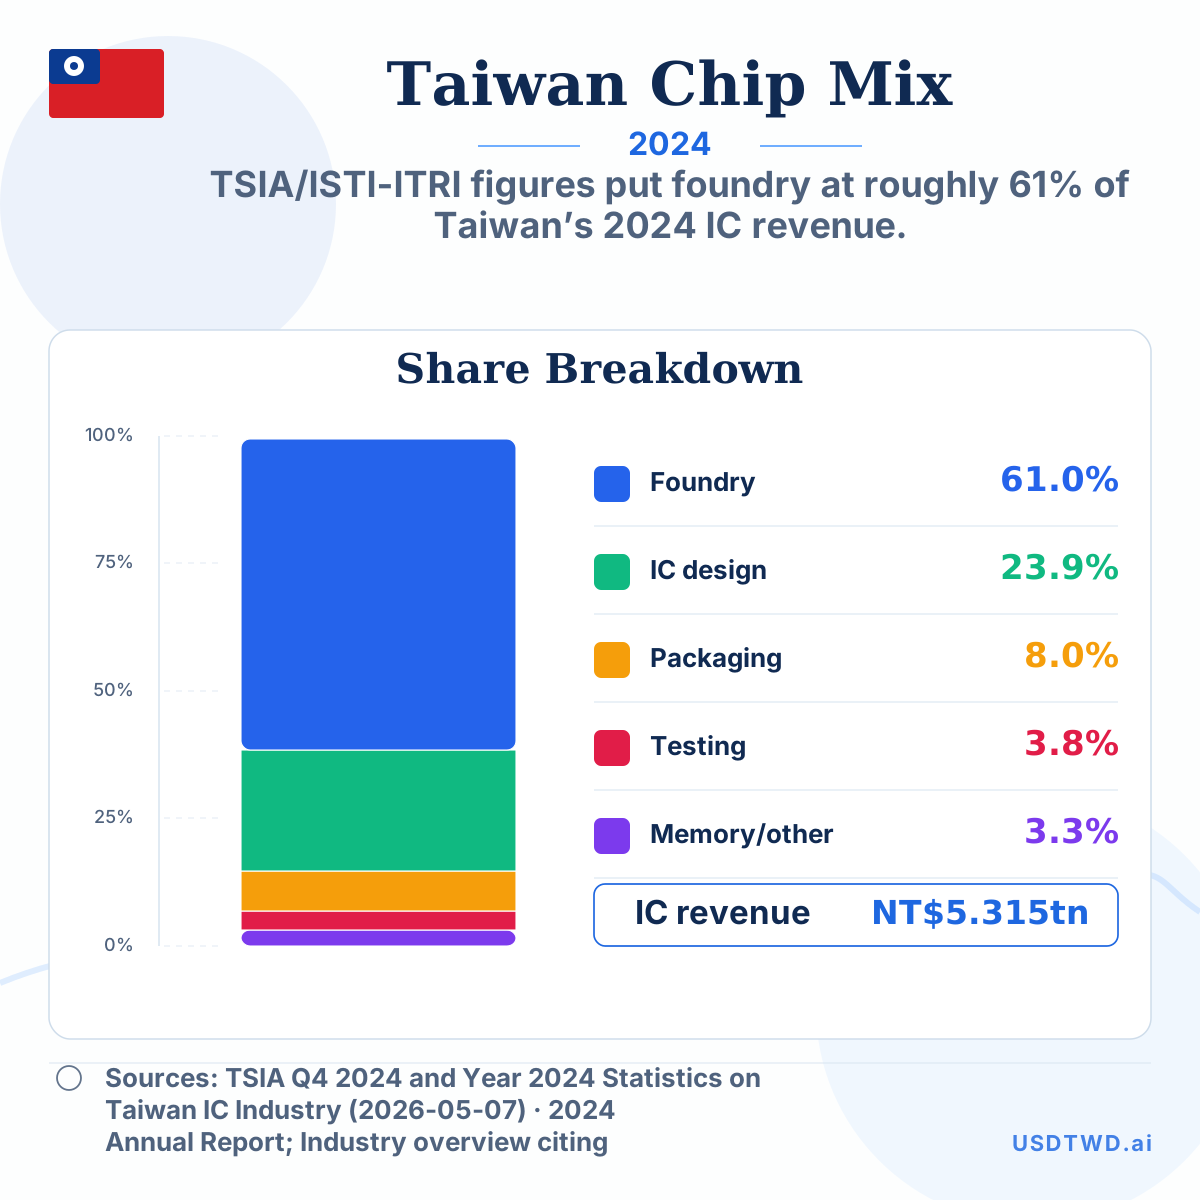
Taiwan semiconductor sector revenue mix, 2024
TSIA/ISTI-ITRI figures put foundry at roughly 61% of Taiwan’s 2024 IC revenue.
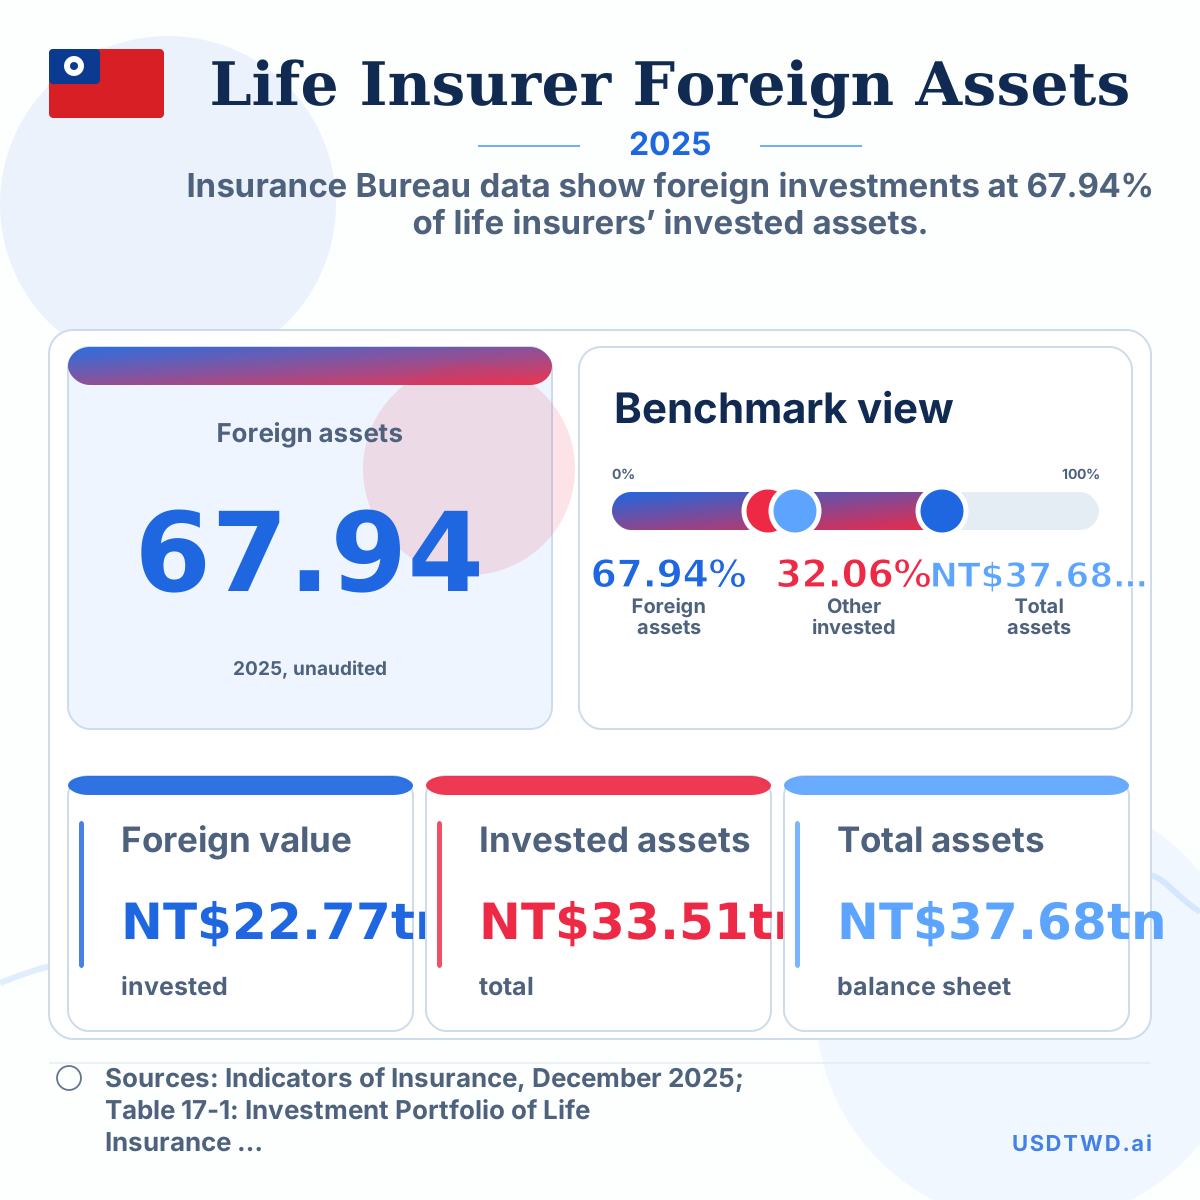
Taiwan life-insurance foreign investments, 2025
Insurance Bureau data show foreign investments at 67.94% of life insurers’ invested assets.
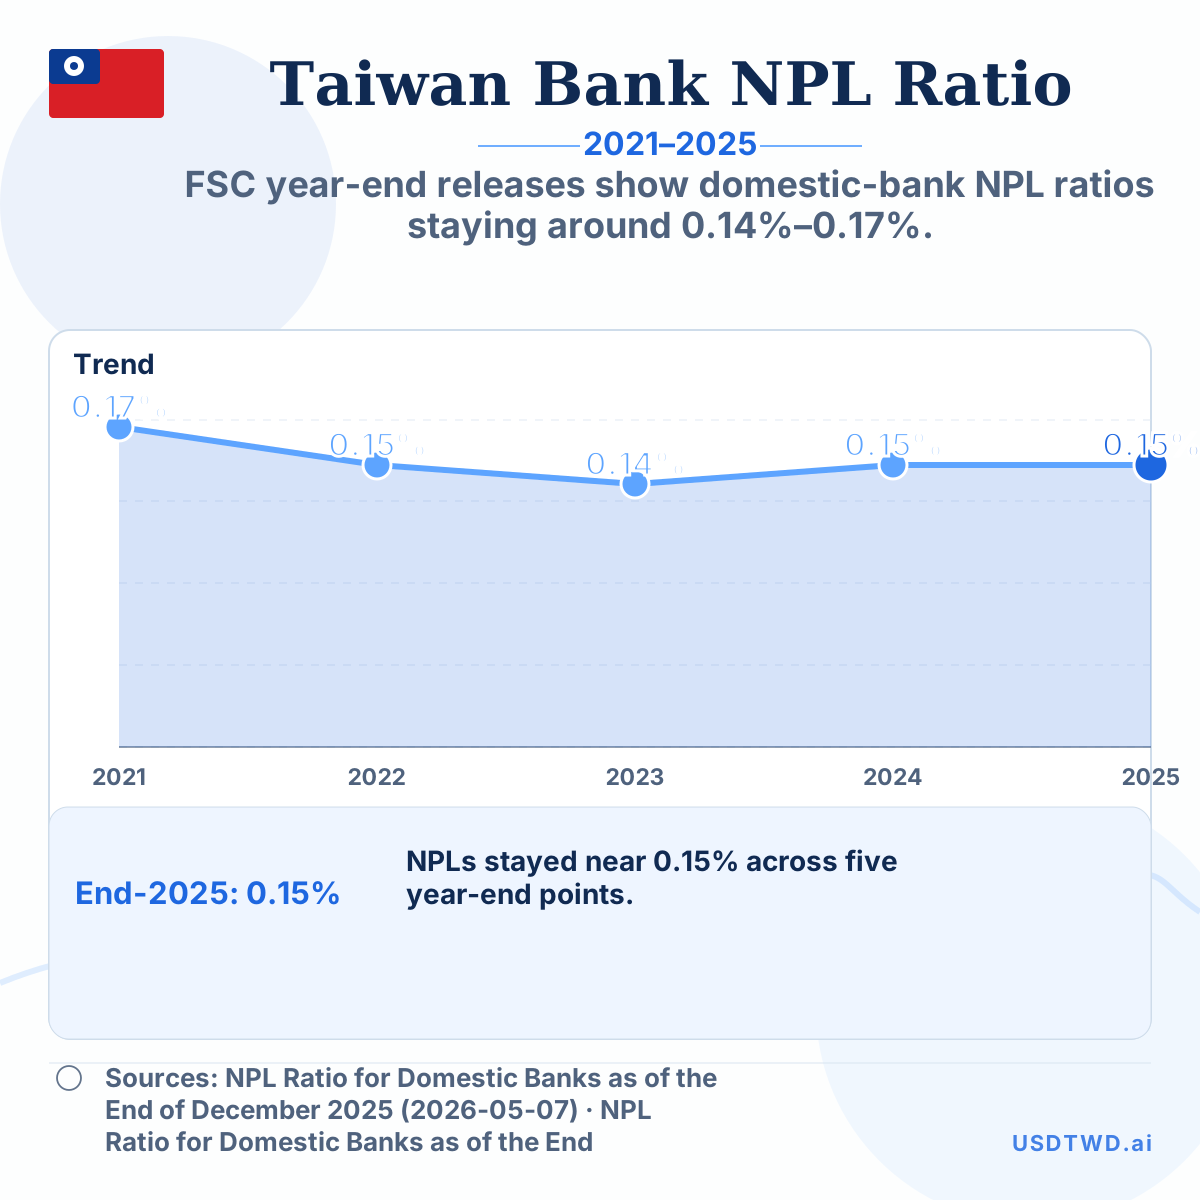
Taiwan domestic-bank non-performing loan ratio, 2021–2025
FSC year-end releases show domestic-bank NPL ratios staying around 0.14%–0.17%.
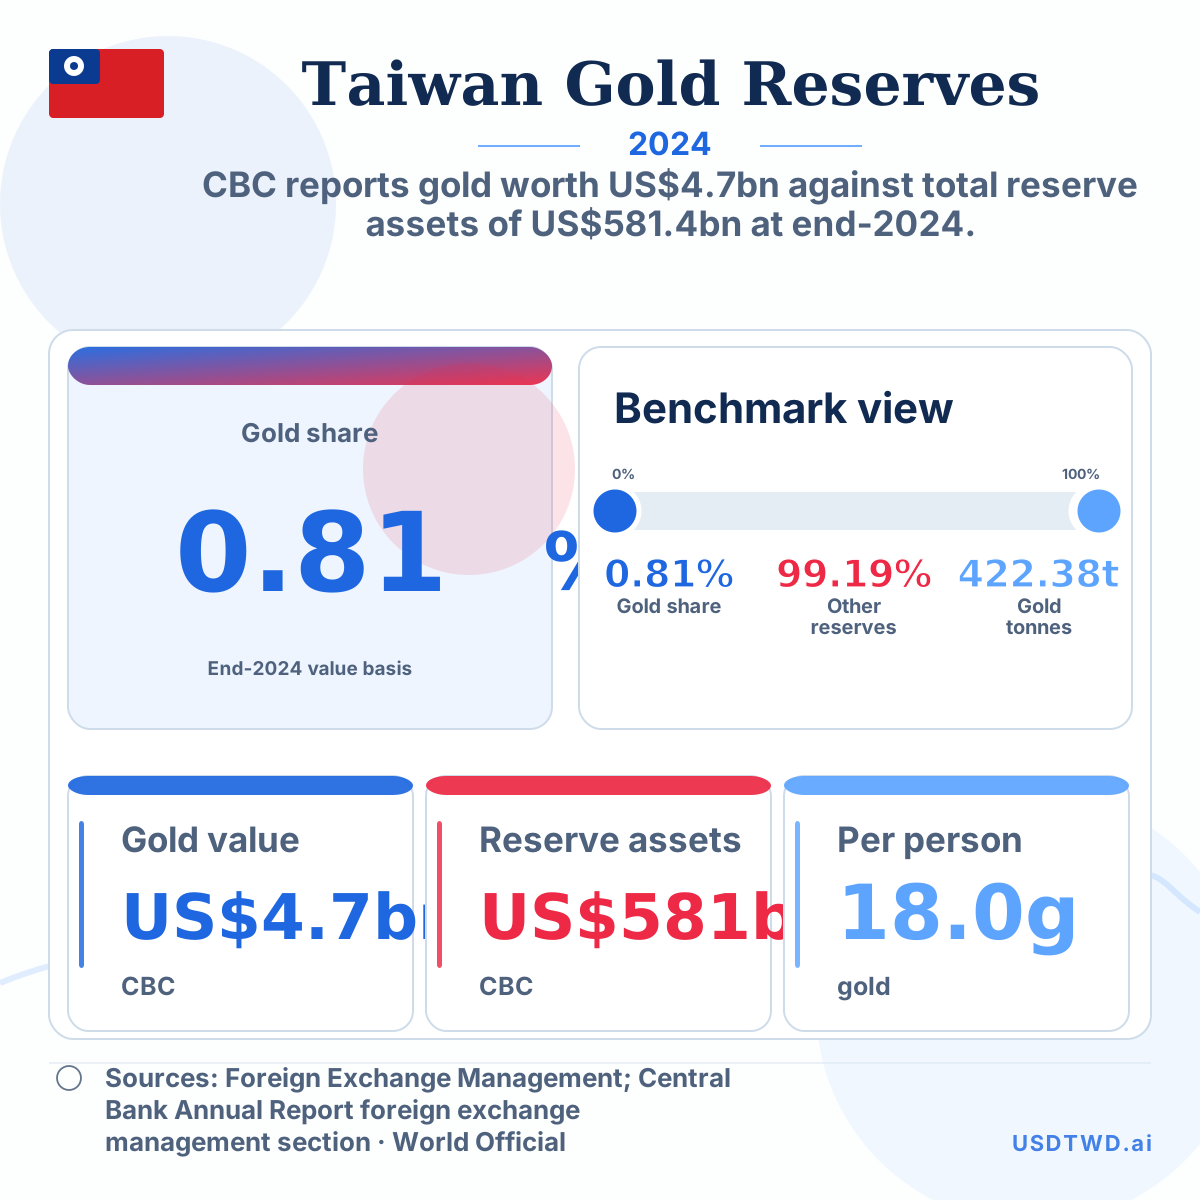
Taiwan central-bank gold reserves versus reserve assets, 2024
CBC reports gold worth US$4.7bn against total reserve assets of US$581.4bn at end-2024.
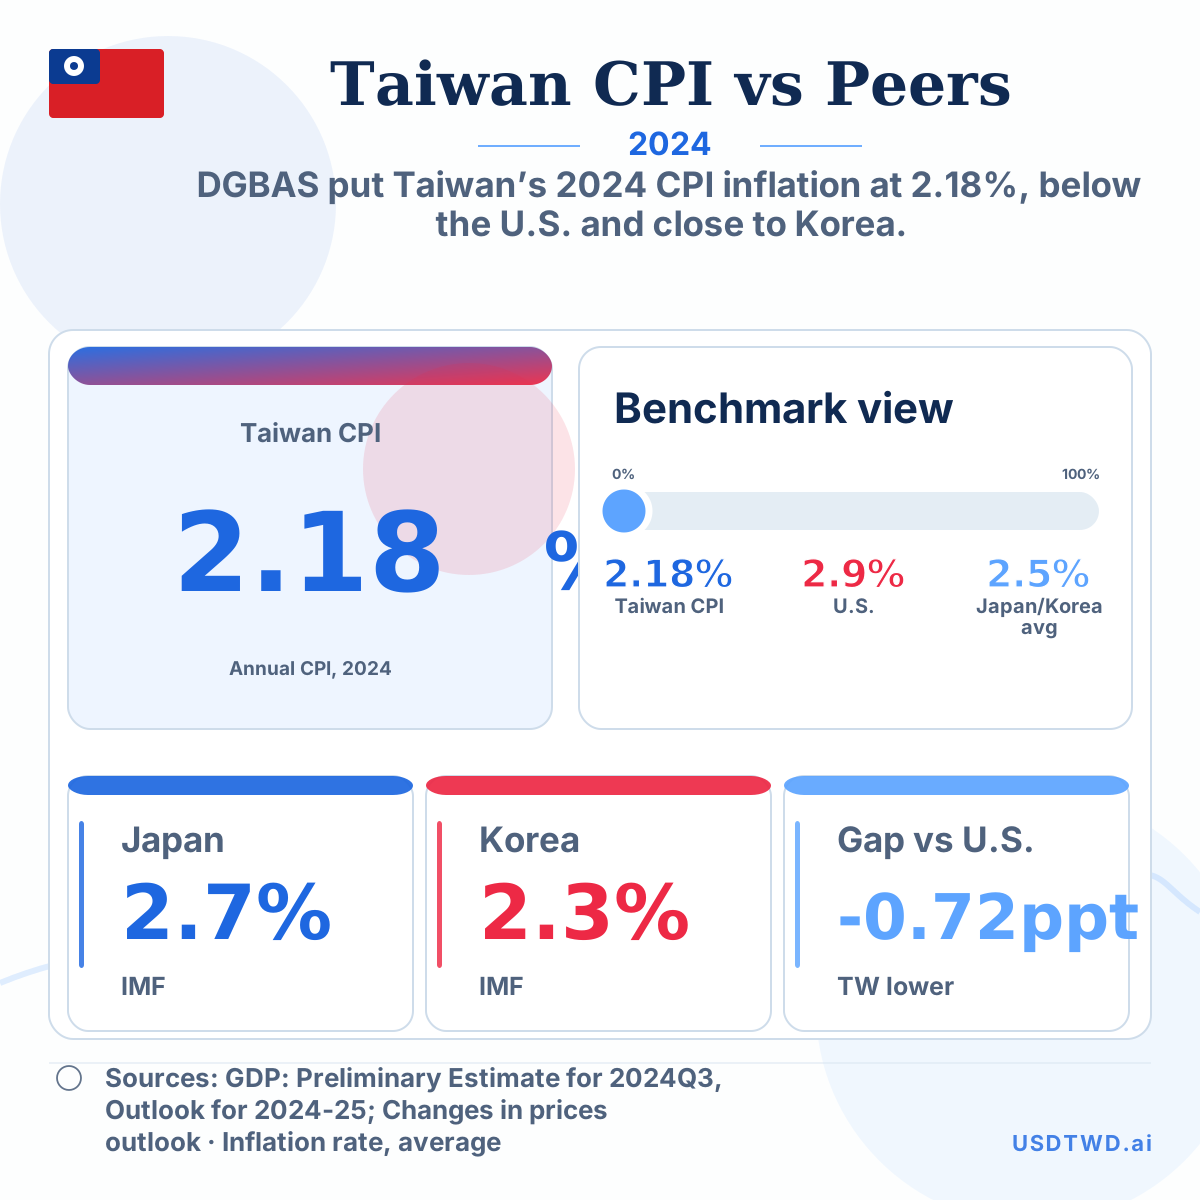
Taiwan CPI inflation versus Japan, Korea and the United States, 2024
DGBAS put Taiwan’s 2024 CPI inflation at 2.18%, below the U.S. and close to Korea.
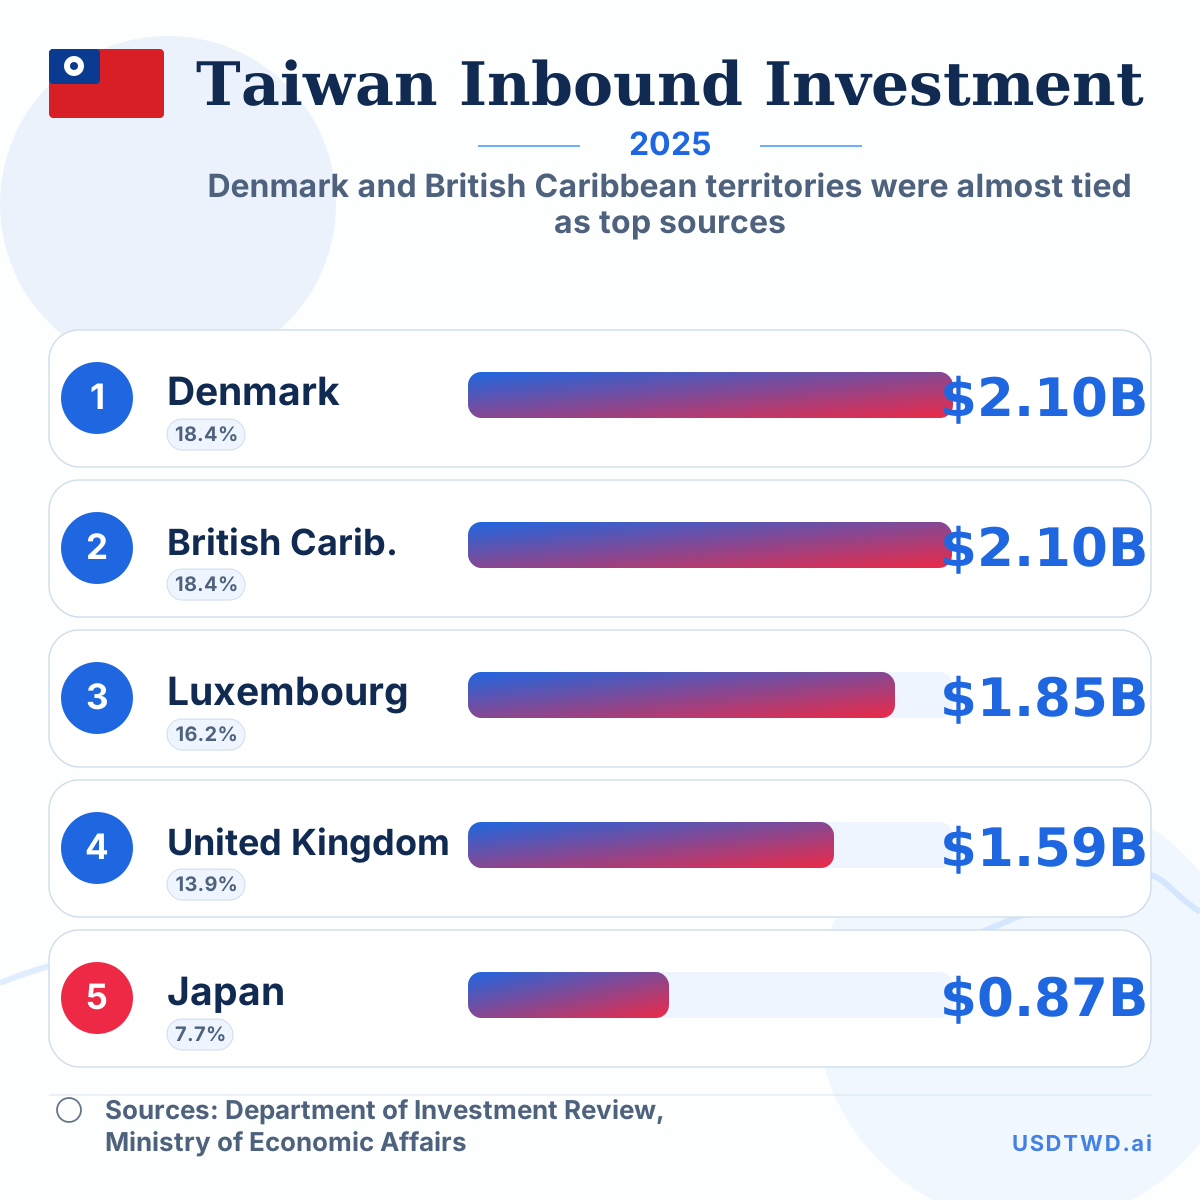
Top Sources of Taiwan Inbound Investment in 2025
Denmark and British Caribbean territories were almost tied as top sources
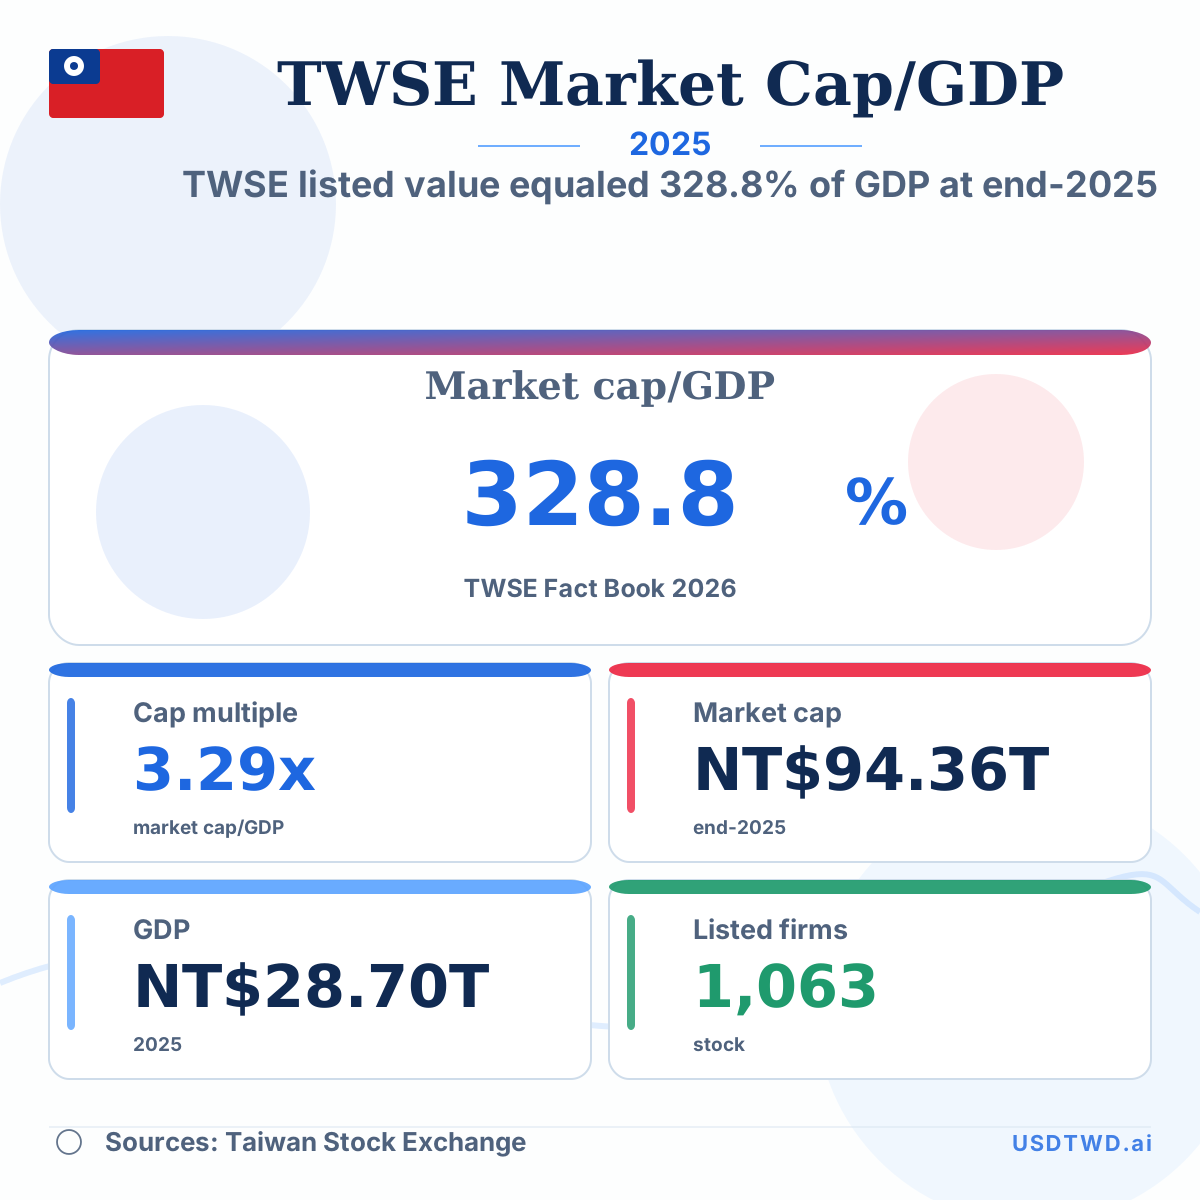
Taiwan Listed Market Cap Was 328.8% of GDP in 2025
TWSE listed value equaled 328.8% of GDP at end-2025
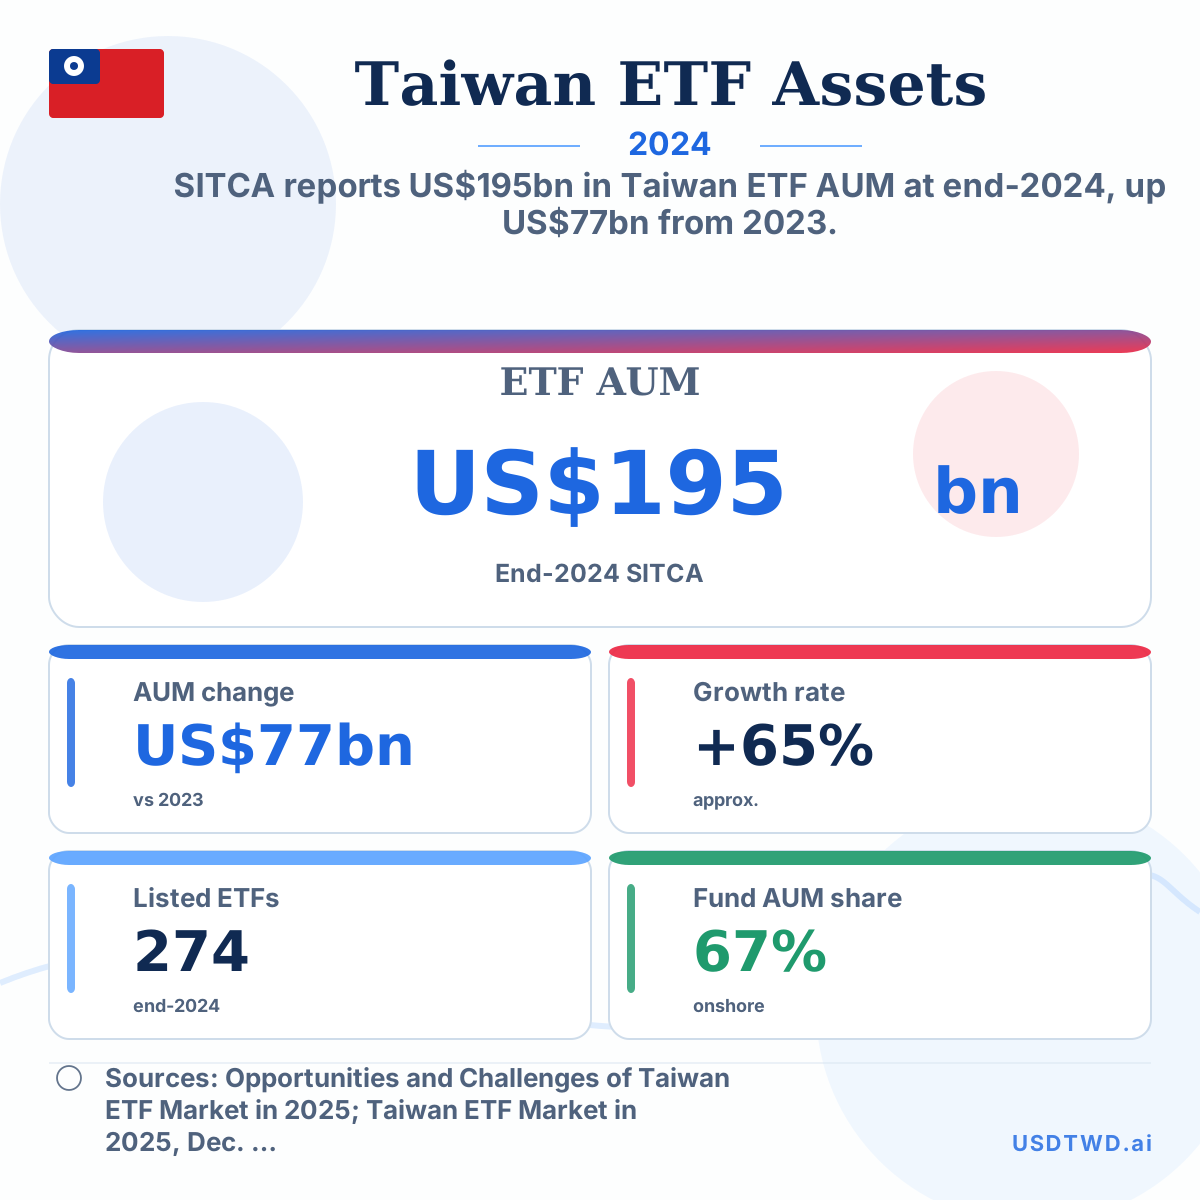
Taiwan ETF assets and listed ETFs, 2024
SITCA reports US$195bn in Taiwan ETF AUM at end-2024, up US$77bn from 2023.
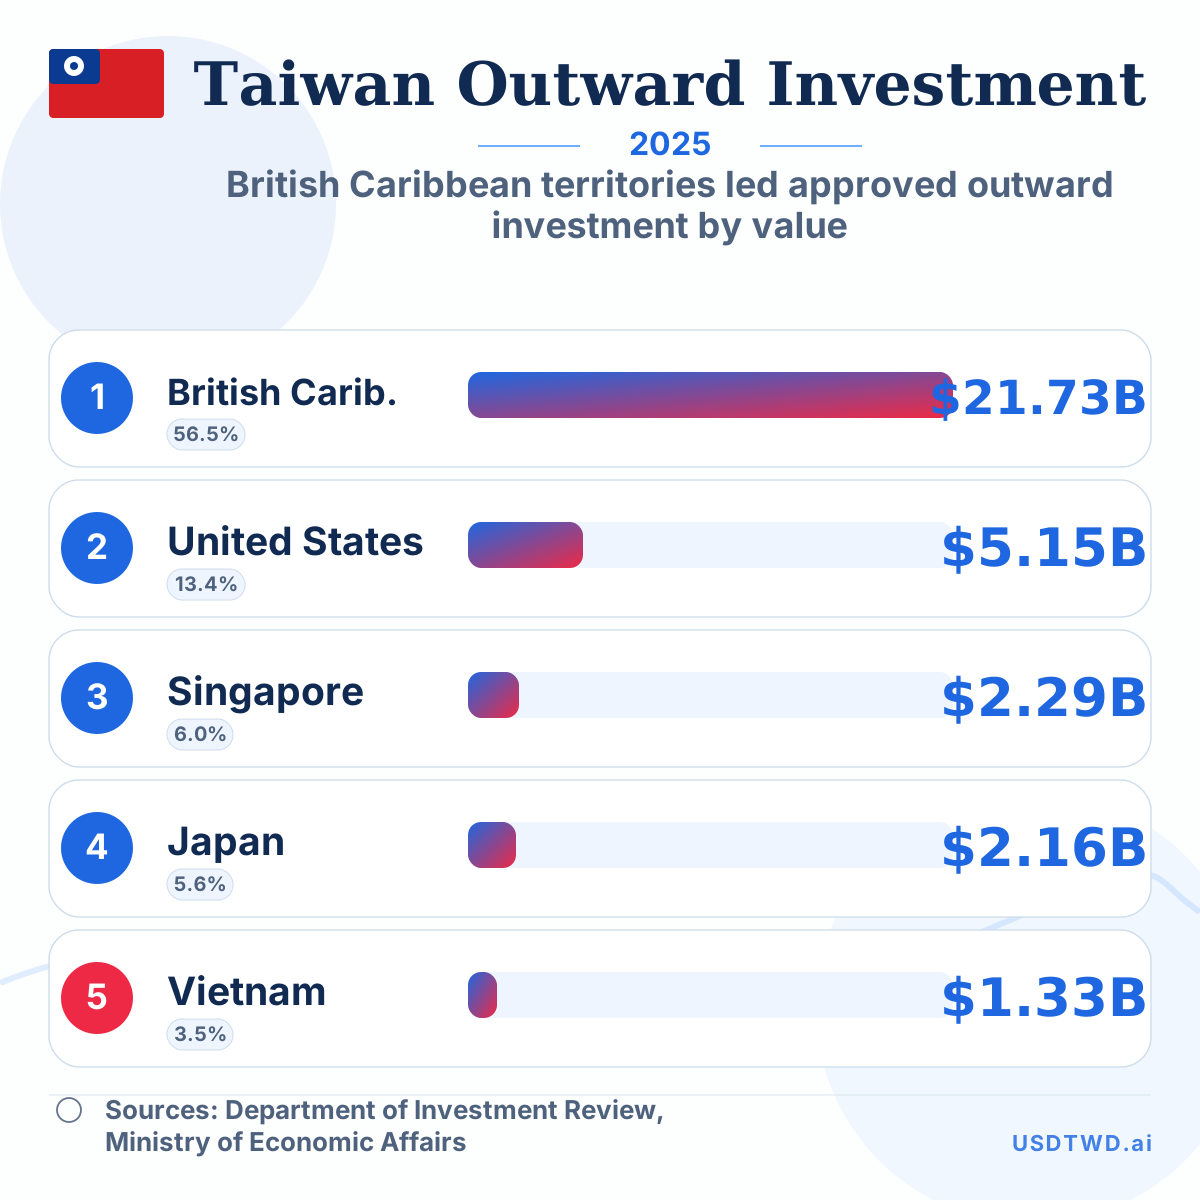
Top Destinations for Taiwan Outward Investment in 2025
British Caribbean territories led approved outward investment by value
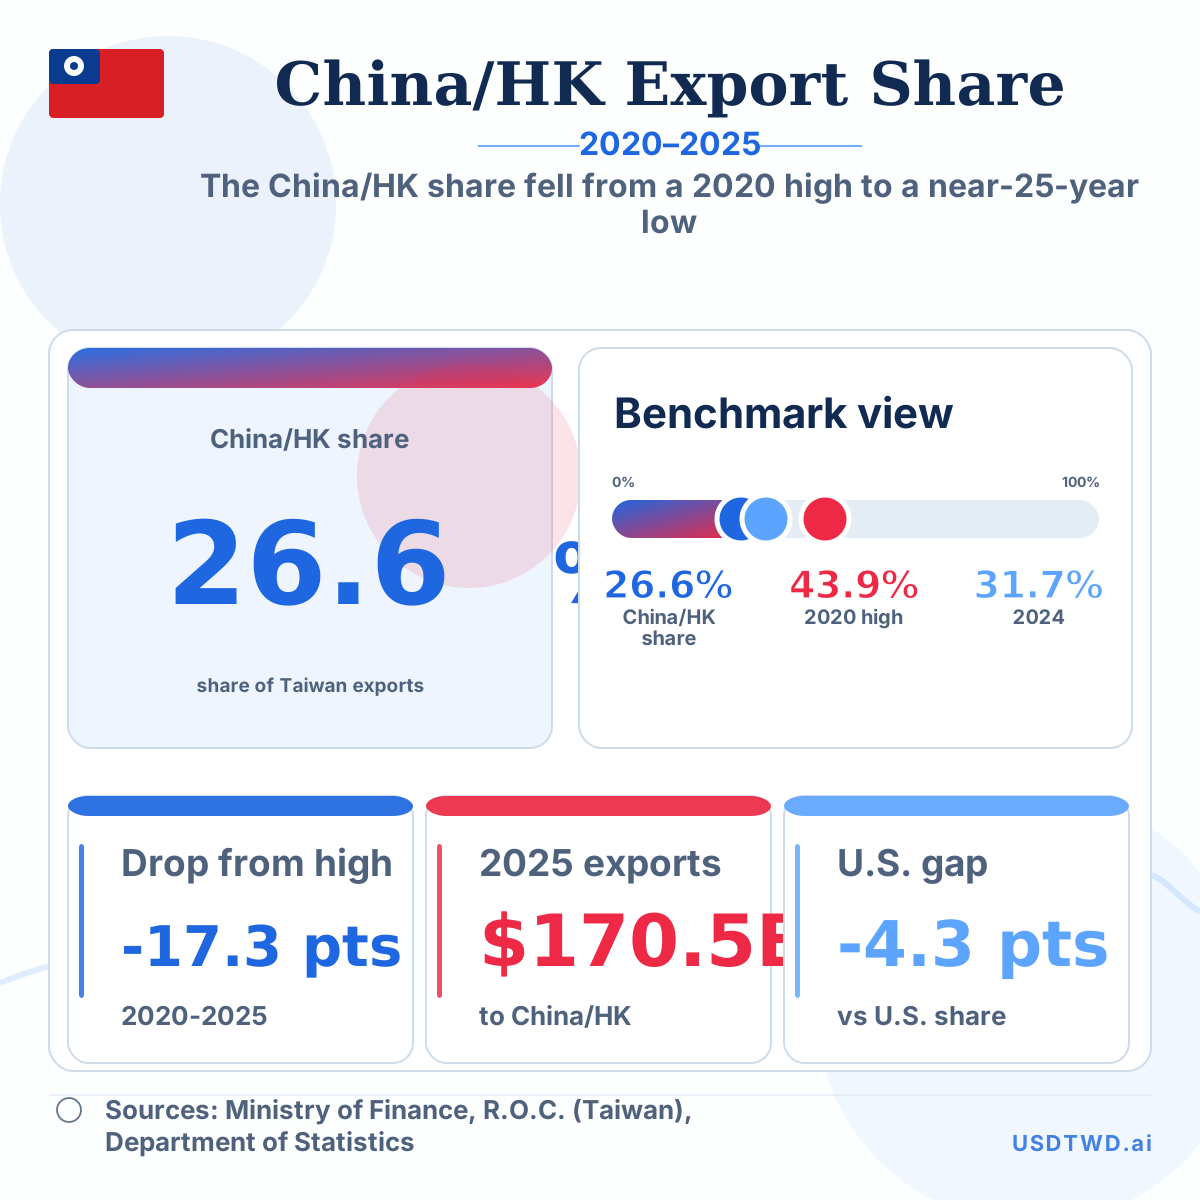
Taiwan China/HK Export Share Fell to 26.6% in 2025
The China/HK share fell from a 2020 high to a near-25-year low
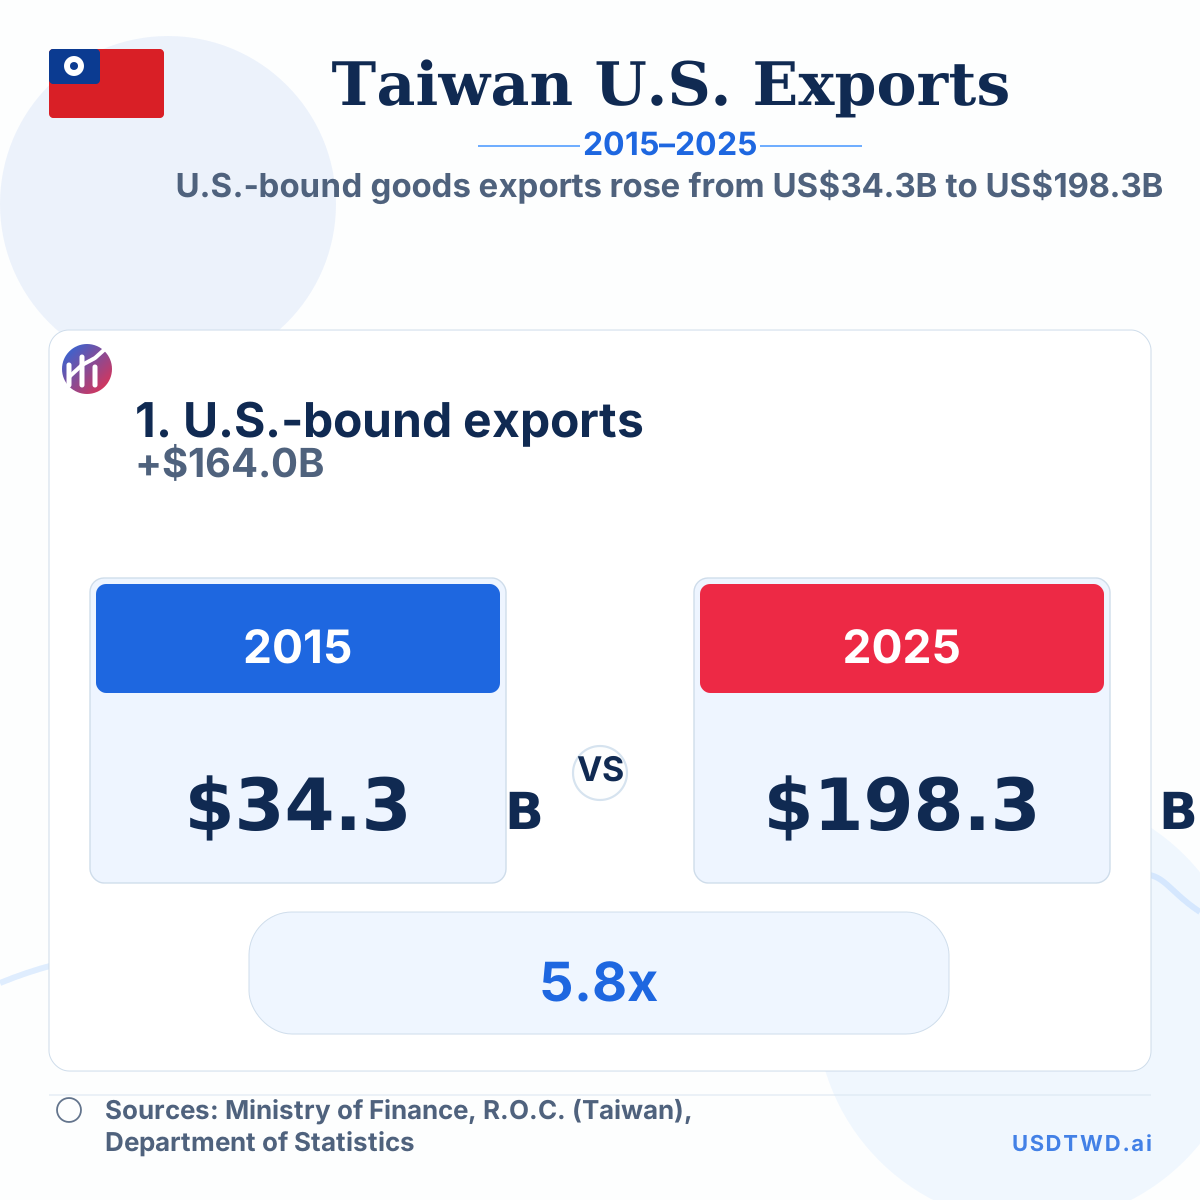
Taiwan U.S.-Bound Exports Rose 5.8x from 2015 to 2025
U.S.-bound goods exports rose from US$34.3B to US$198.3B
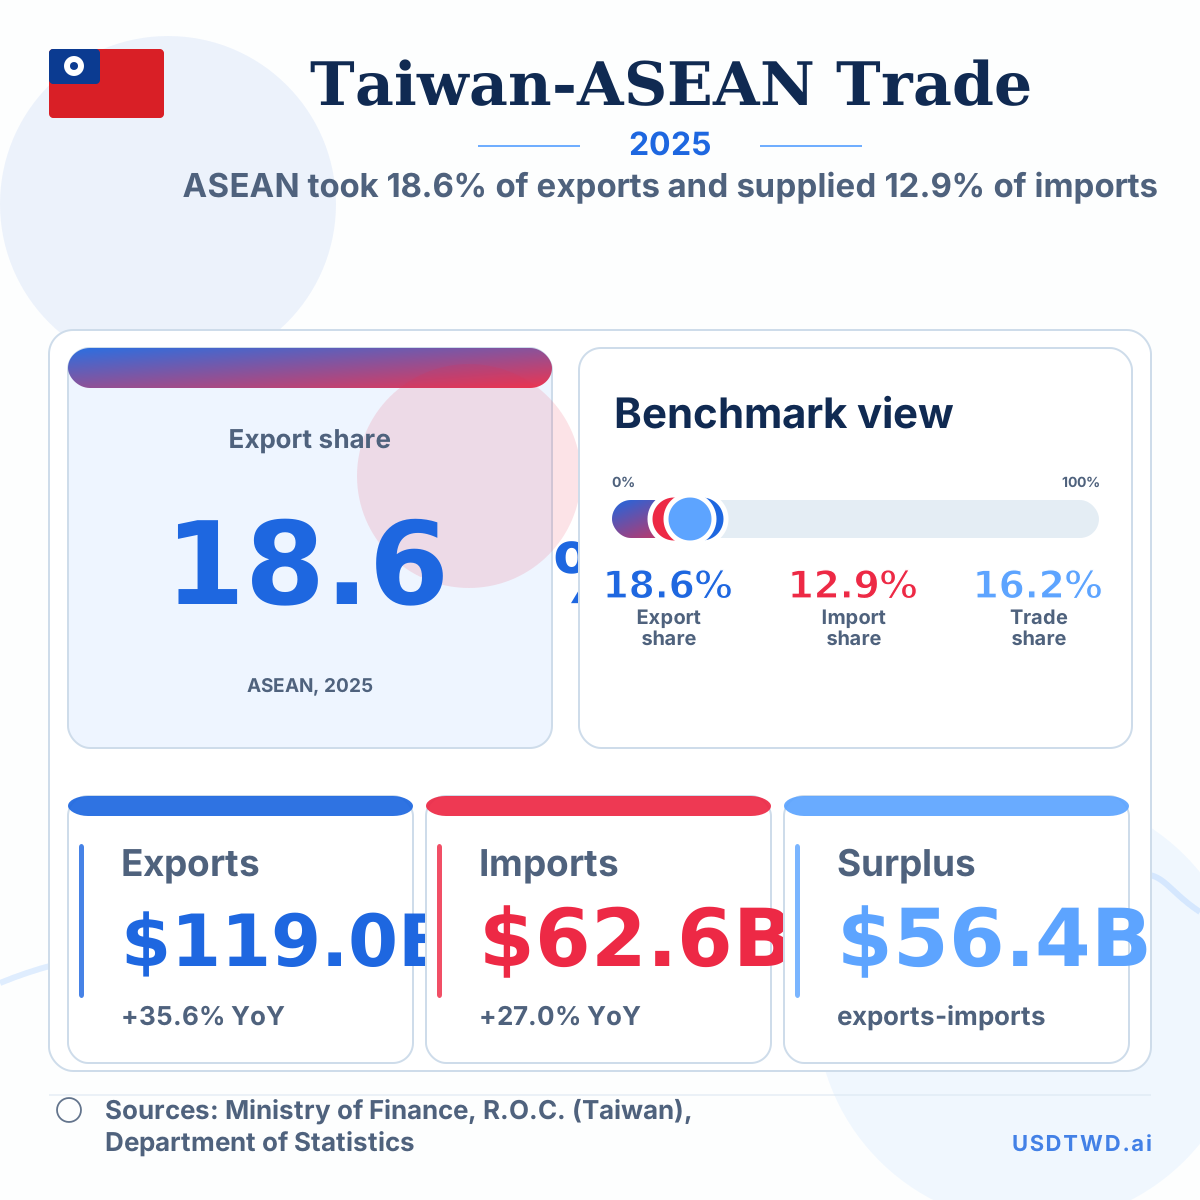
ASEAN Took 18.6% of Taiwan Exports in 2025
ASEAN took 18.6% of exports and supplied 12.9% of imports
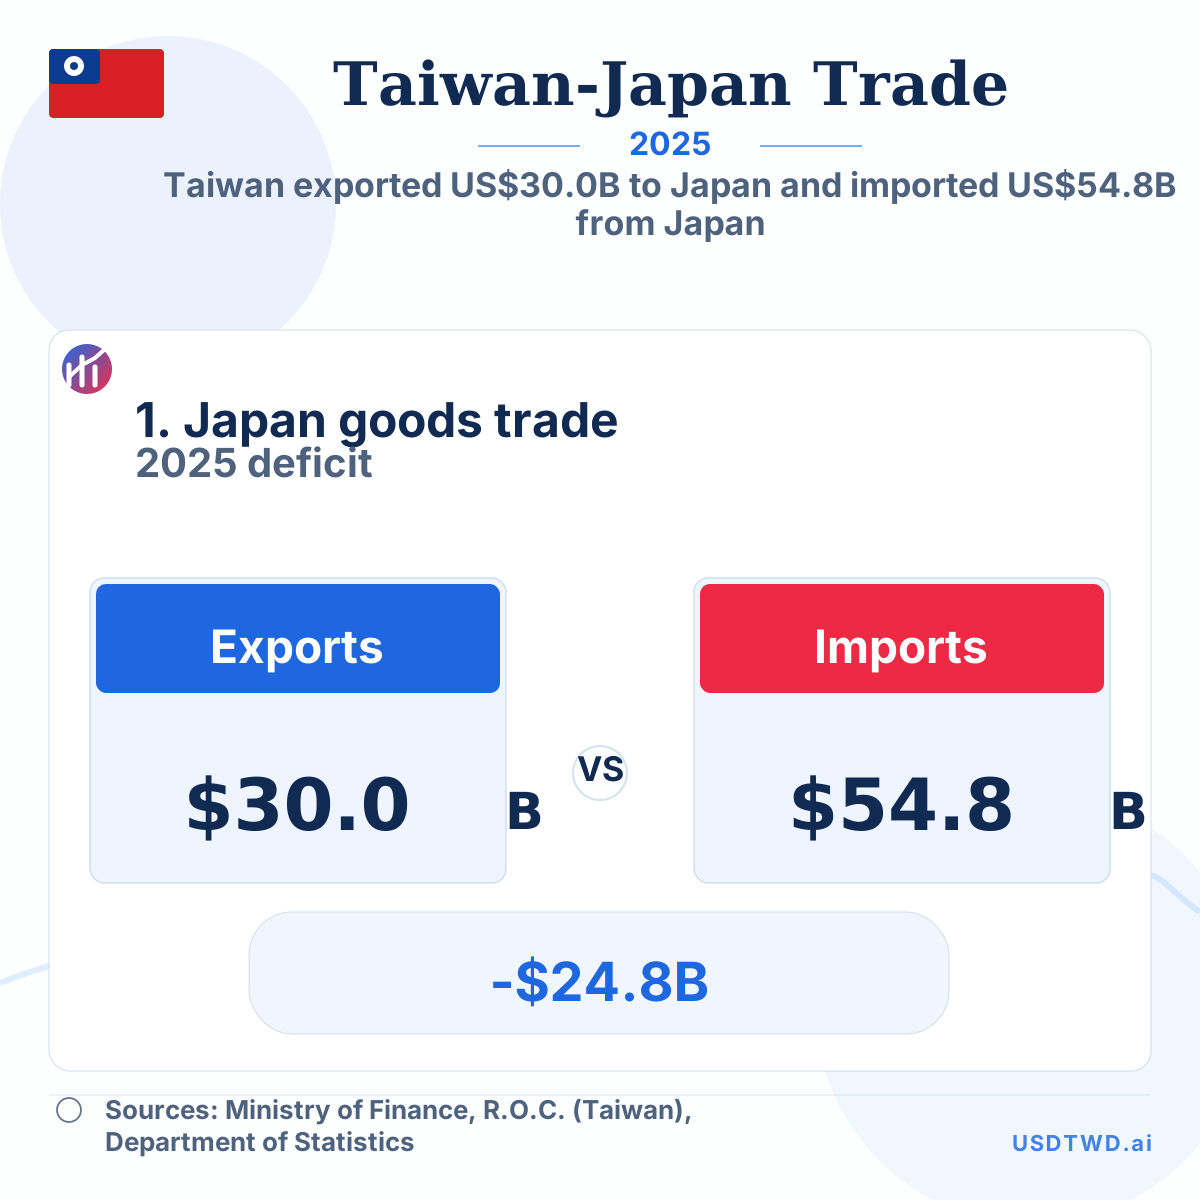
Taiwan Ran a US$24.8B Goods Deficit with Japan in 2025
Taiwan exported US$30.0B to Japan and imported US$54.8B from Japan
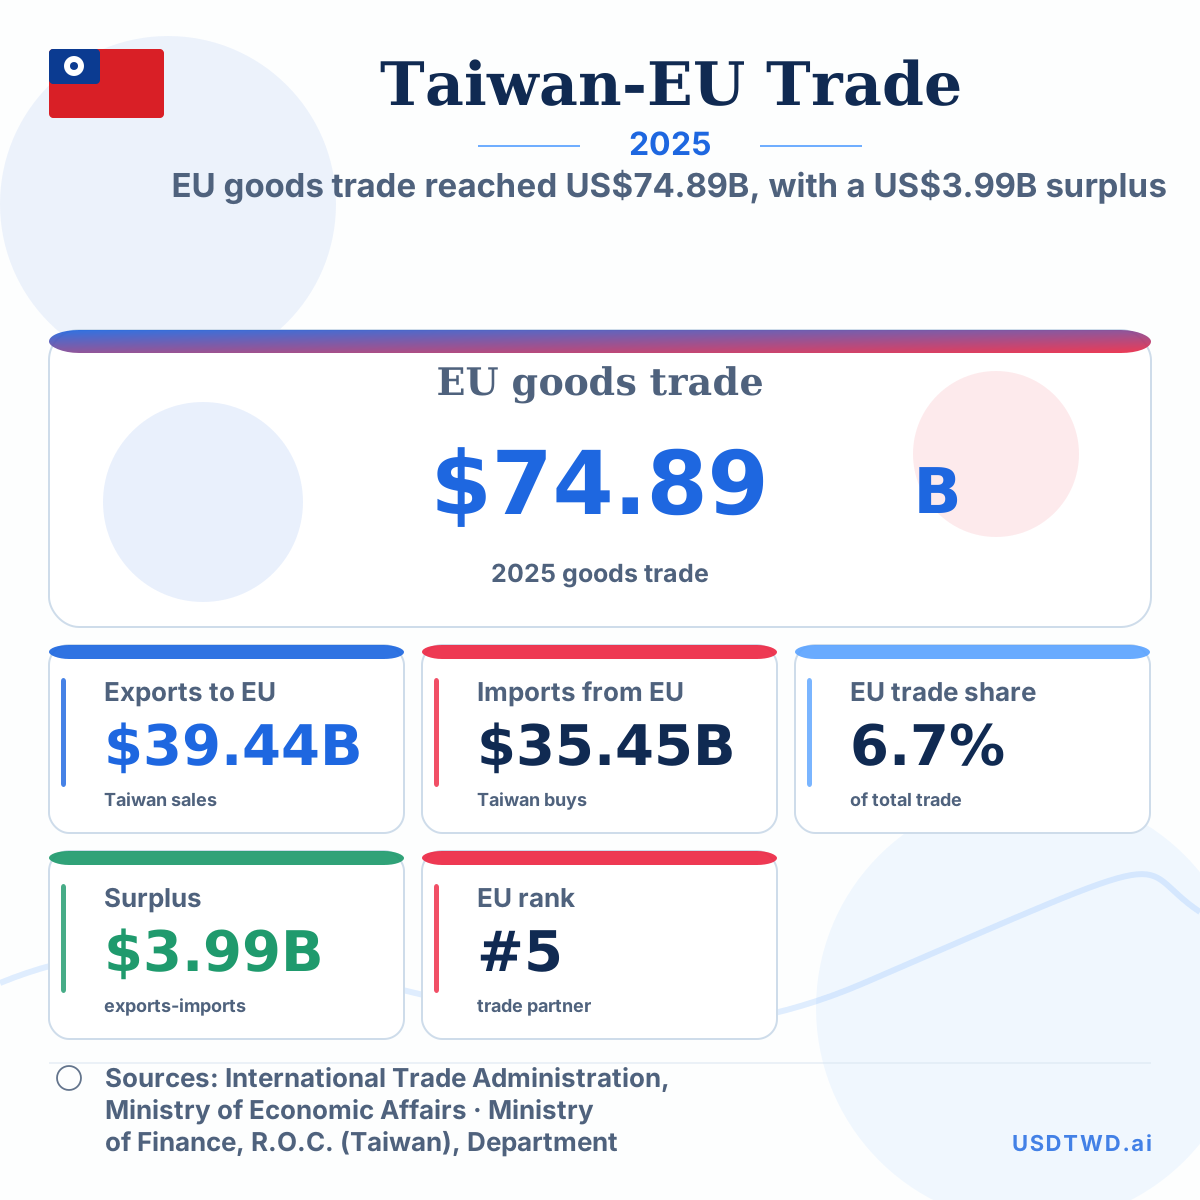
Taiwan-EU Goods Trade Reached US$74.89B in 2025
EU goods trade reached US$74.89B, with a US$3.99B surplus
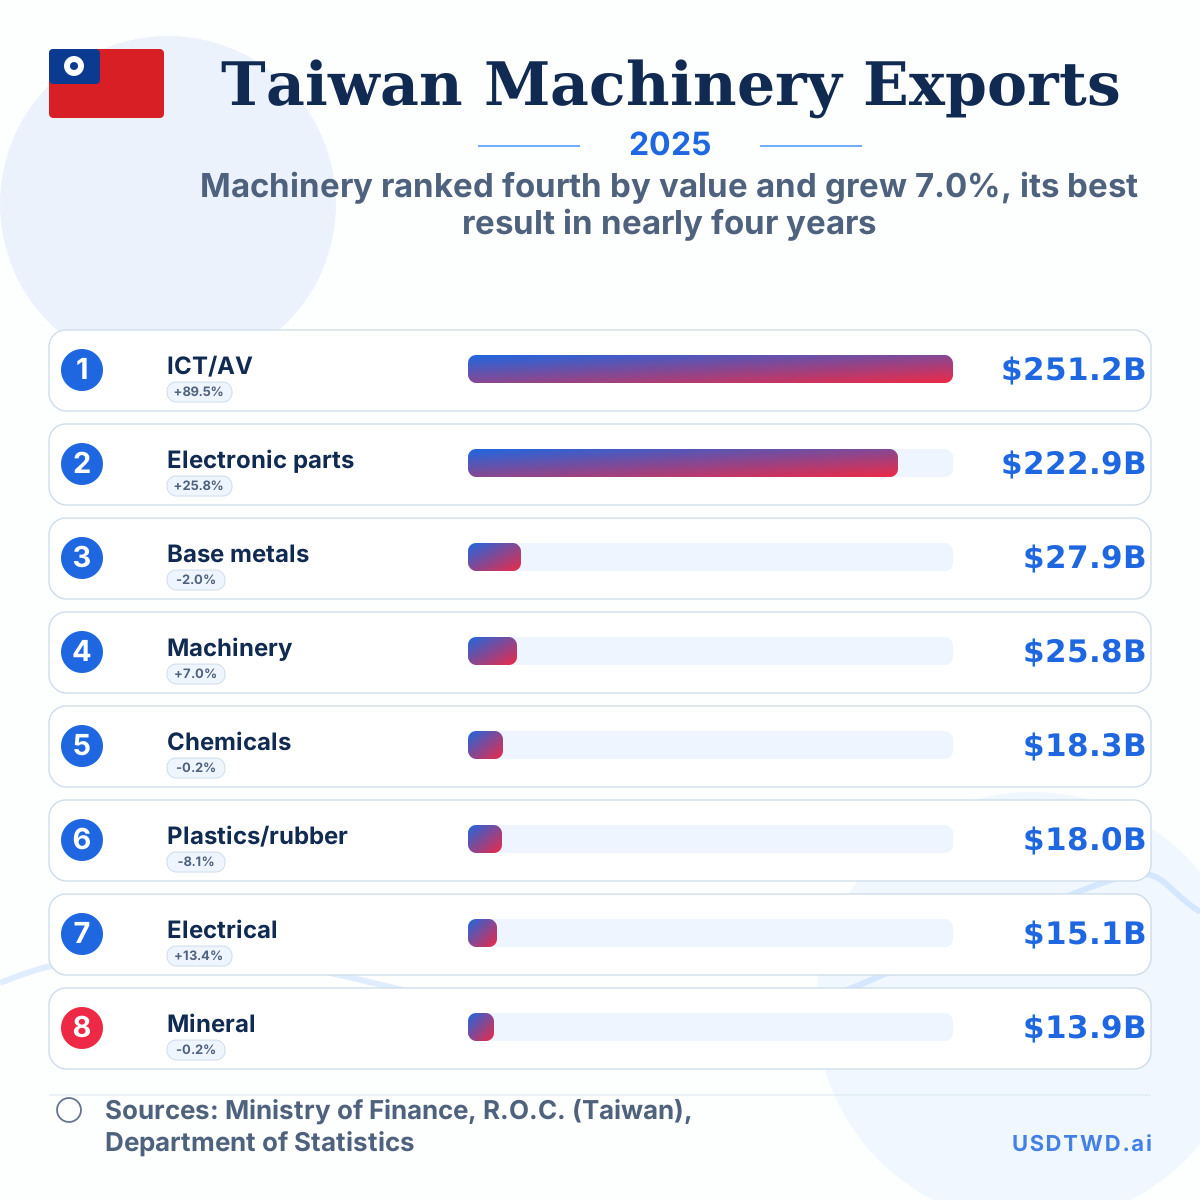
Taiwan Machinery Exports Reached US$25.8B in 2025
Machinery ranked fourth by value and grew 7.0%, its best result in nearly four years
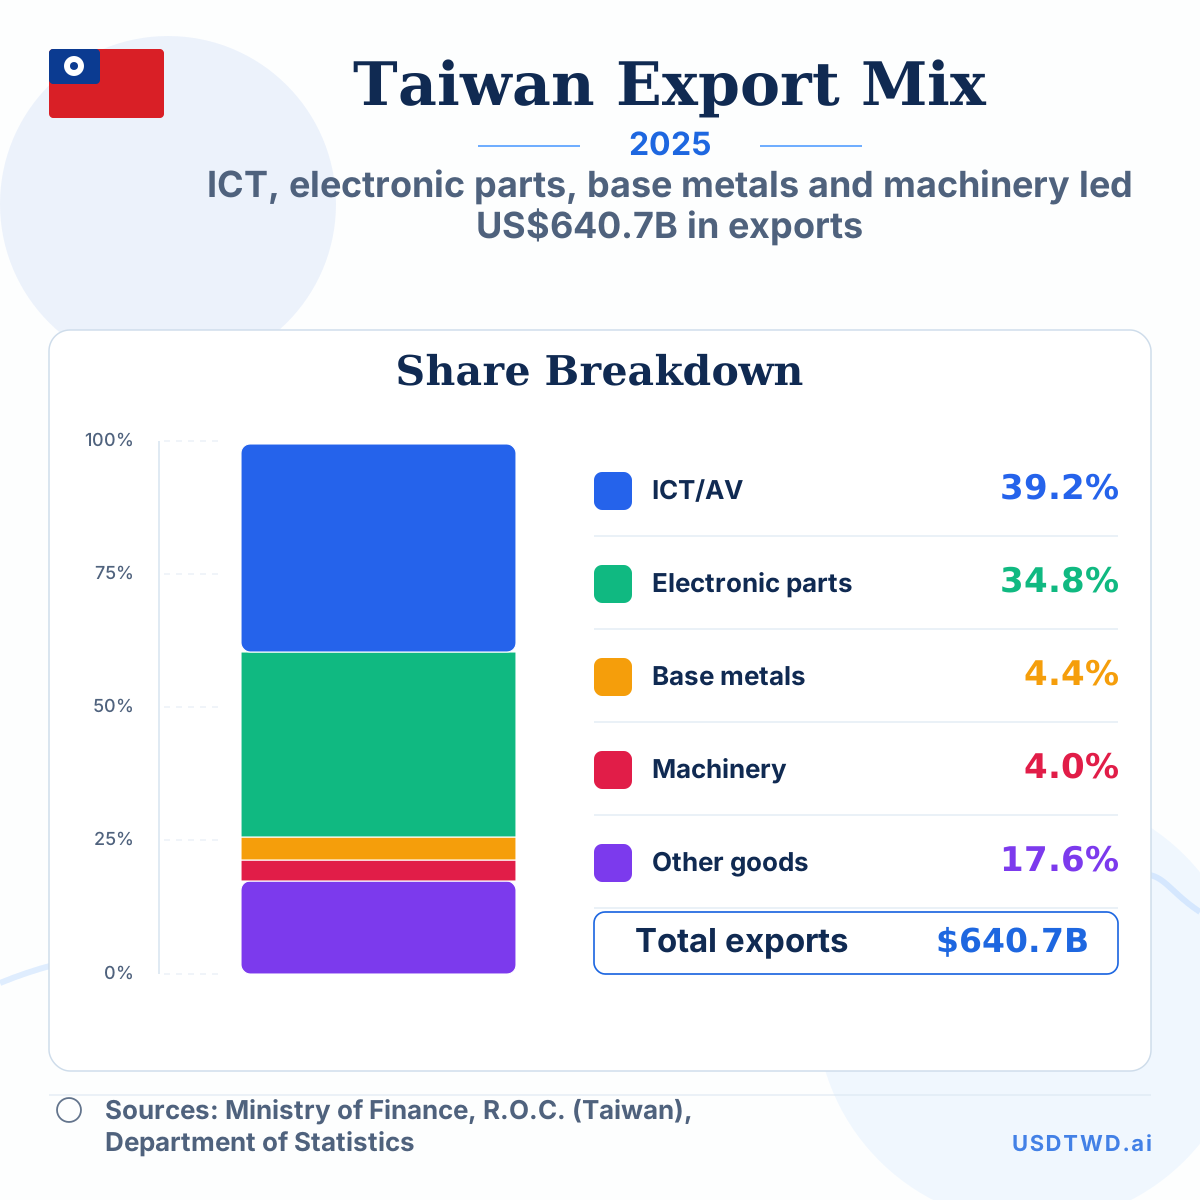
Taiwan’s Top Export Groups Took 82% of Exports in 2025
ICT, electronic parts, base metals and machinery led US$640.7B in exports
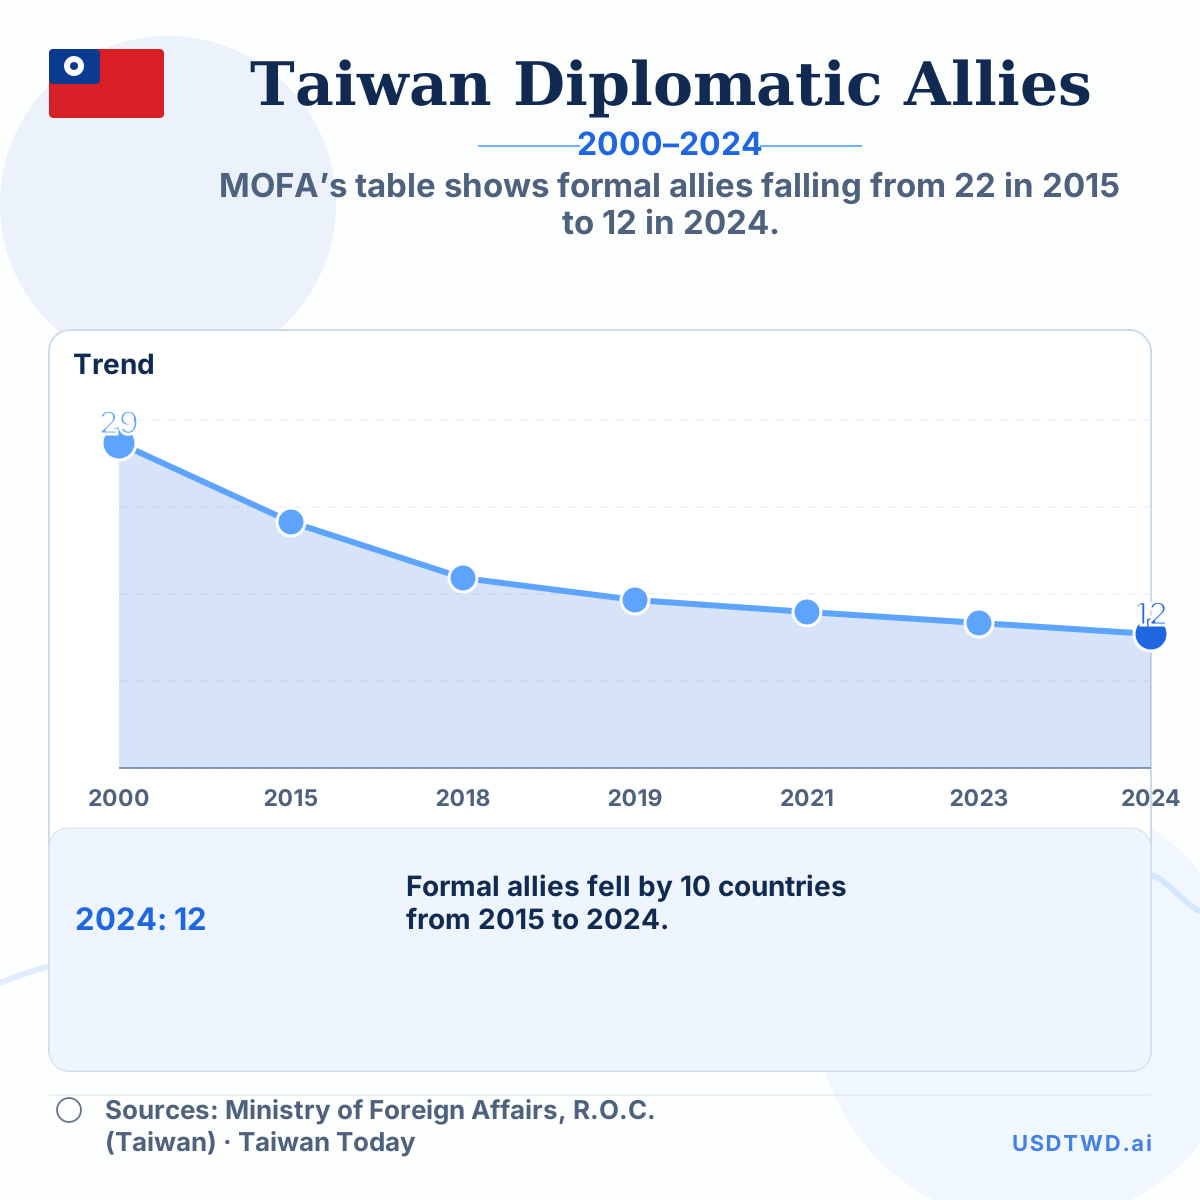
Taiwan’s Formal Diplomatic Allies Fell to 12 by 2024
MOFA’s table shows formal allies falling from 22 in 2015 to 12 in 2024.
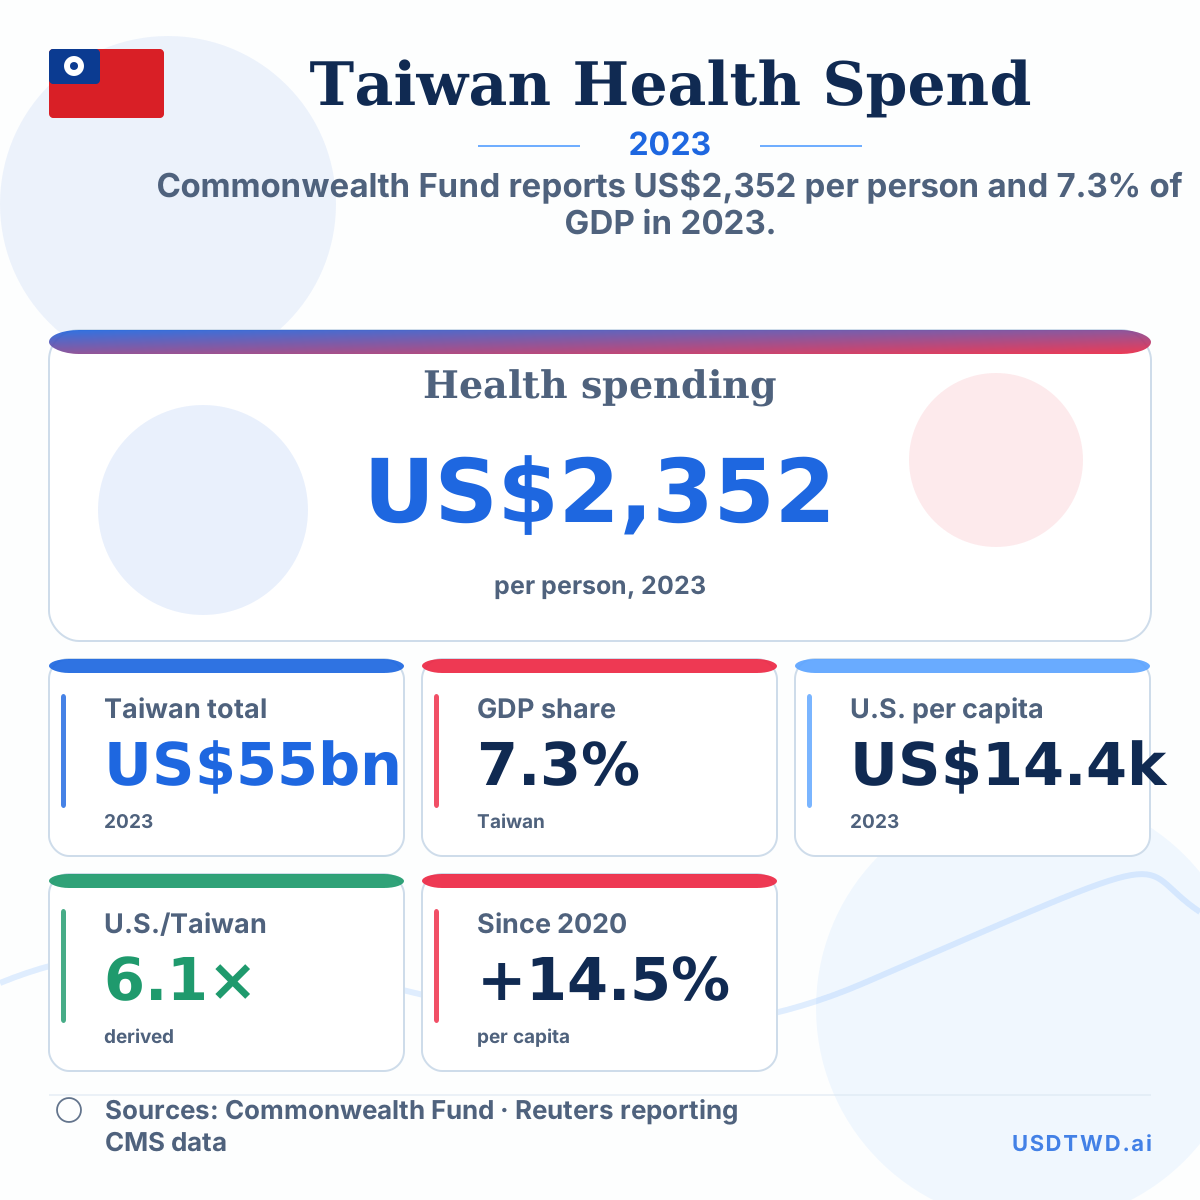
Taiwan Health Spending Reached US$2,352 per Person in 2023
Commonwealth Fund reports US$2,352 per person and 7.3% of GDP in 2023.
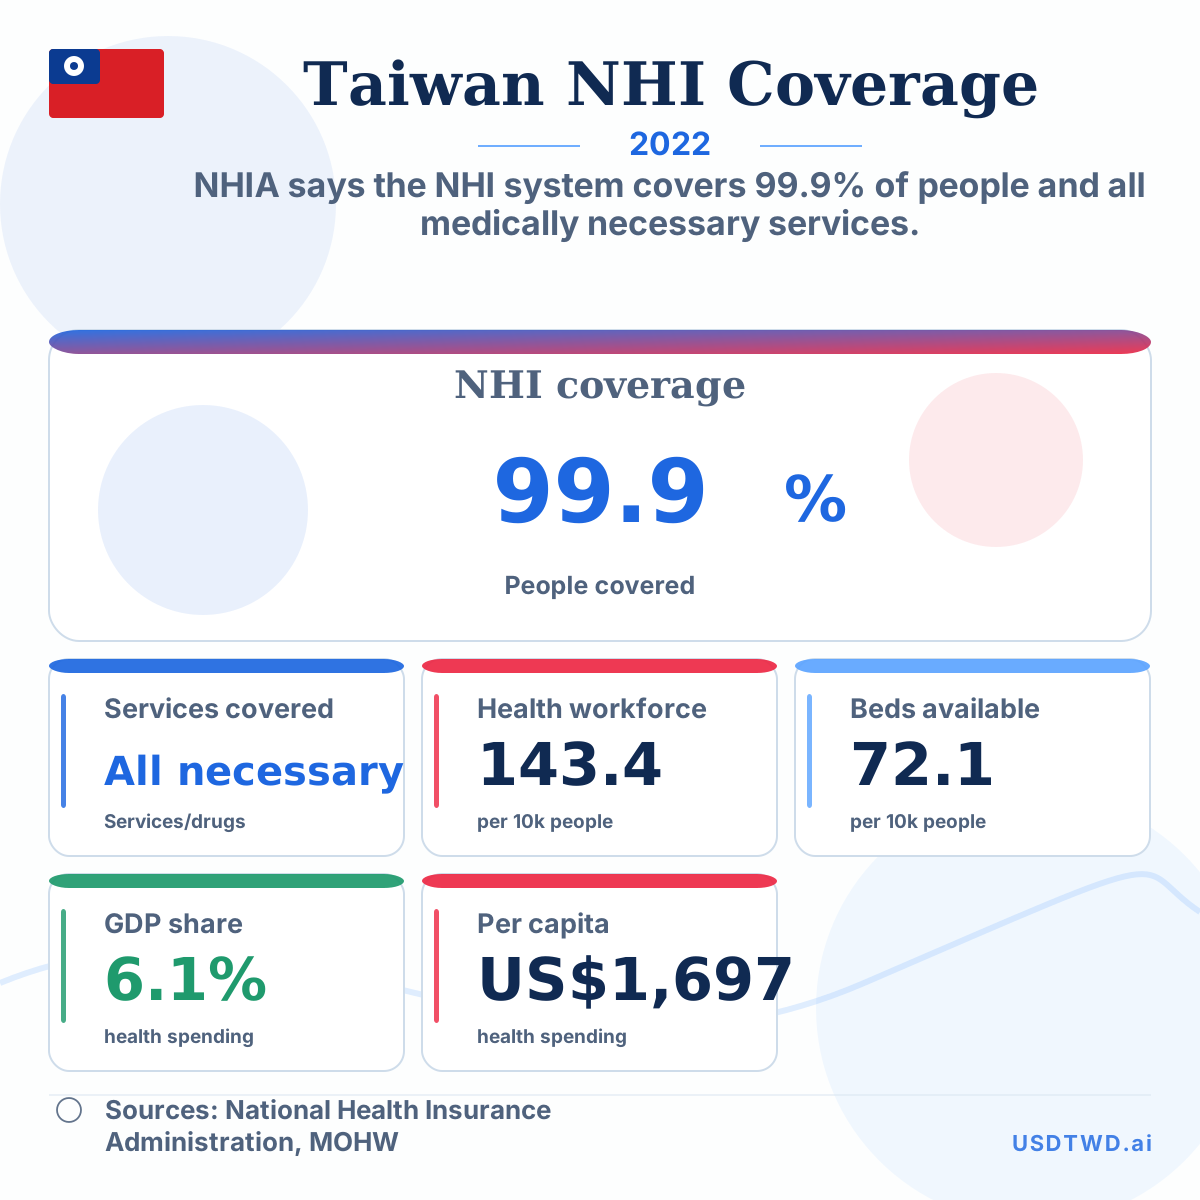
Taiwan National Health Insurance Covers 99.9% of People
NHIA says the NHI system covers 99.9% of people and all medically necessary services.
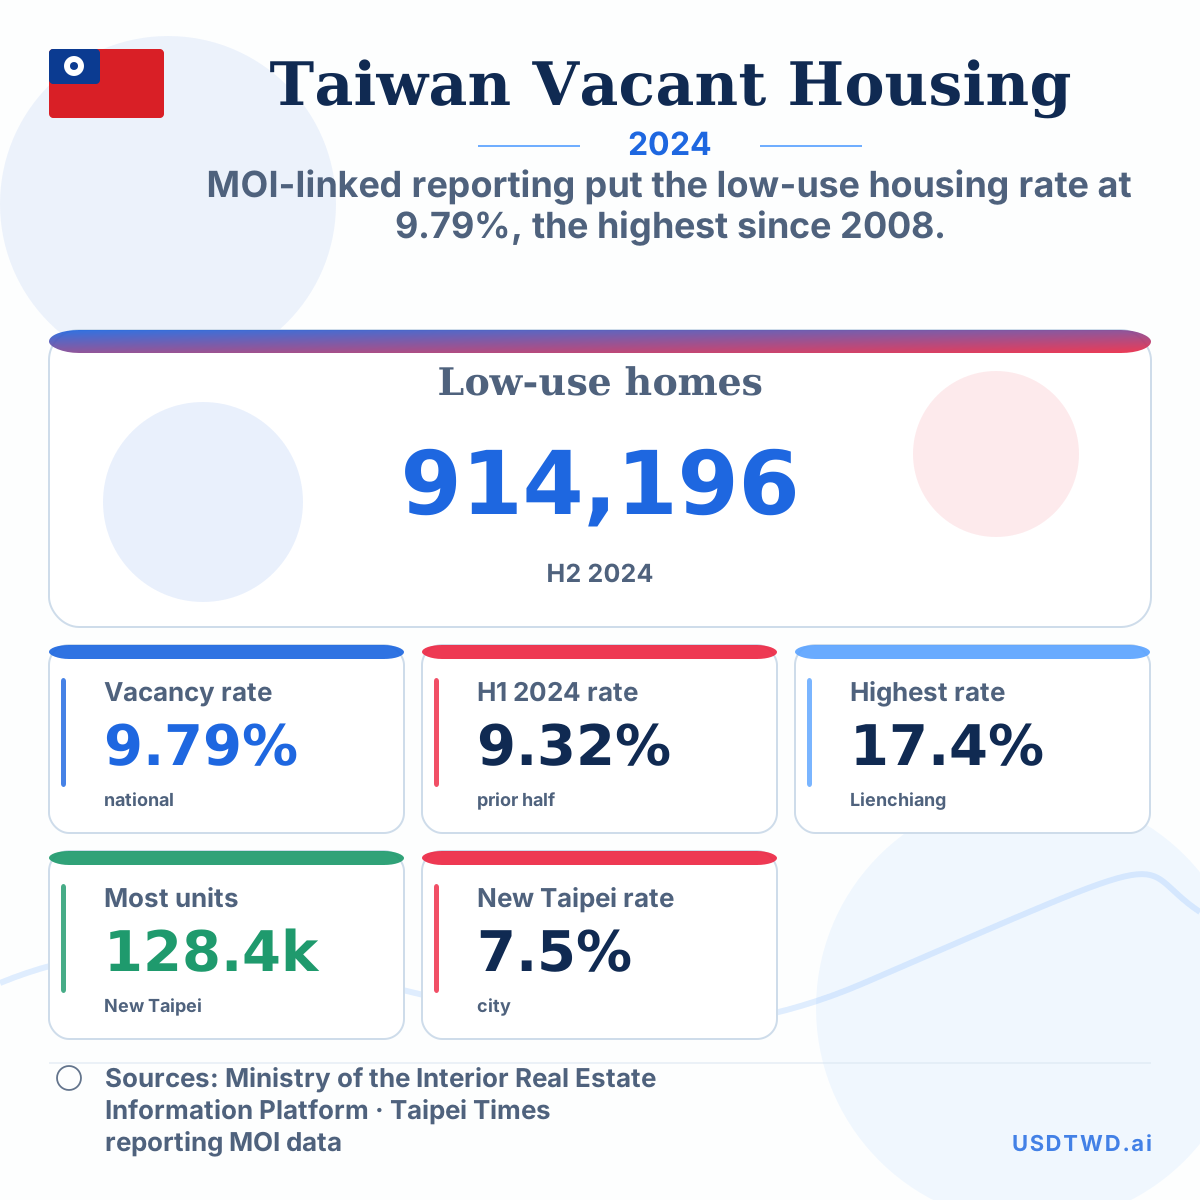
Taiwan Had 914,196 Low-Use Homes in the Second Half of 2024
MOI-linked reporting put the low-use housing rate at 9.79%, the highest since 2008.
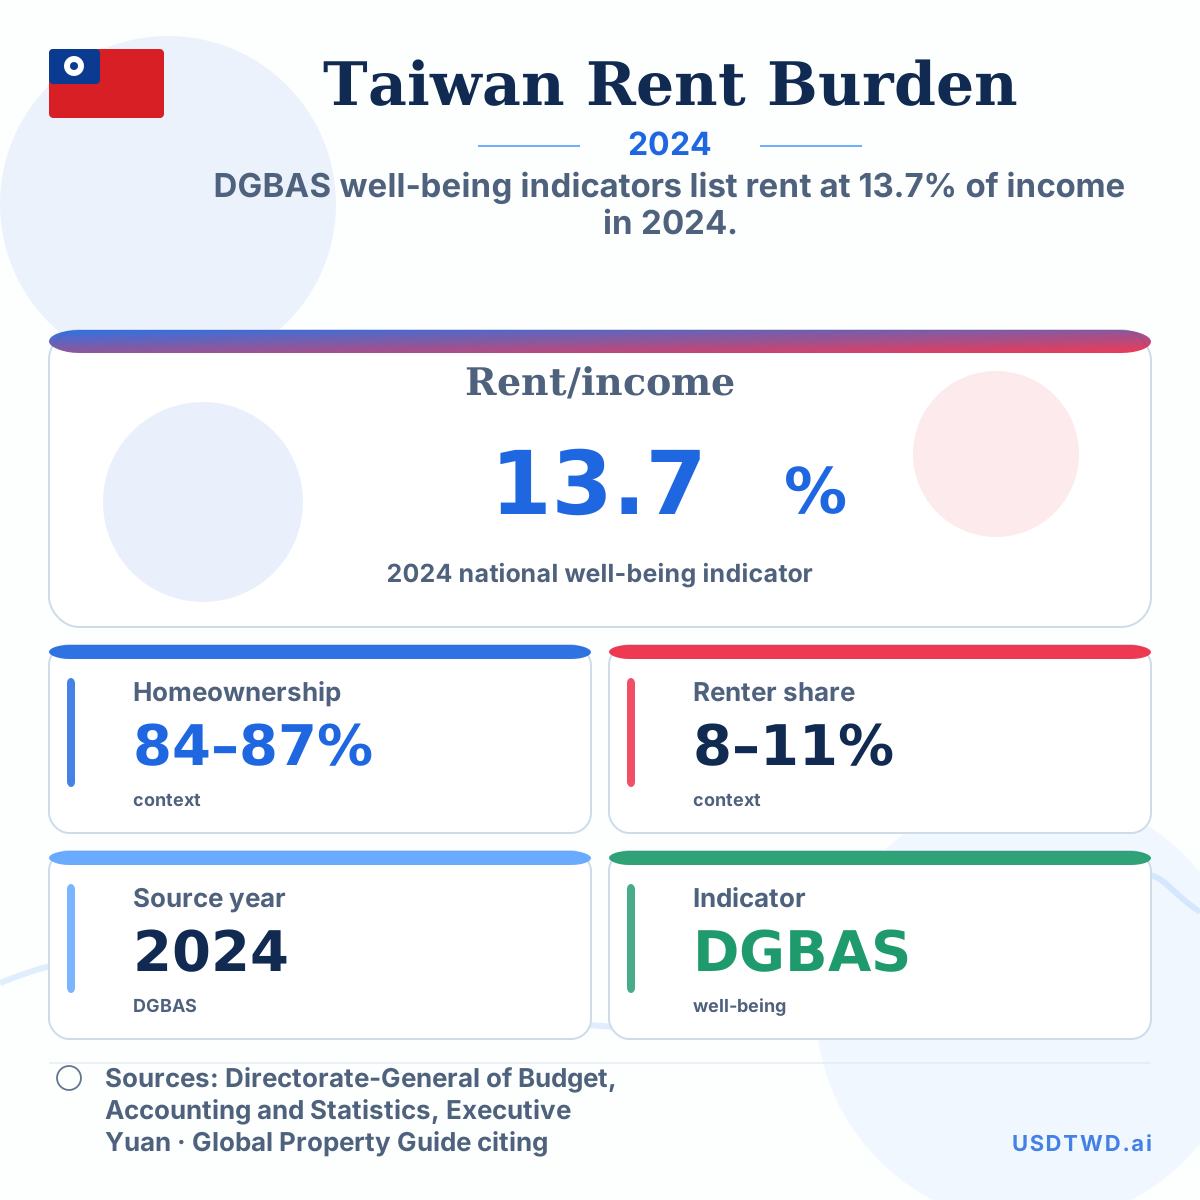
Taiwan’s National Rent-to-Income Ratio Was 13.7% in 2024
DGBAS well-being indicators list rent at 13.7% of income in 2024.
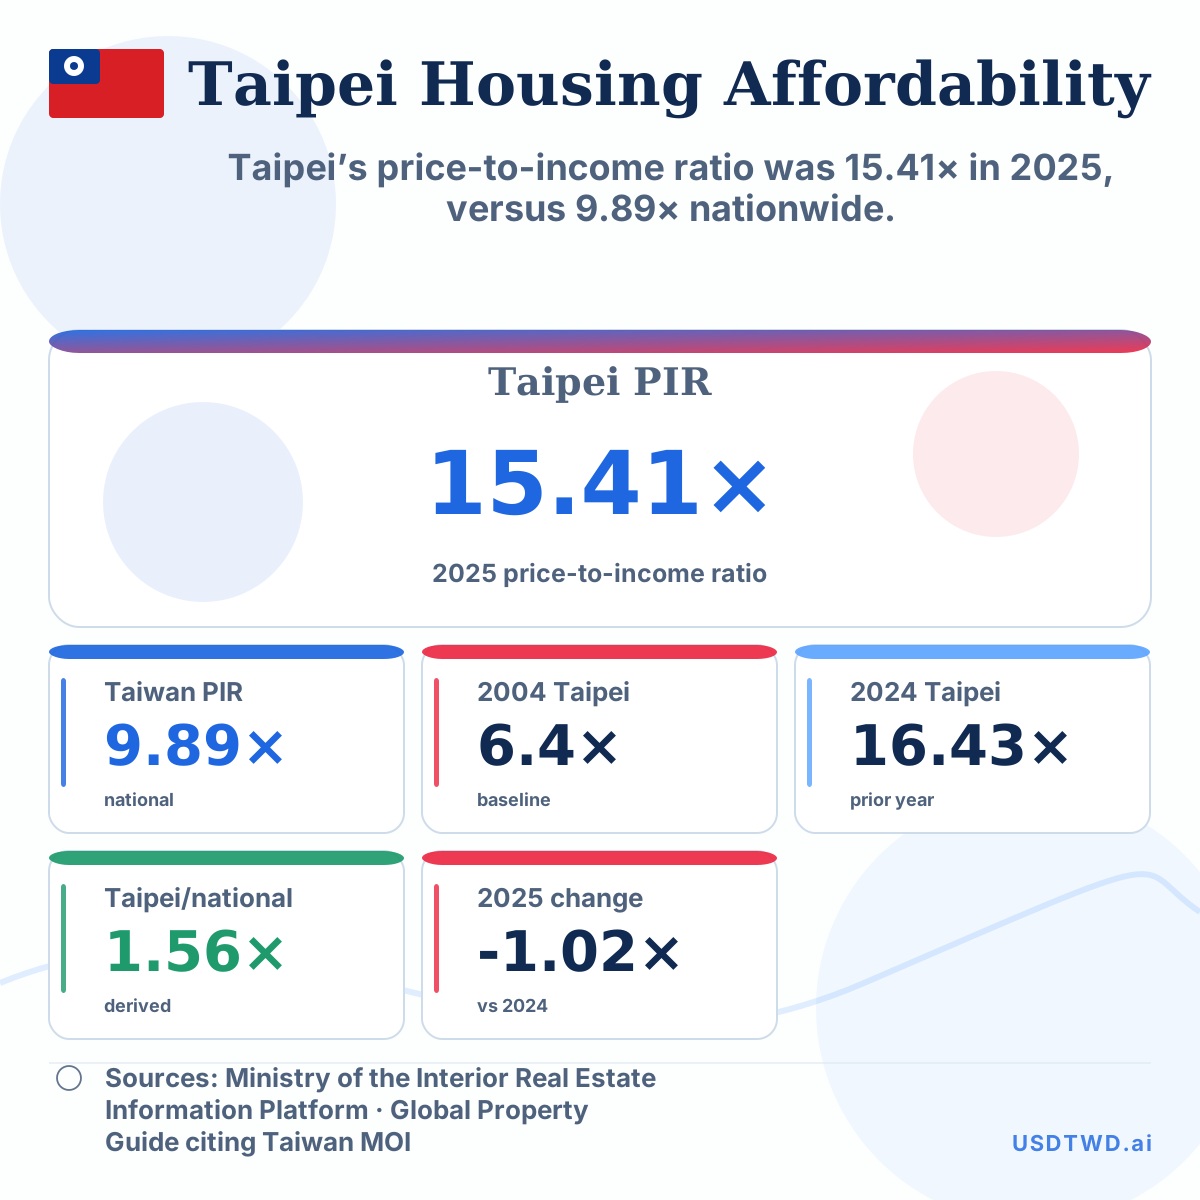
Taipei’s House Price-to-Income Ratio Was 15.41× in 2025
Taipei’s price-to-income ratio was 15.41× in 2025, versus 9.89× nationwide.
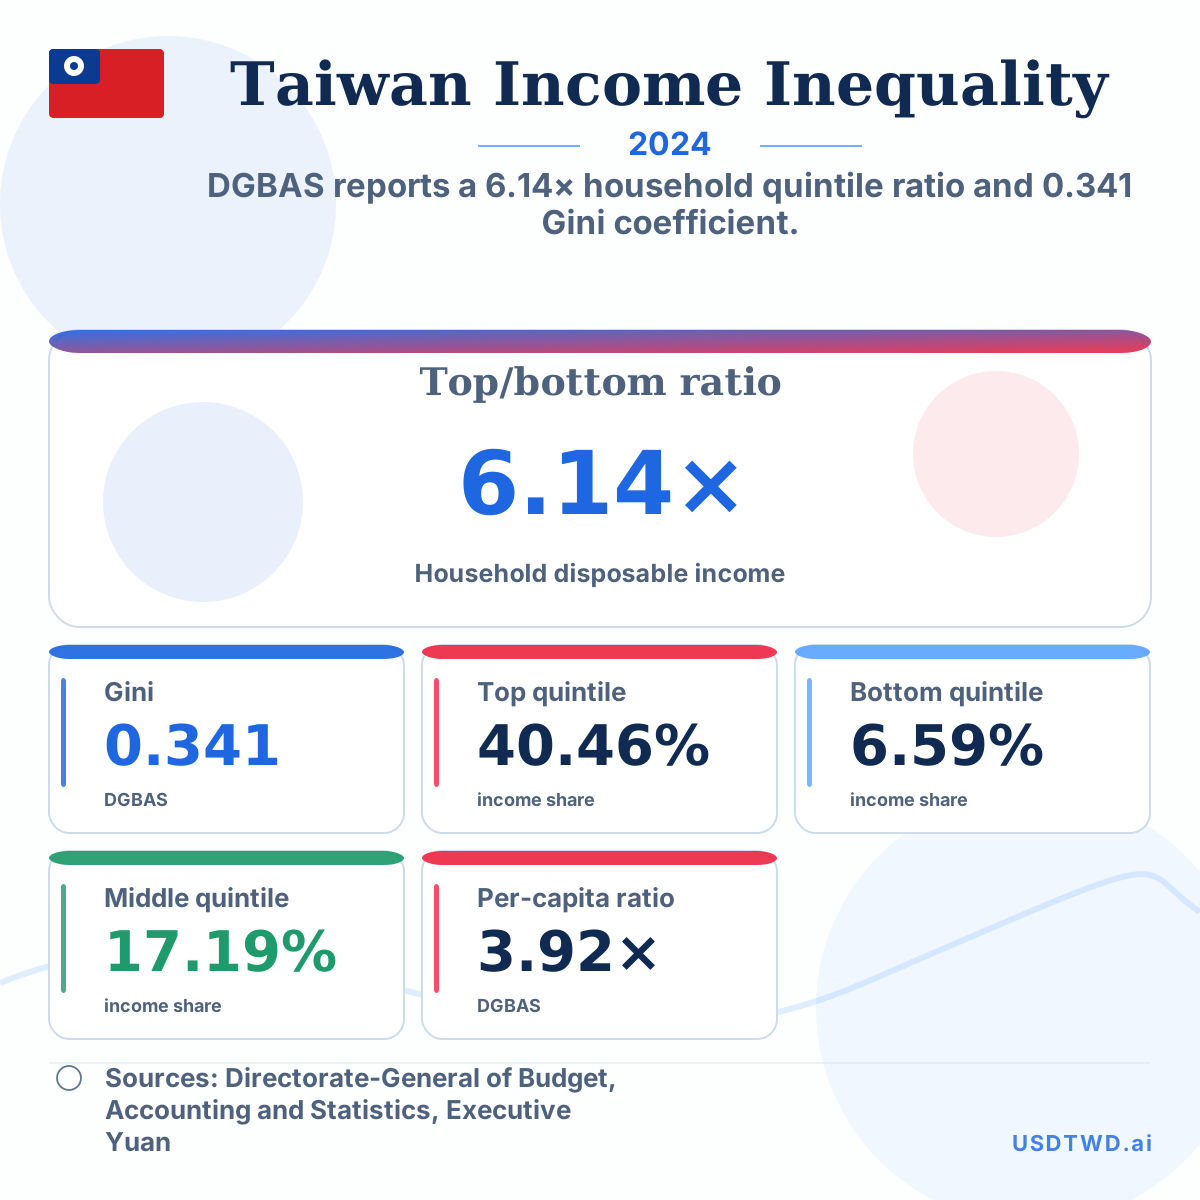
Taiwan’s Top-to-Bottom Household Income Ratio Was 6.14× in 2024
DGBAS reports a 6.14× household quintile ratio and 0.341 Gini coefficient.
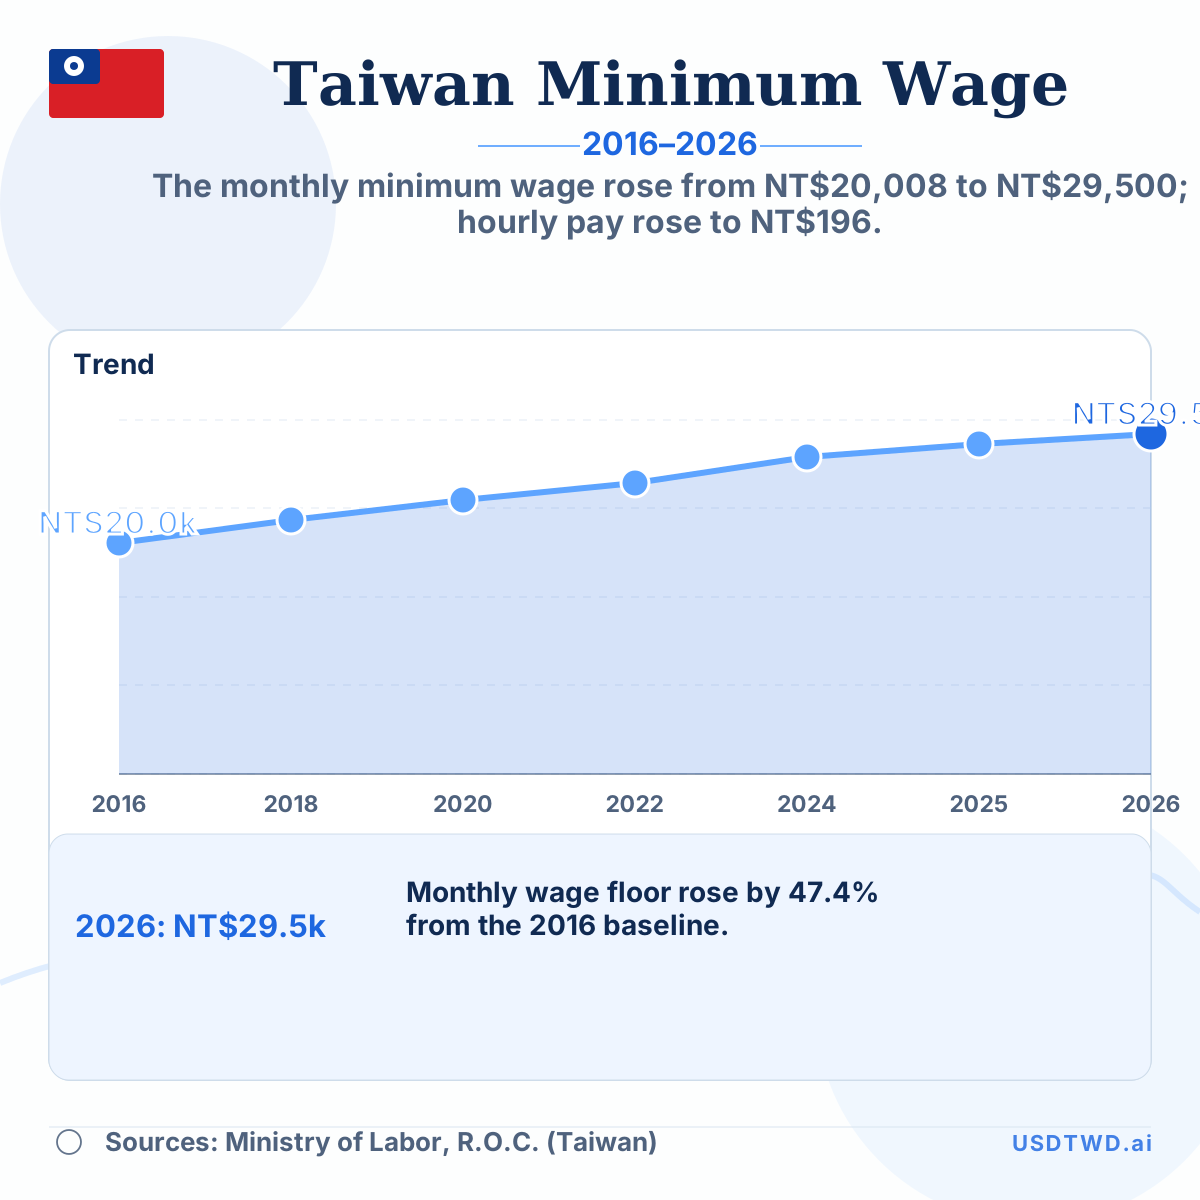
Taiwan Minimum Wage Rose 47.4% from 2016 to 2026
The monthly minimum wage rose from NT$20,008 to NT$29,500; hourly pay rose to NT$196.