
Stock Market
Listed companies, market value, ETFs, capital-market structure and public-company scale.
Start with these Stock Market graphics
Representative pages with source notes, methodology and reusable image variants.
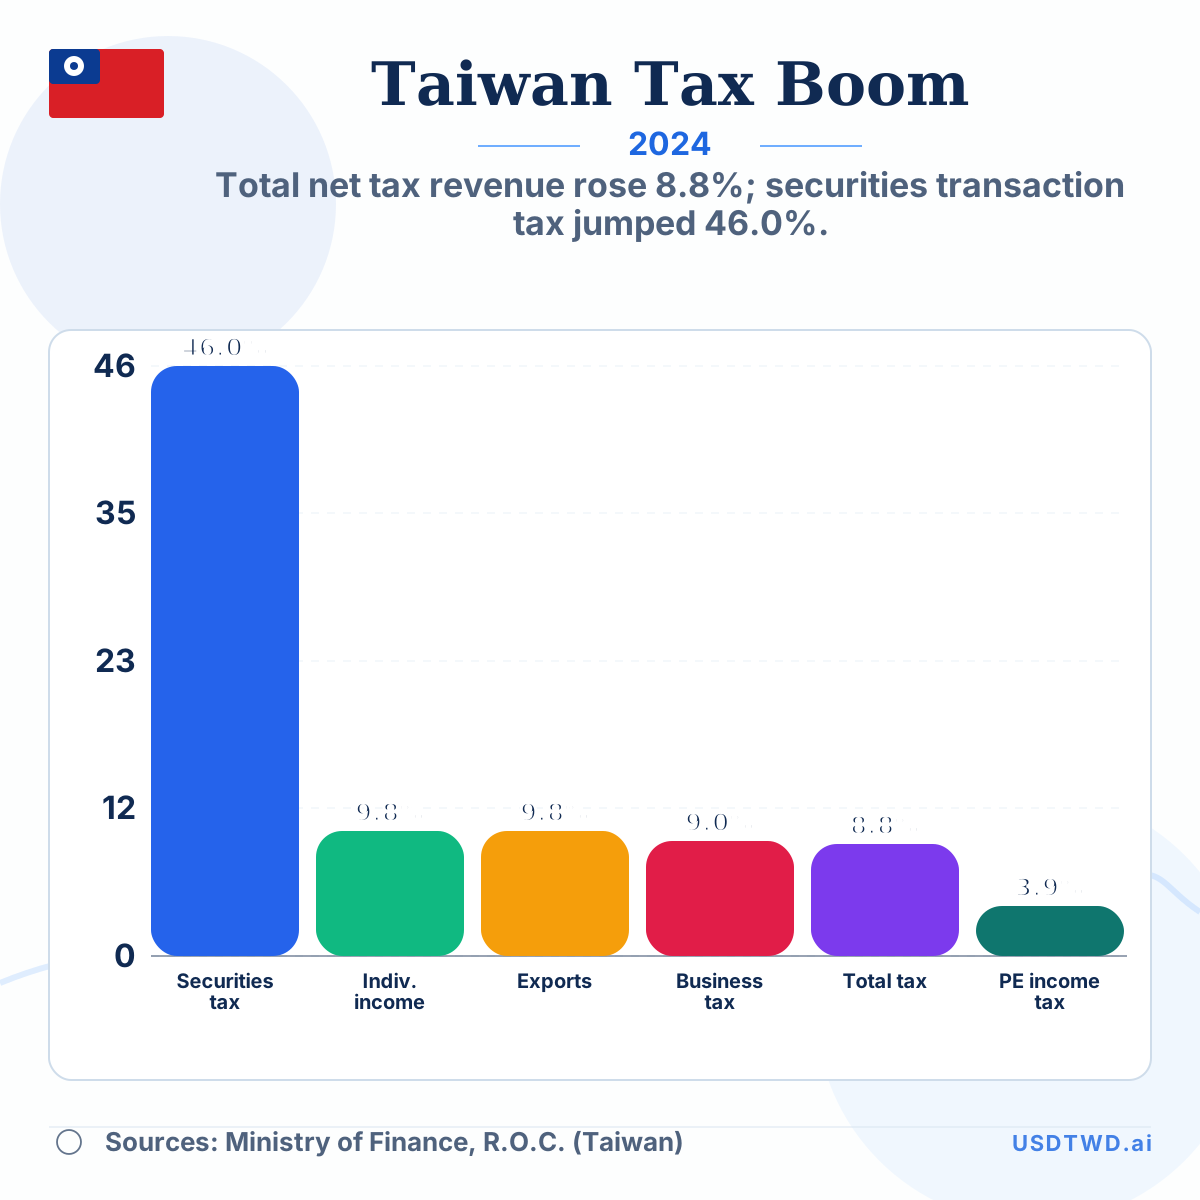 Taiwan Tax Revenue versus the 2024 Export BoomTotal net tax revenue rose 8.8%; securities transaction tax jumped…
Featured
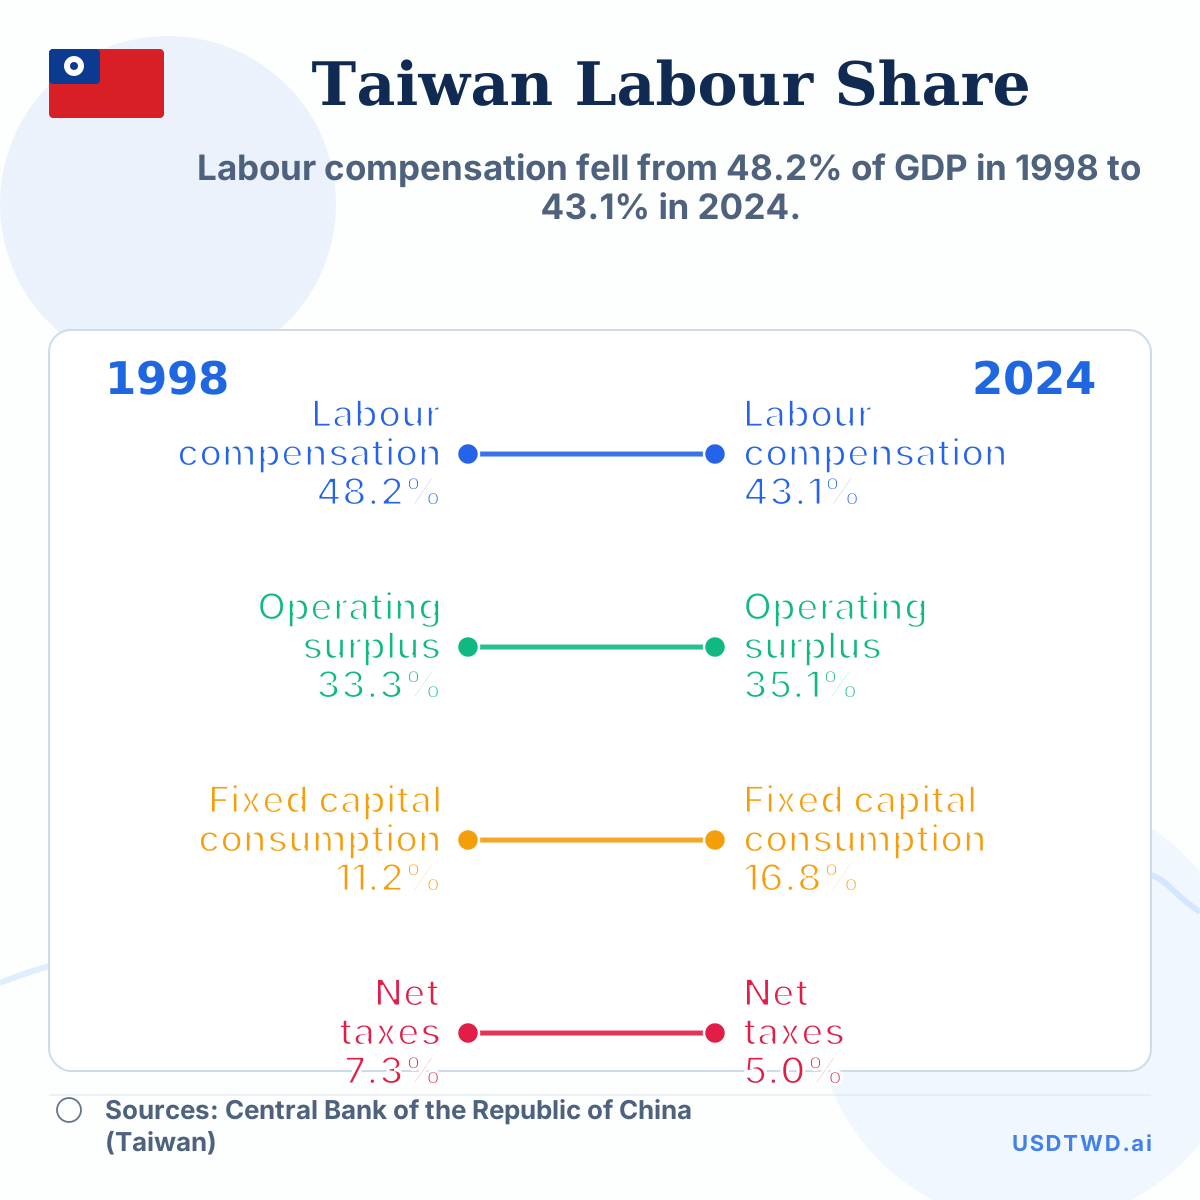 Taiwan Labour Compensation Share vs Operating Surplus, 1998–2024Labour compensation fell from 48.2% of GDP in 1998 to…
Featured
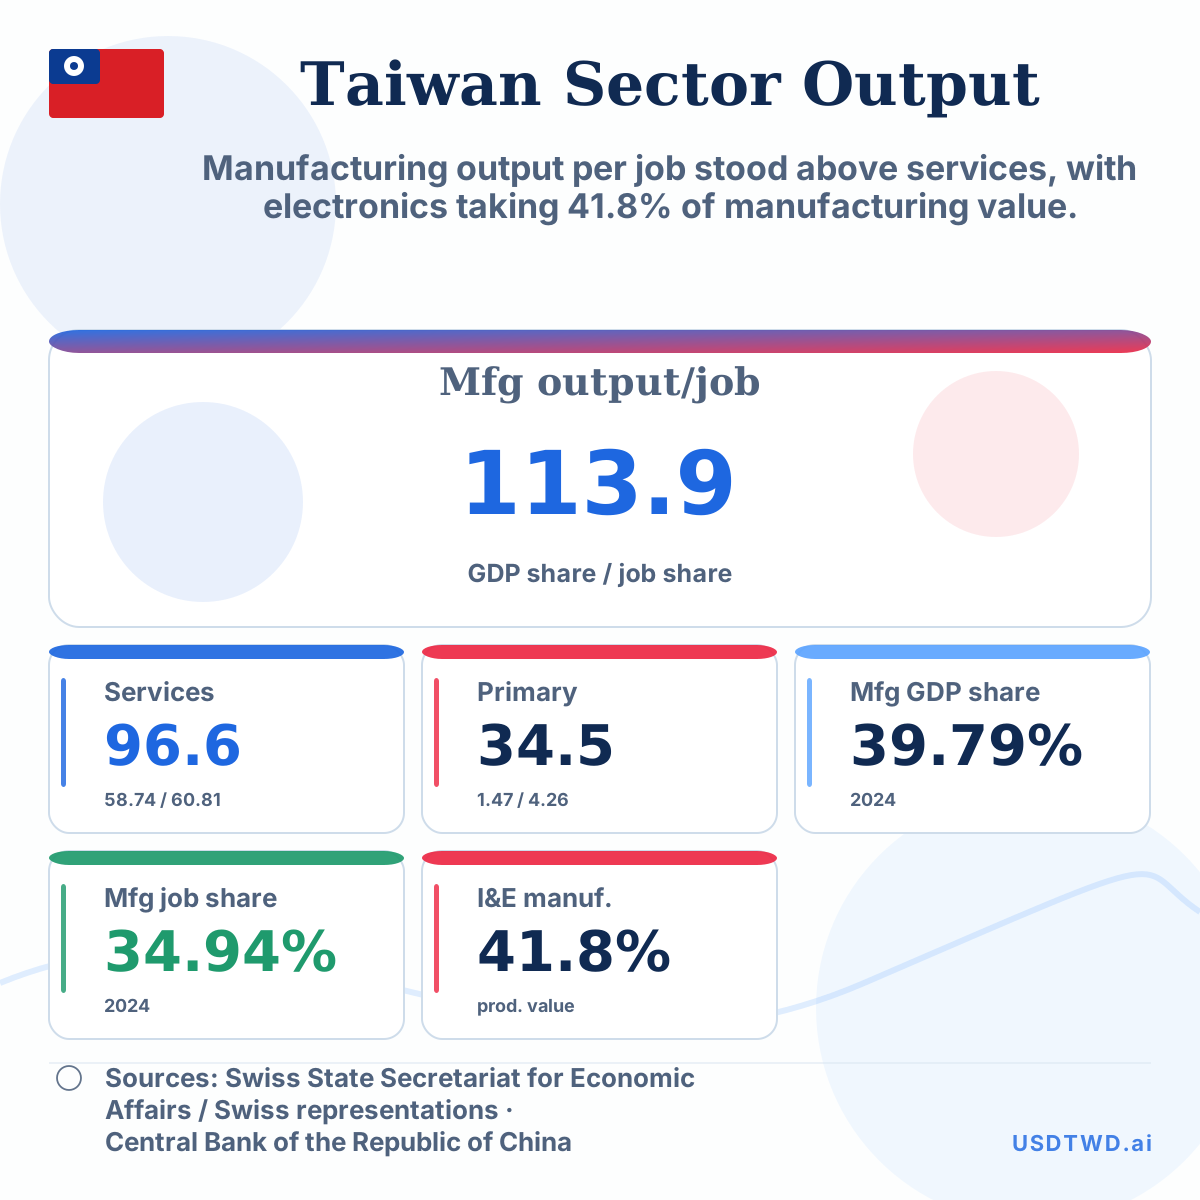 Taiwan Sector Output per Worker, 2024Manufacturing output per job stood above services, with electronics taking…
Taiwan Tax Revenue versus the 2024 Export Boom
Total net tax revenue rose 8.8%; securities transaction tax jumped 46.0%.
Taiwan Labour Compensation Share vs Operating Surplus, 1998–2024
Labour compensation fell from 48.2% of GDP in 1998 to 43.1% in 2024.
Taiwan Sector Output per Worker, 2024
Manufacturing output per job stood above services, with electronics taking 41.8% of manufacturing value.
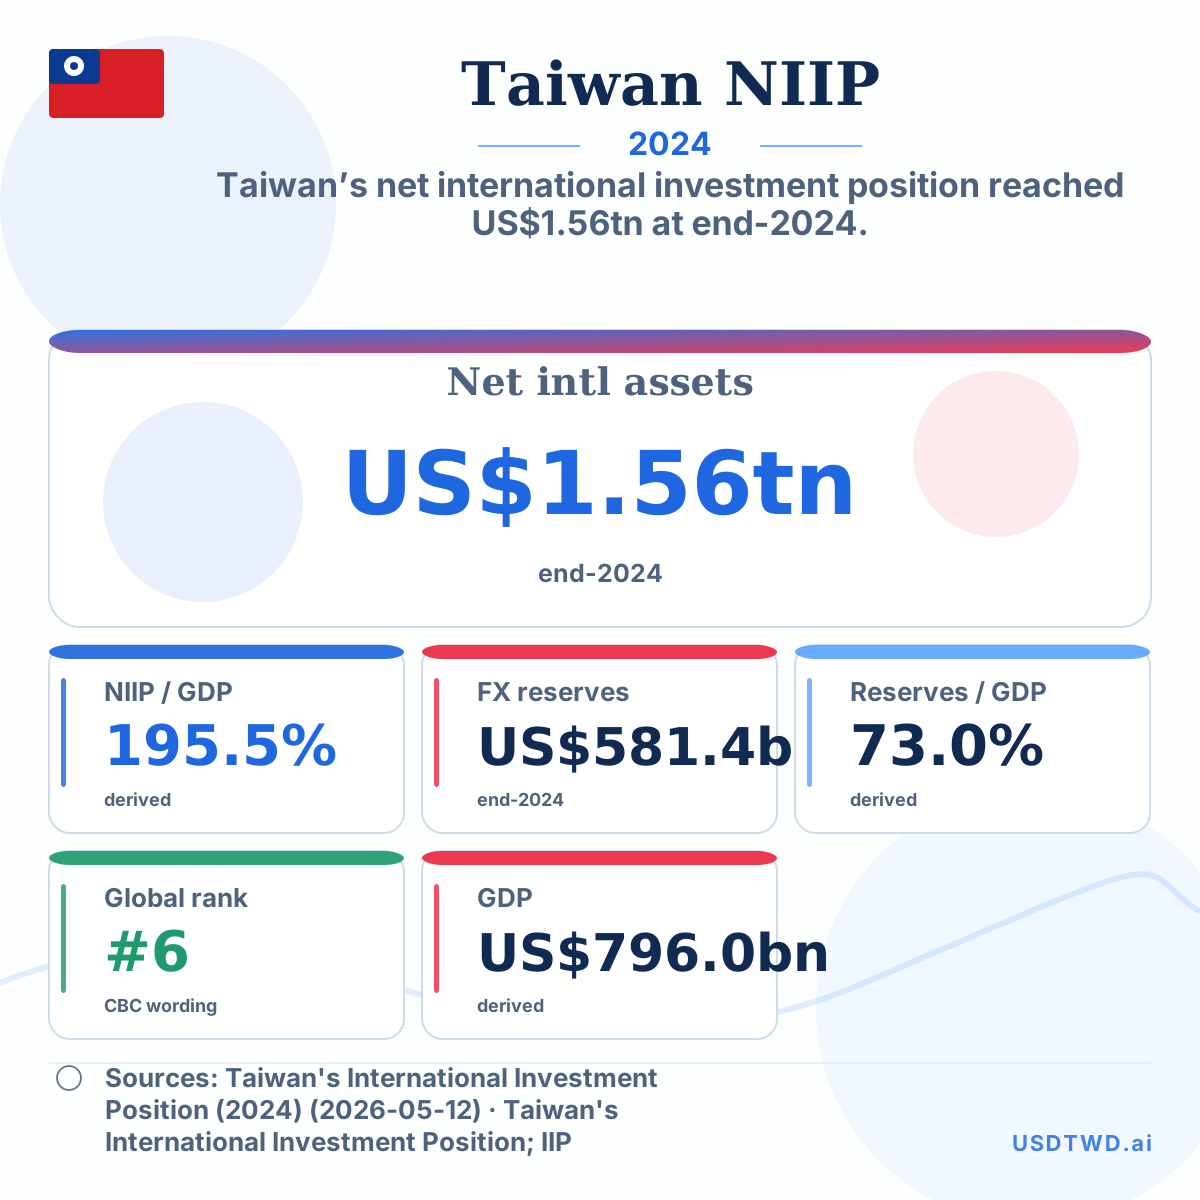
Taiwan Net International Assets vs GDP, 2024
Taiwan’s net international investment position reached US$1.56tn at end-2024.
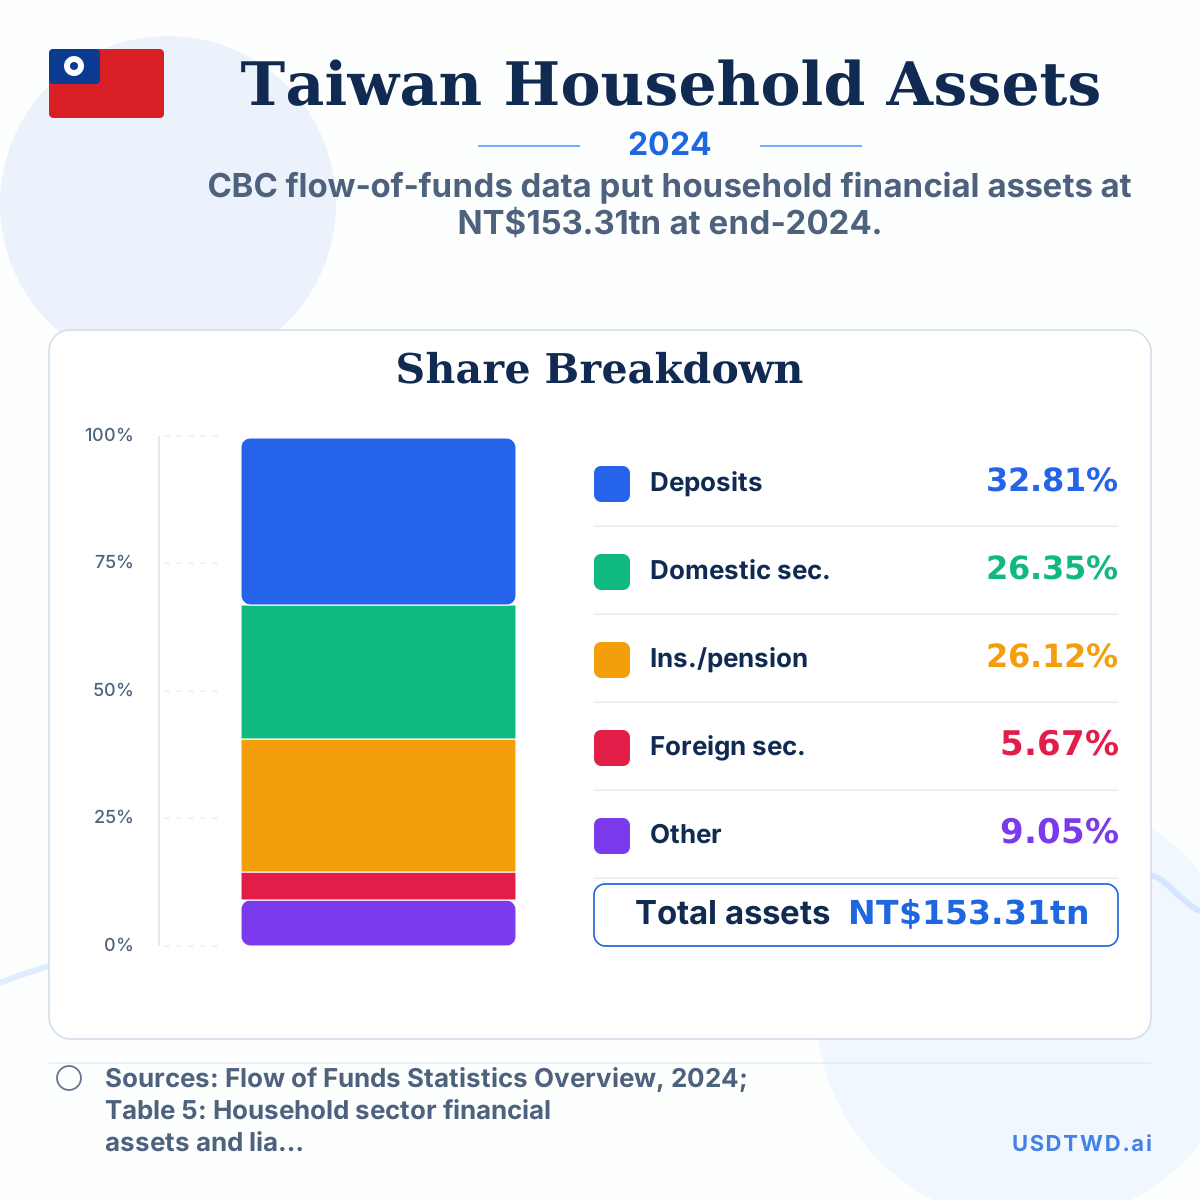
Taiwan household financial assets by category, 2024
CBC flow-of-funds data put household financial assets at NT$153.31tn at end-2024.
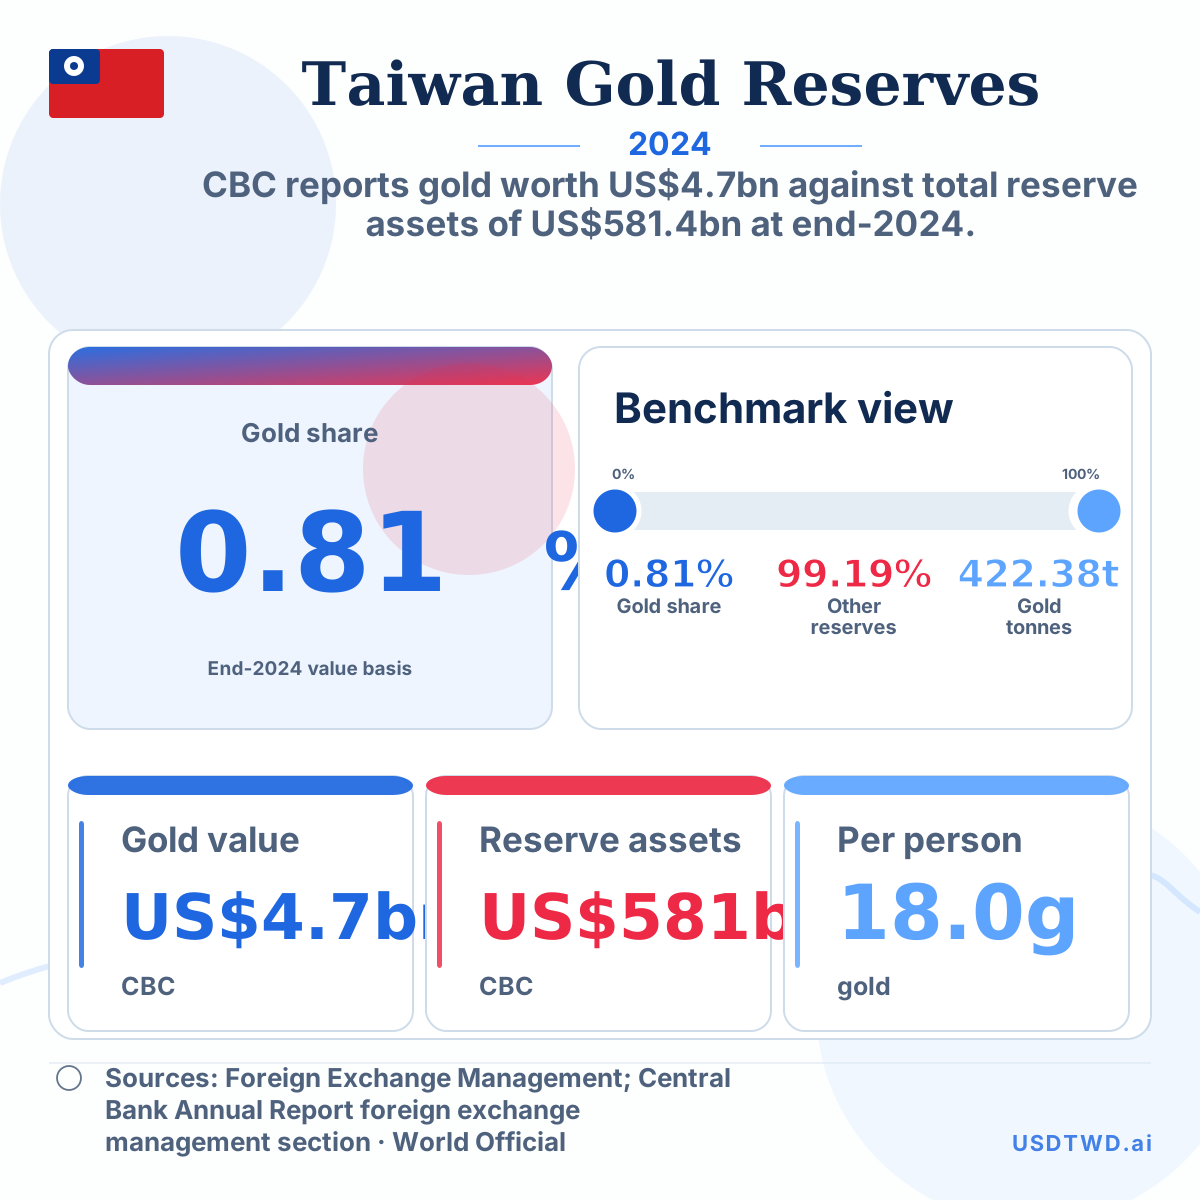
Taiwan central-bank gold reserves versus reserve assets, 2024
CBC reports gold worth US$4.7bn against total reserve assets of US$581.4bn at end-2024.
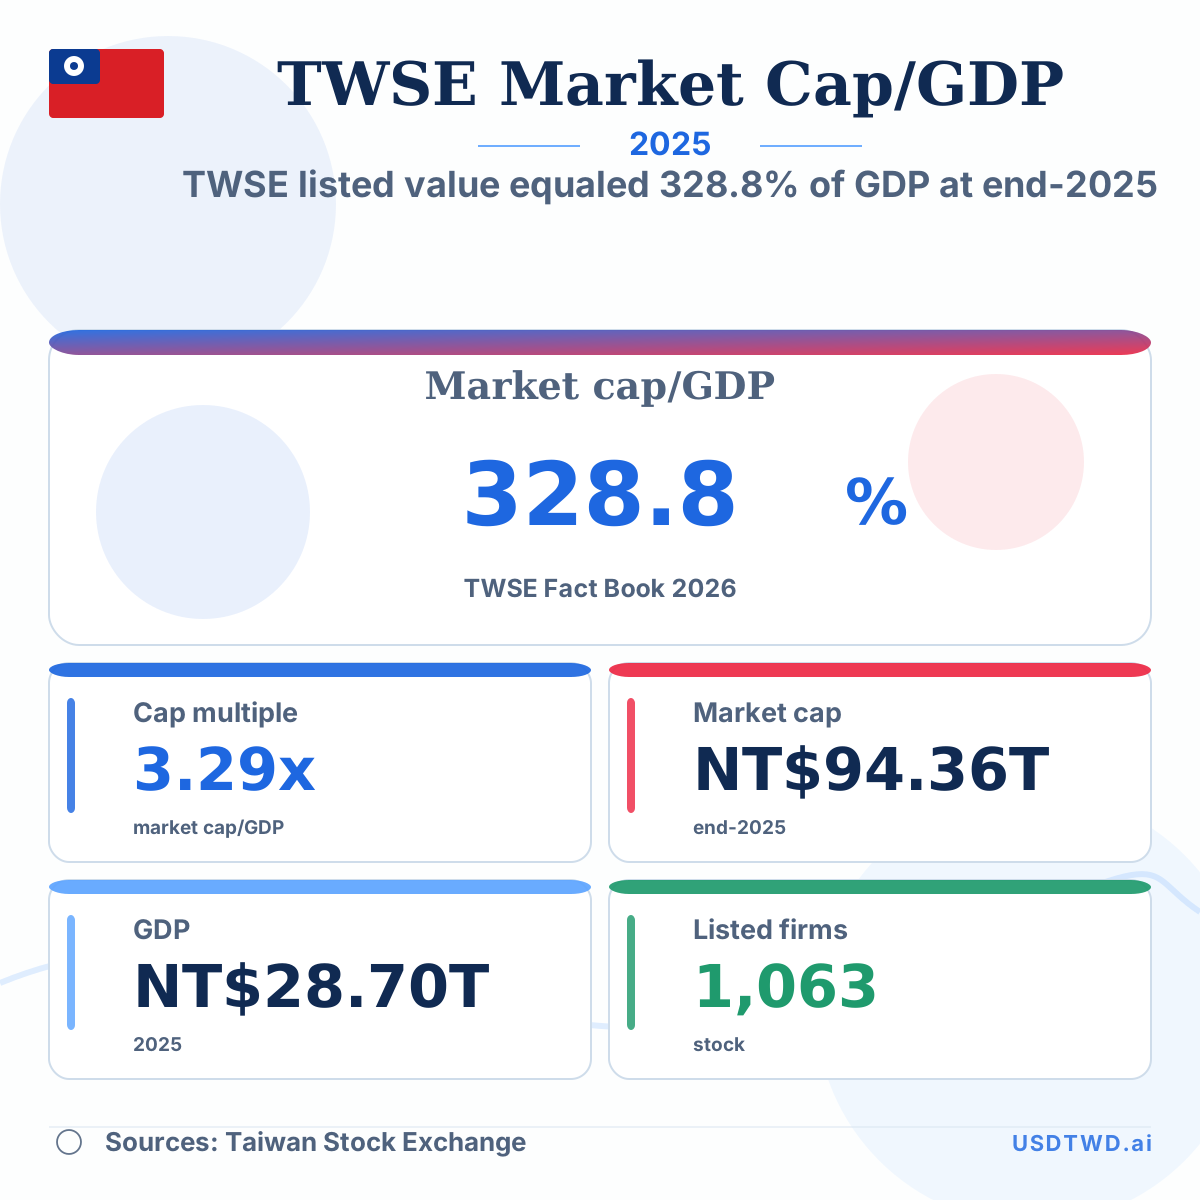
Taiwan Listed Market Cap Was 328.8% of GDP in 2025
TWSE listed value equaled 328.8% of GDP at end-2025
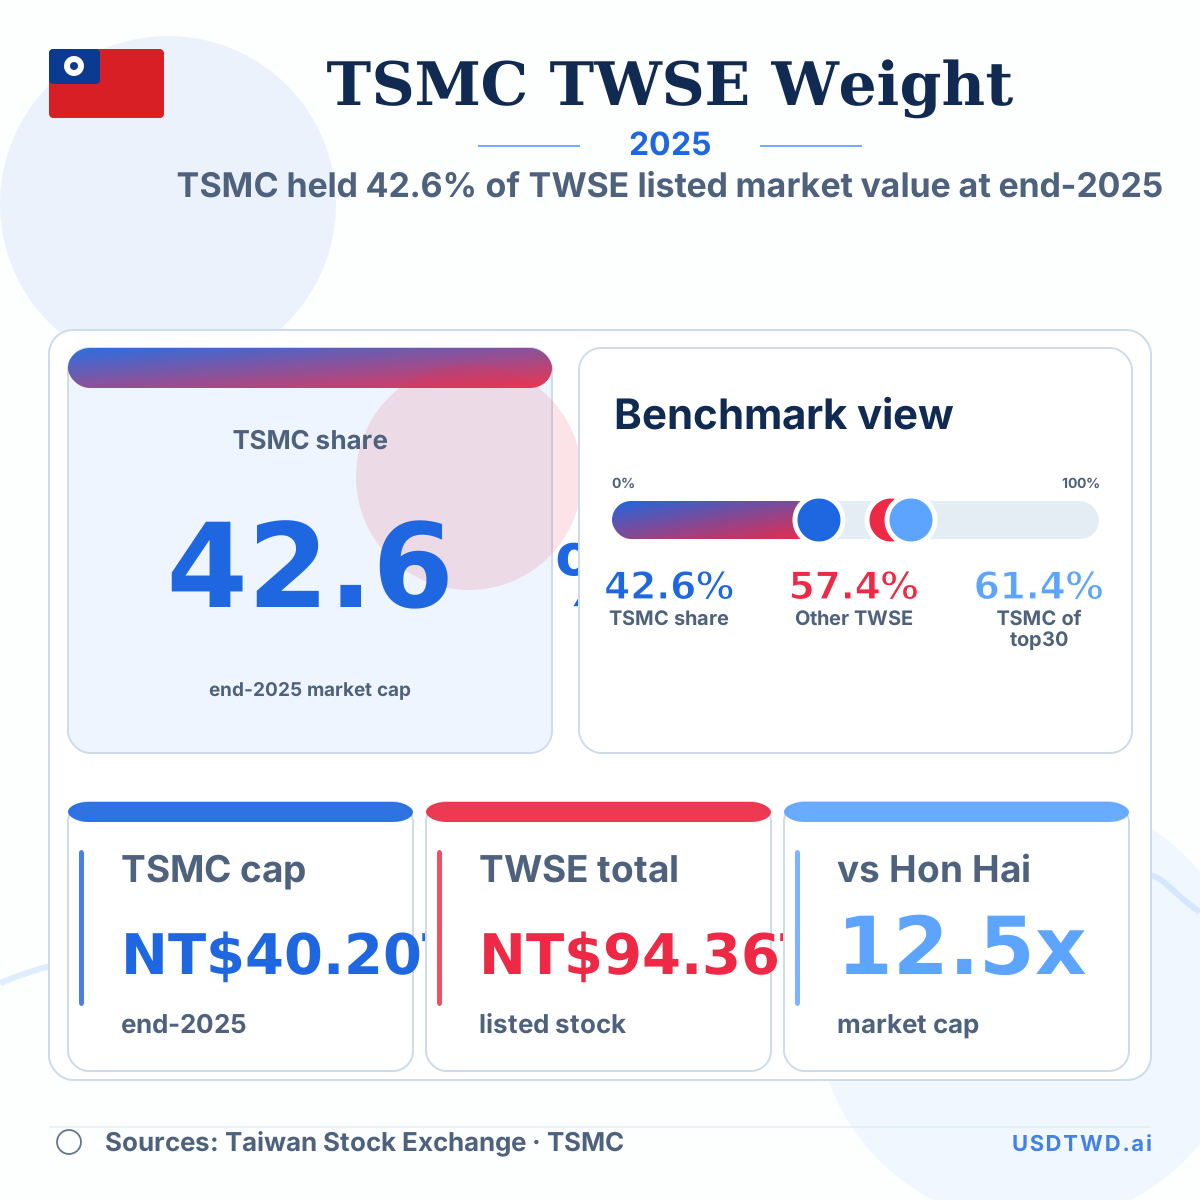
TSMC Was 42.6% of TWSE Listed Market Value in 2025
TSMC held 42.6% of TWSE listed market value at end-2025
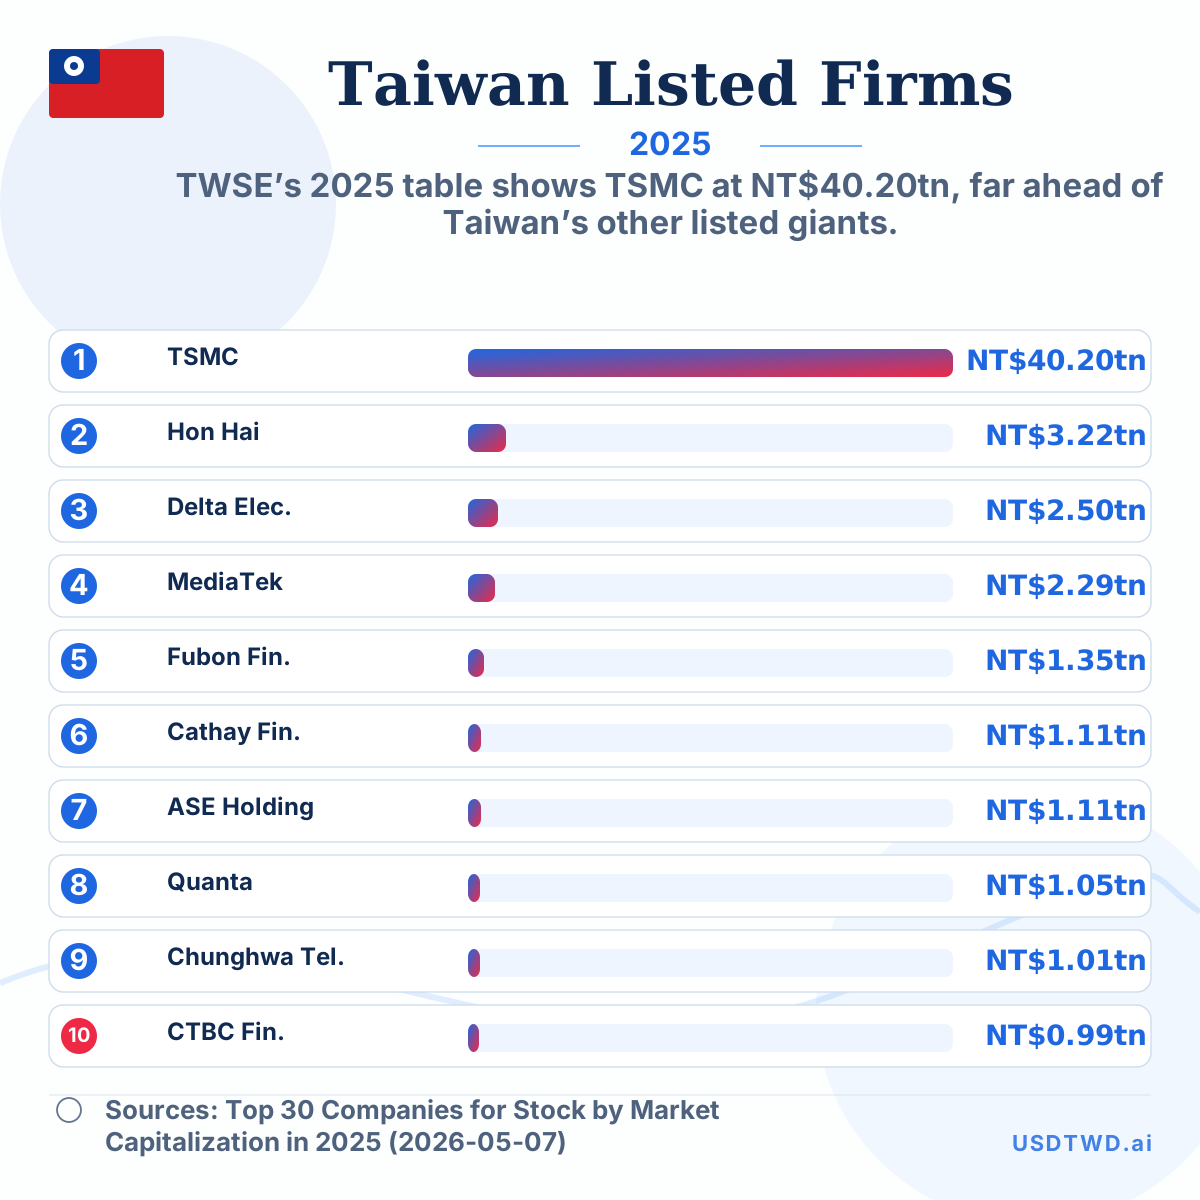
Taiwan’s top listed companies by market capitalization, 2025
TWSE’s 2025 table shows TSMC at NT$40.20tn, far ahead of Taiwan’s other listed giants.
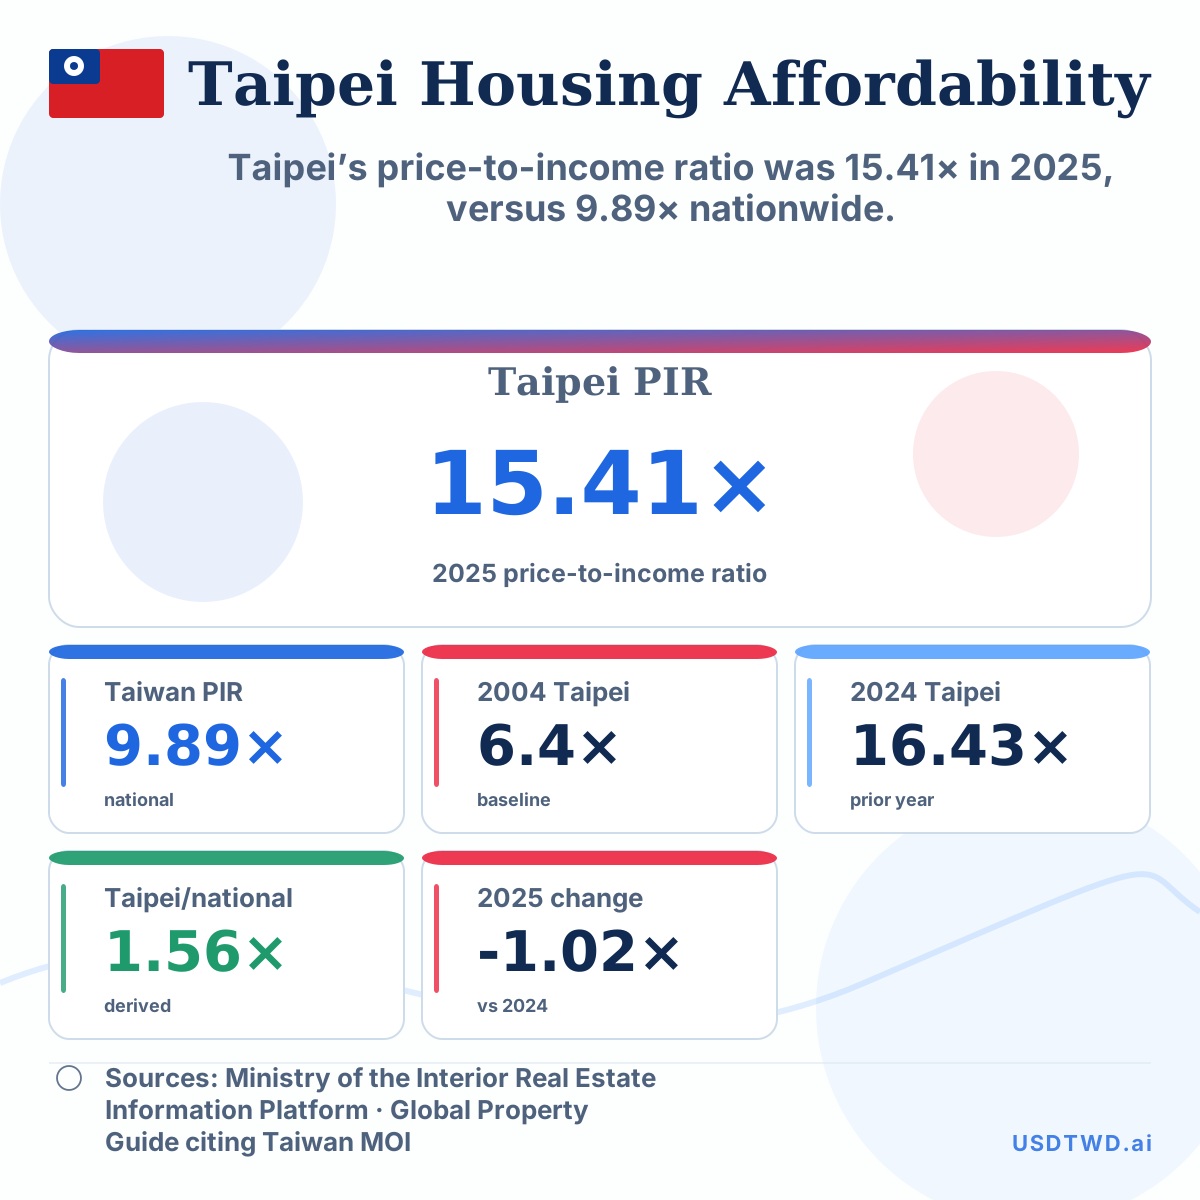
Taipei’s House Price-to-Income Ratio Was 15.41× in 2025
Taipei’s price-to-income ratio was 15.41× in 2025, versus 9.89× nationwide.
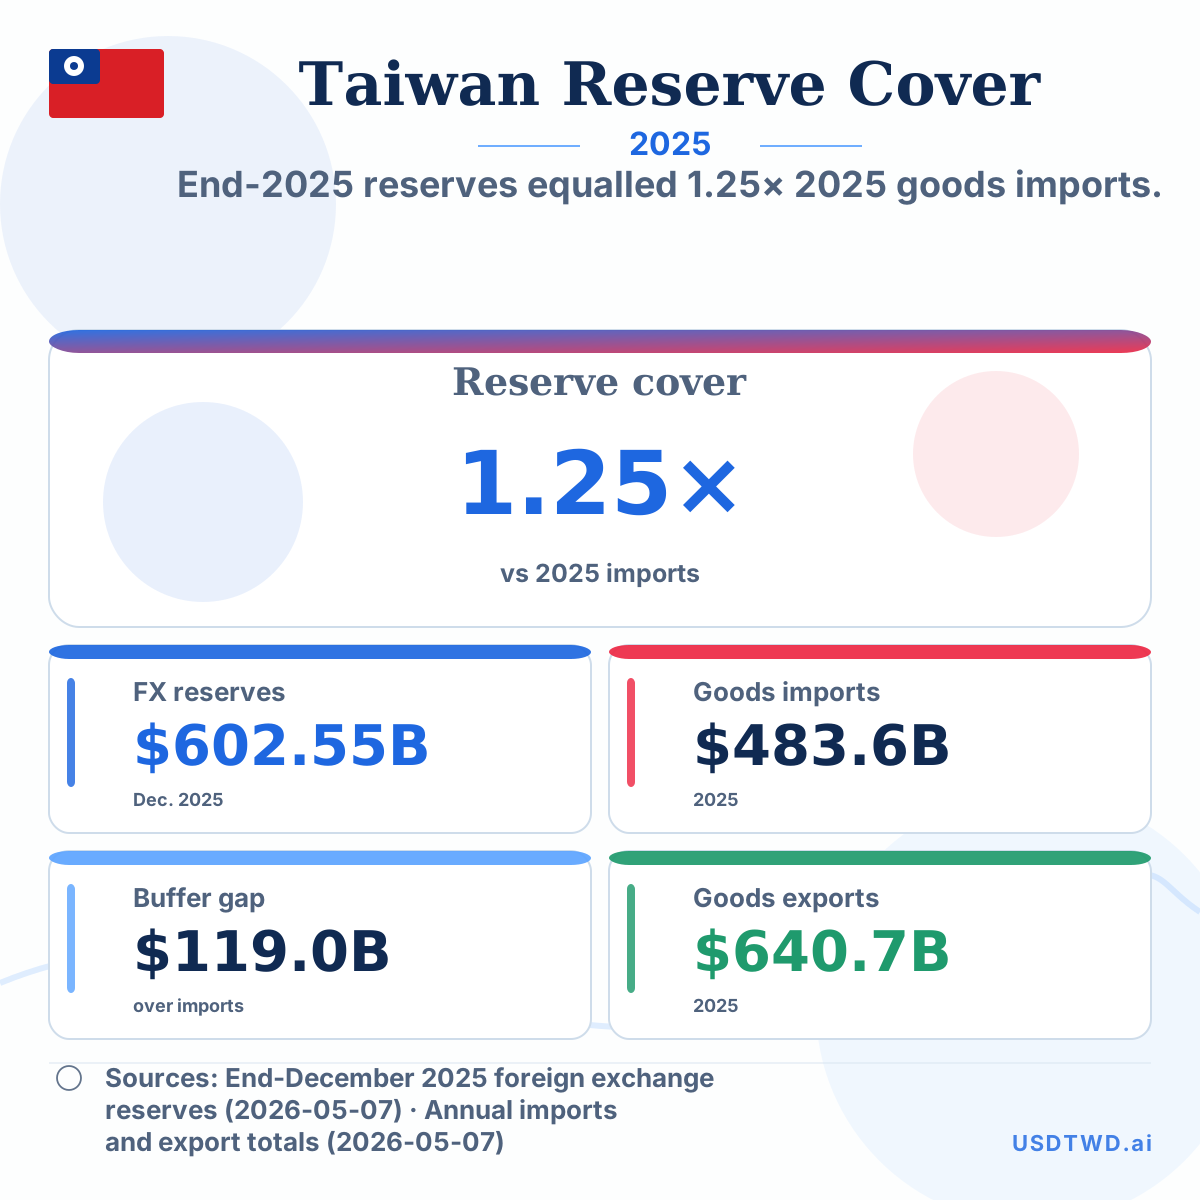
Taiwan FX reserves versus annual goods imports
End-2025 reserves equalled 1.25× 2025 goods imports.
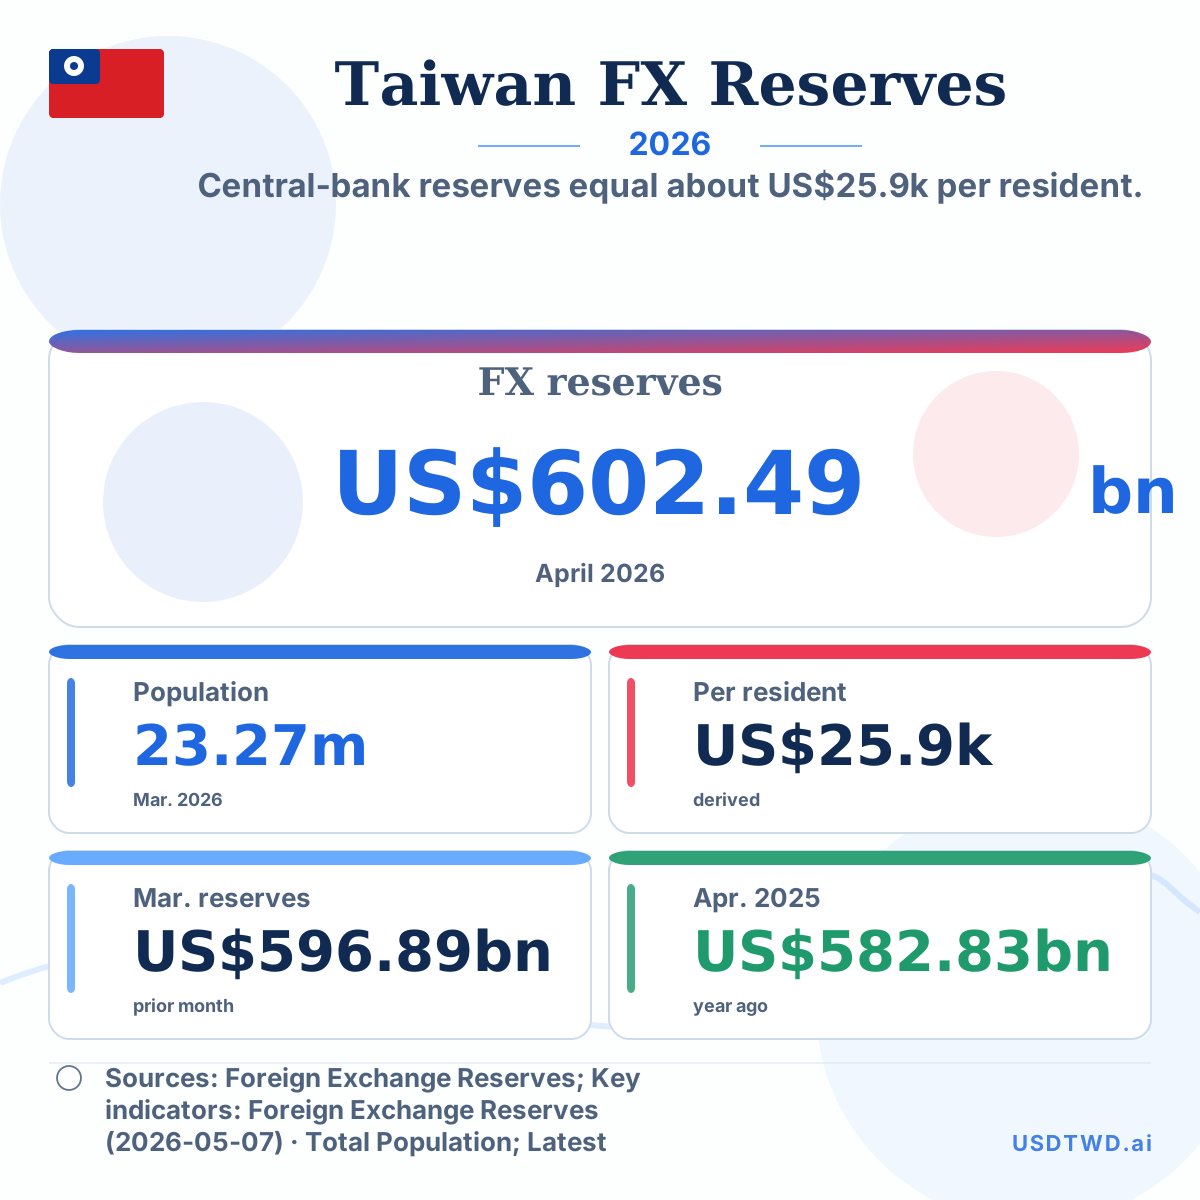
Taiwan held US$602.49bn of foreign exchange reserves in April 2026
Central-bank reserves equal about US$25.9k per resident.