
Economy
GDP, trade, productivity, wages, consumption, investment and the macro machinery behind Taiwan’s growth.
Start with these Economy graphics
Representative pages with source notes, methodology and reusable image variants.
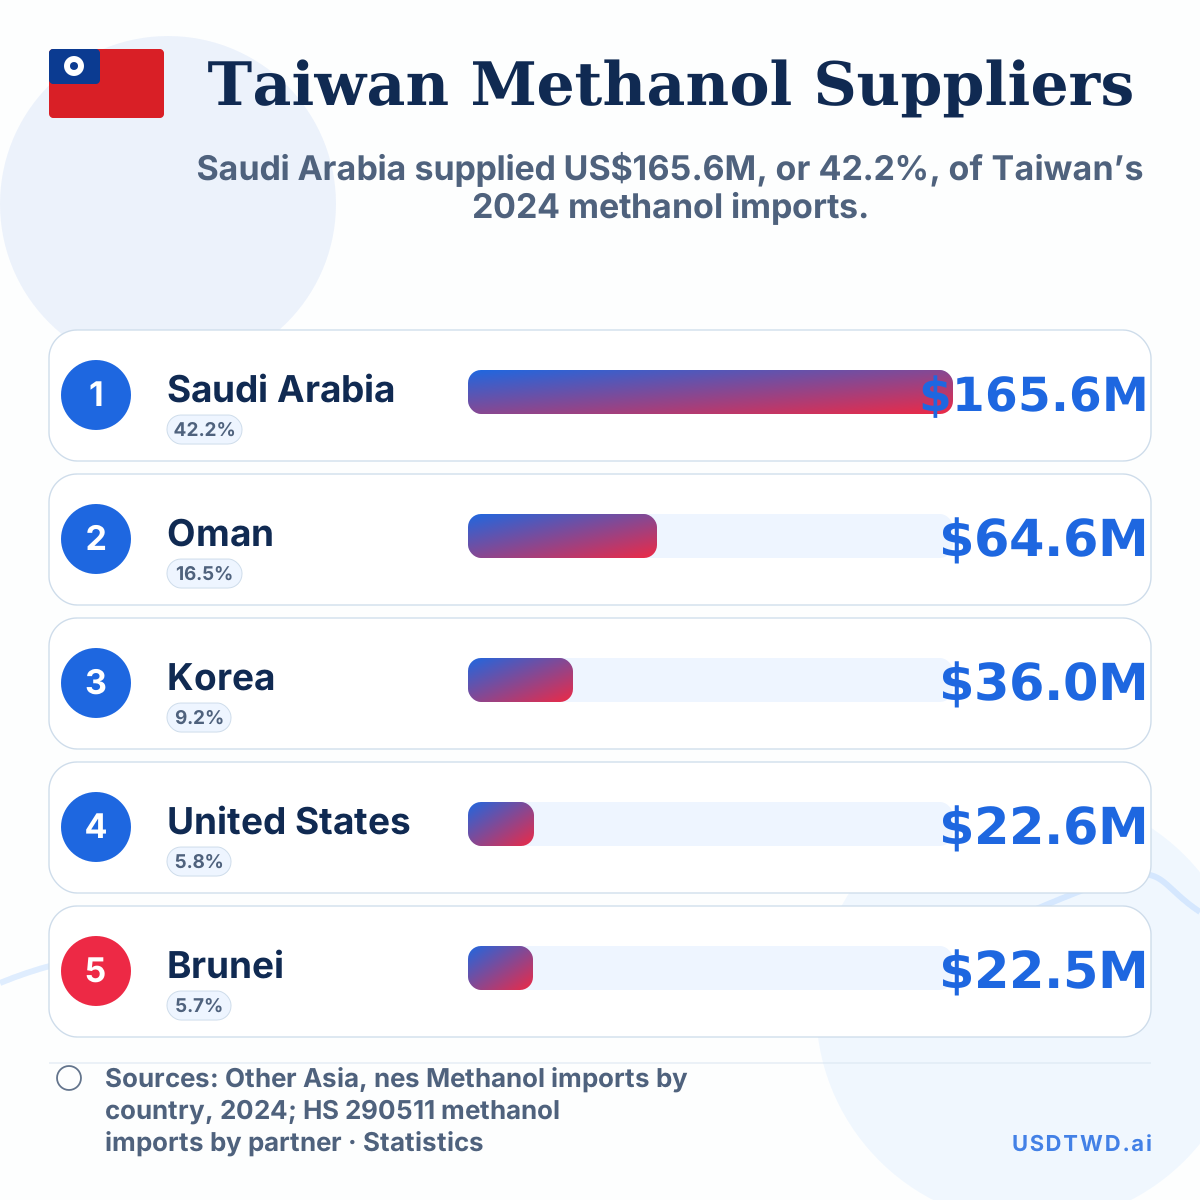 Taiwan’s 5 largest methanol suppliersSaudi Arabia supplied US$165.6M, or 42.2%, of Taiwan’s 2024 methanol…
Featured
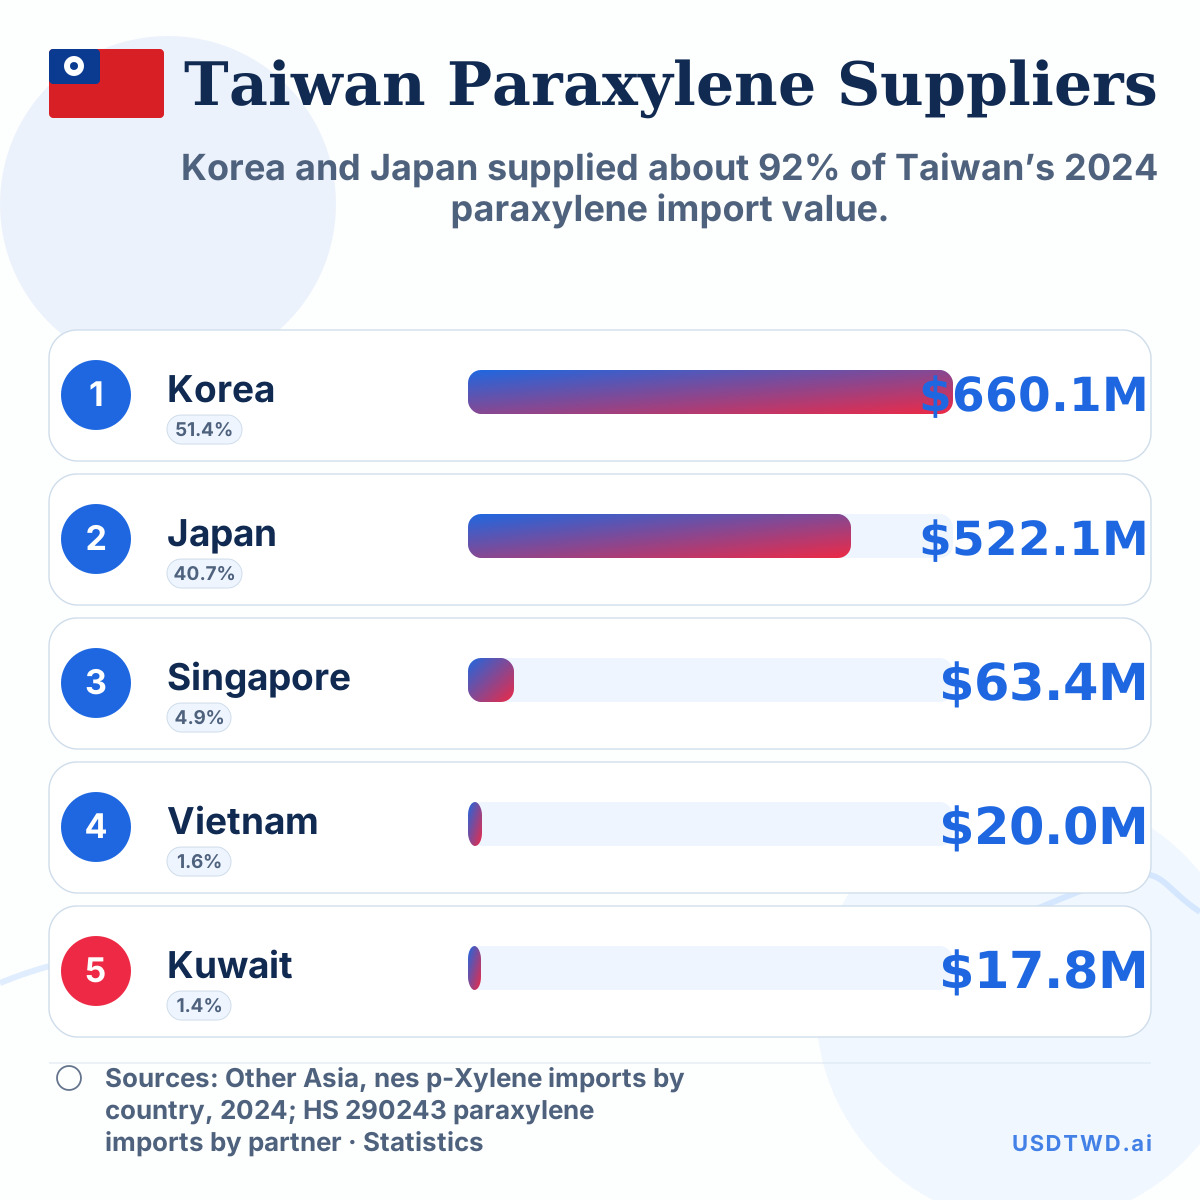 Taiwan’s 5 largest paraxylene suppliersKorea and Japan supplied about 92% of Taiwan’s 2024 paraxylene…
Featured
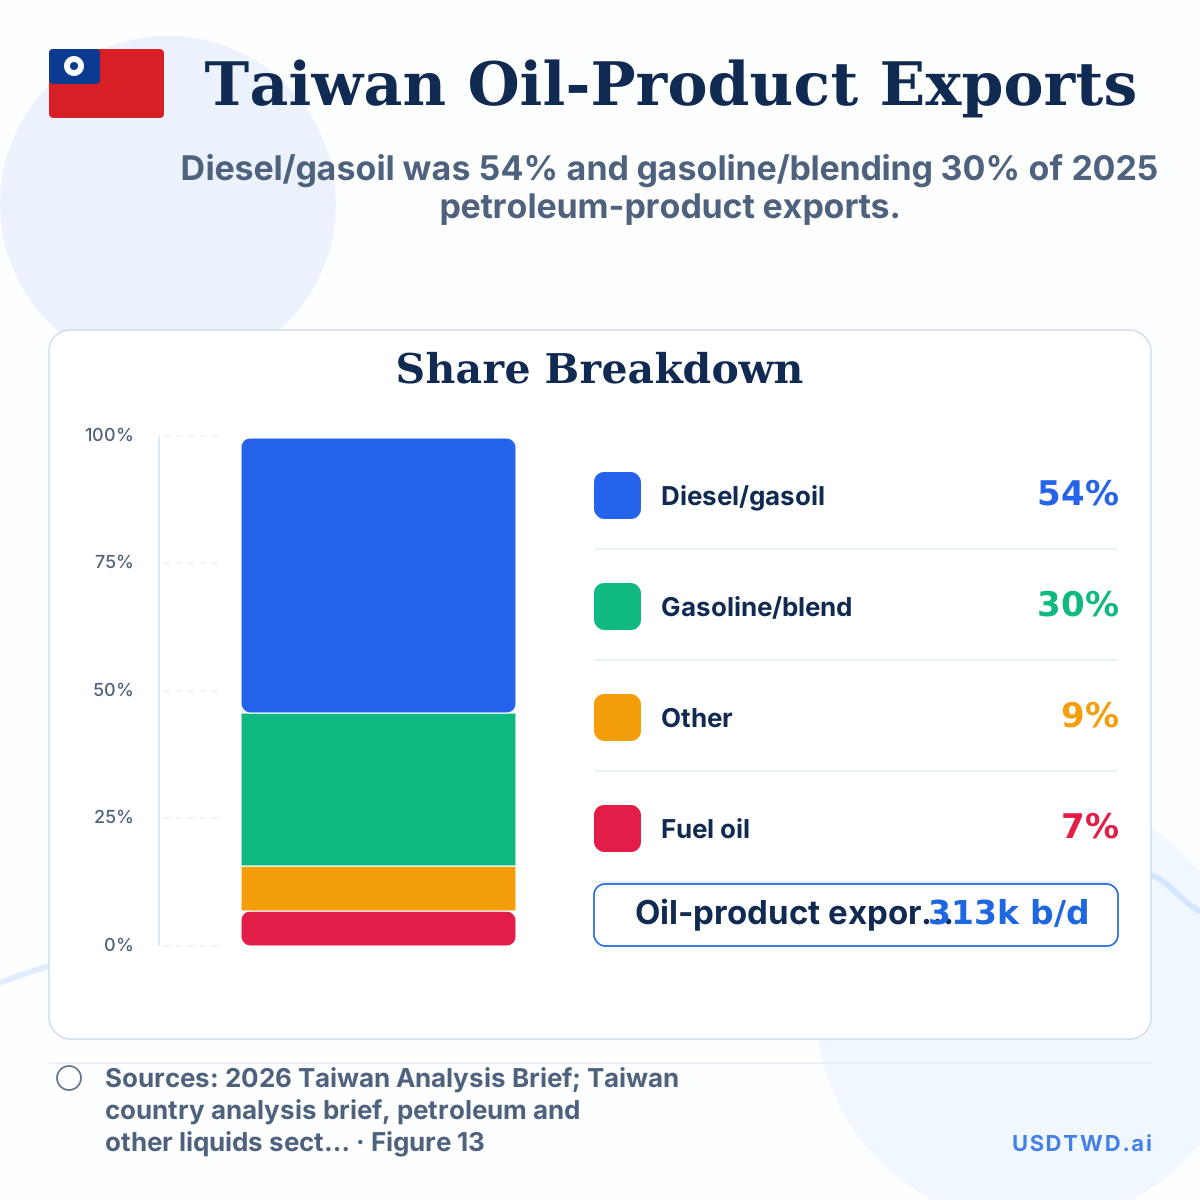 Taiwan petroleum-product exports by typeDiesel/gasoil was 54% and gasoline/blending 30% of 2025 petroleum-product exports.
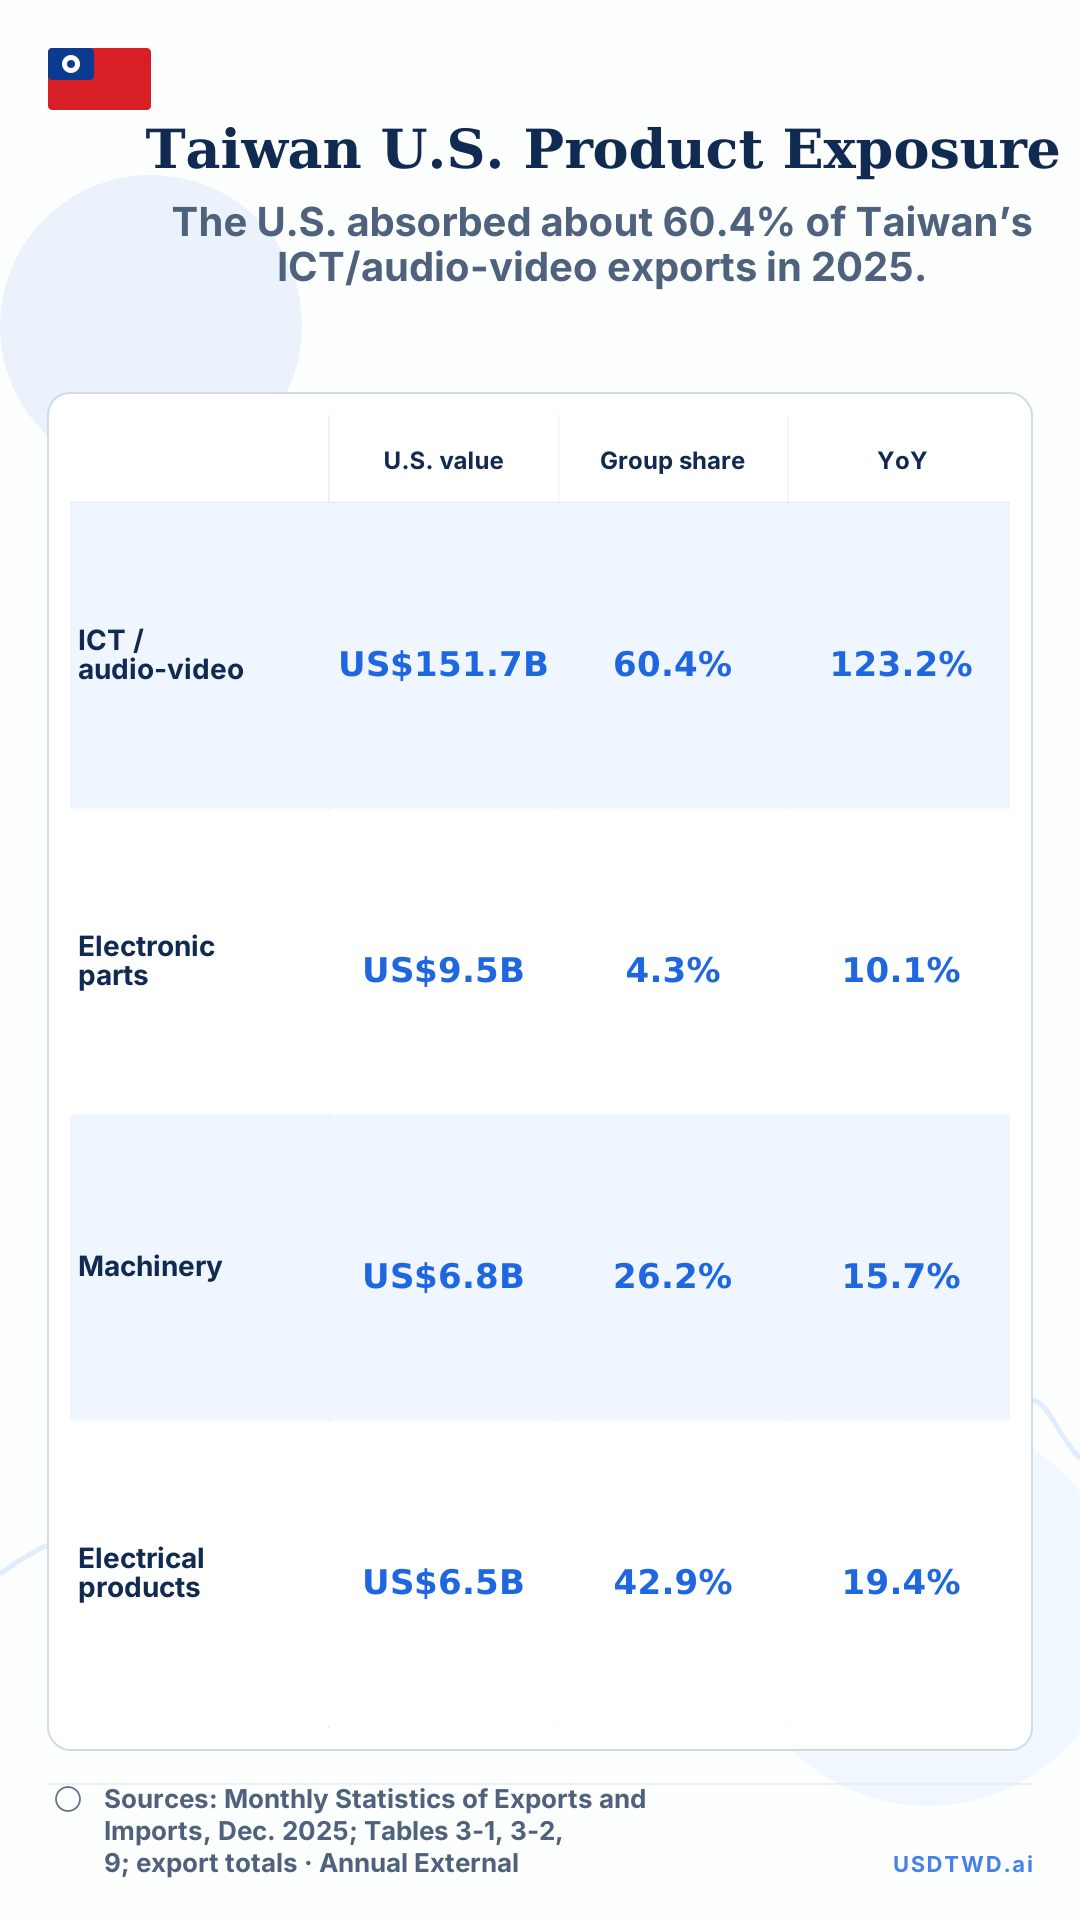
Taiwan U.S. product exposure, 2025
The U.S. absorbed about 60.4% of Taiwan’s ICT/audio-video exports in 2025.
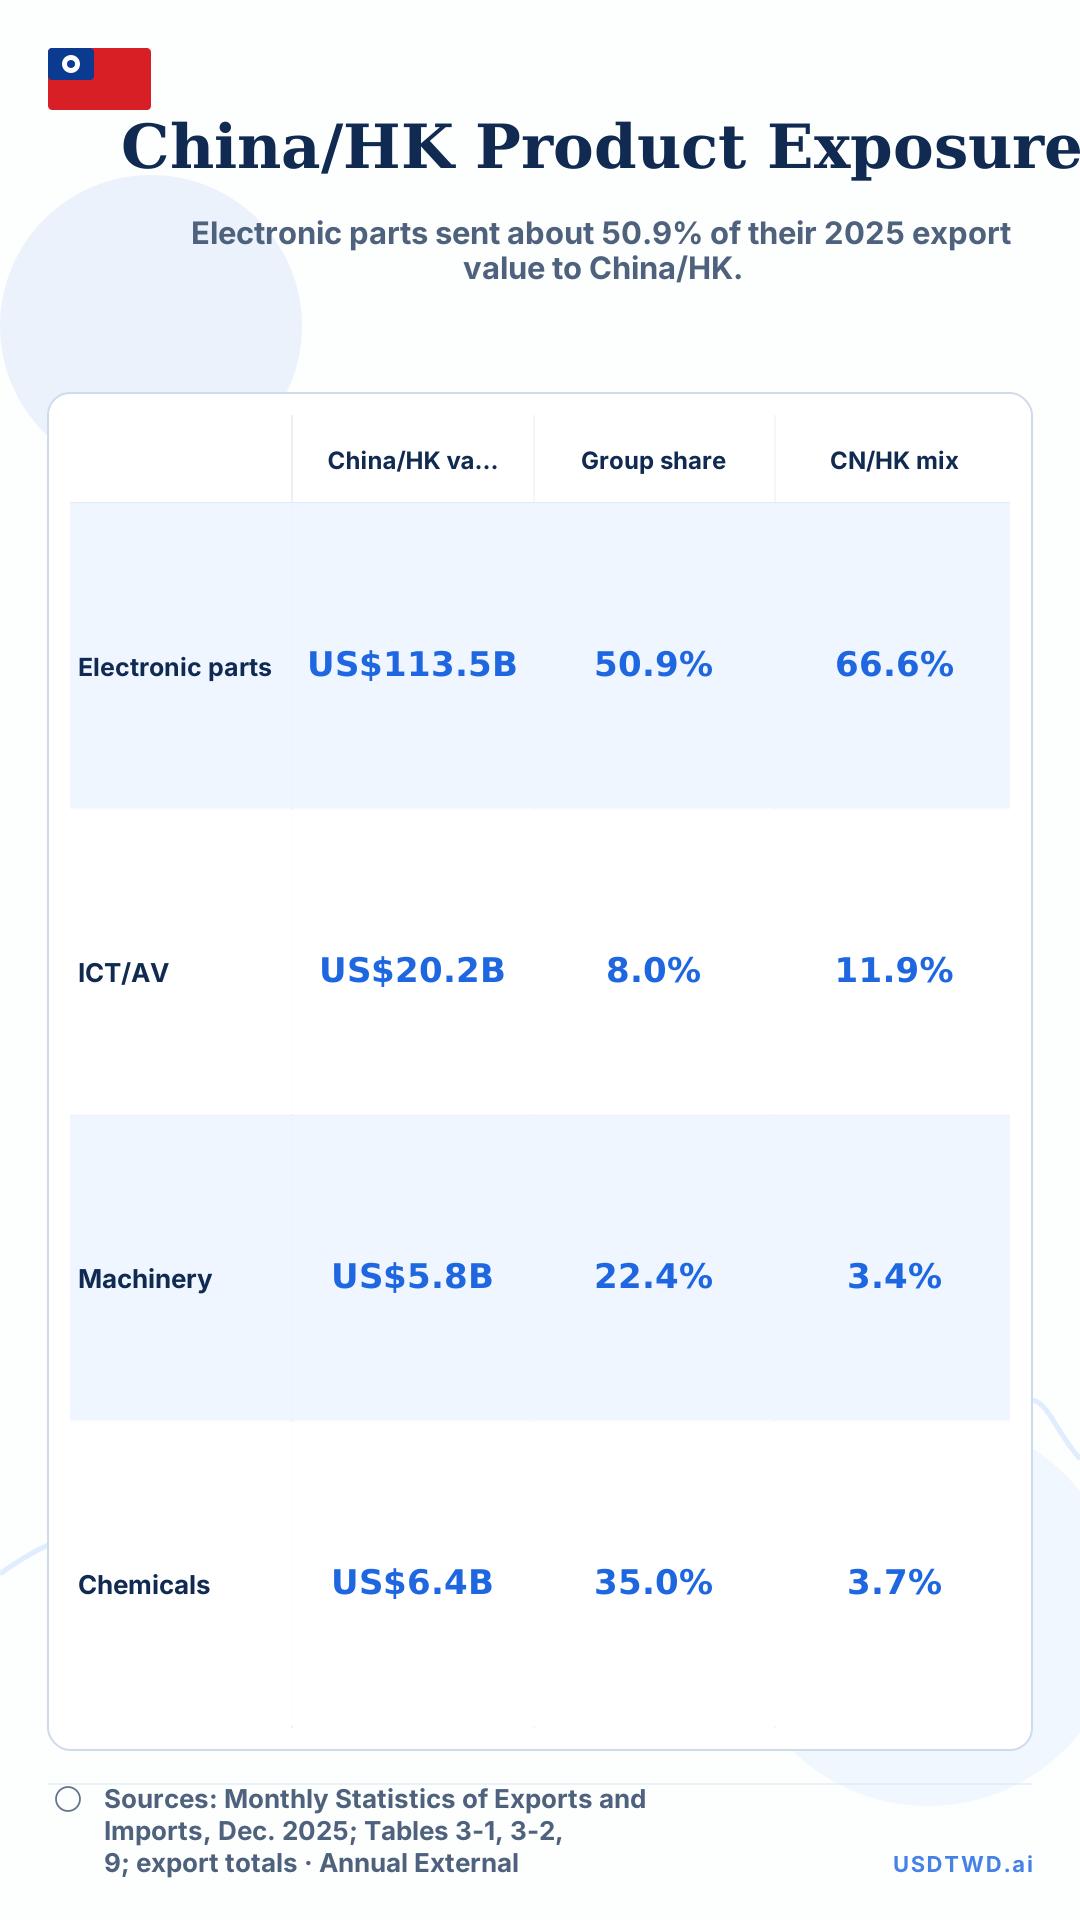
Taiwan China/HK product exposure, 2025
Electronic parts sent about 50.9% of their 2025 export value to China/HK.
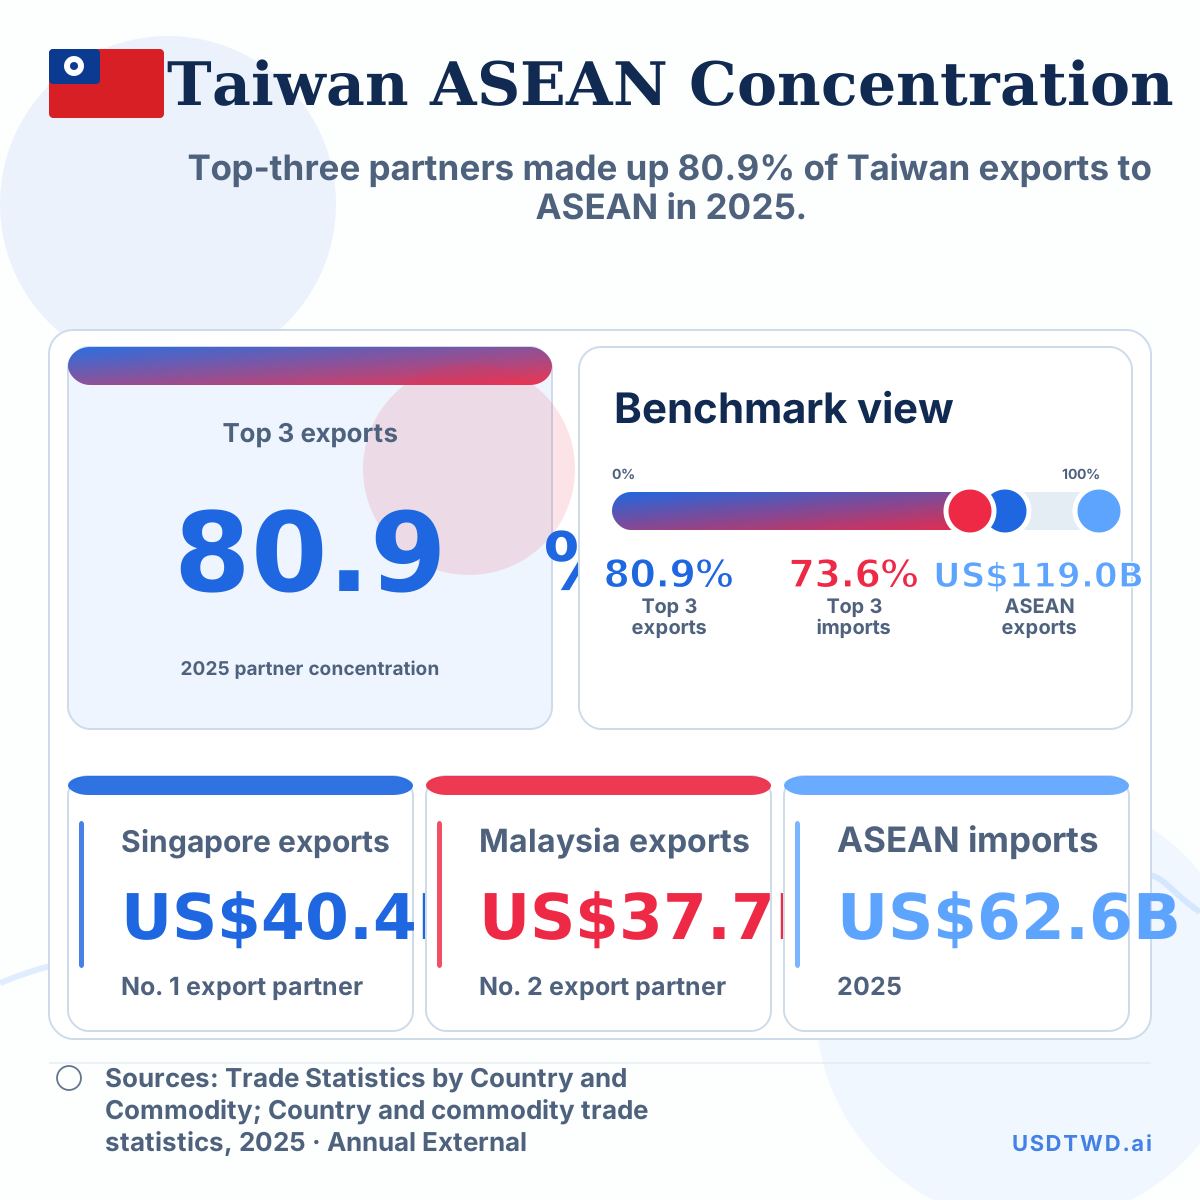
Taiwan ASEAN partner concentration, 2025
Top-three partners made up 80.9% of Taiwan exports to ASEAN in 2025.
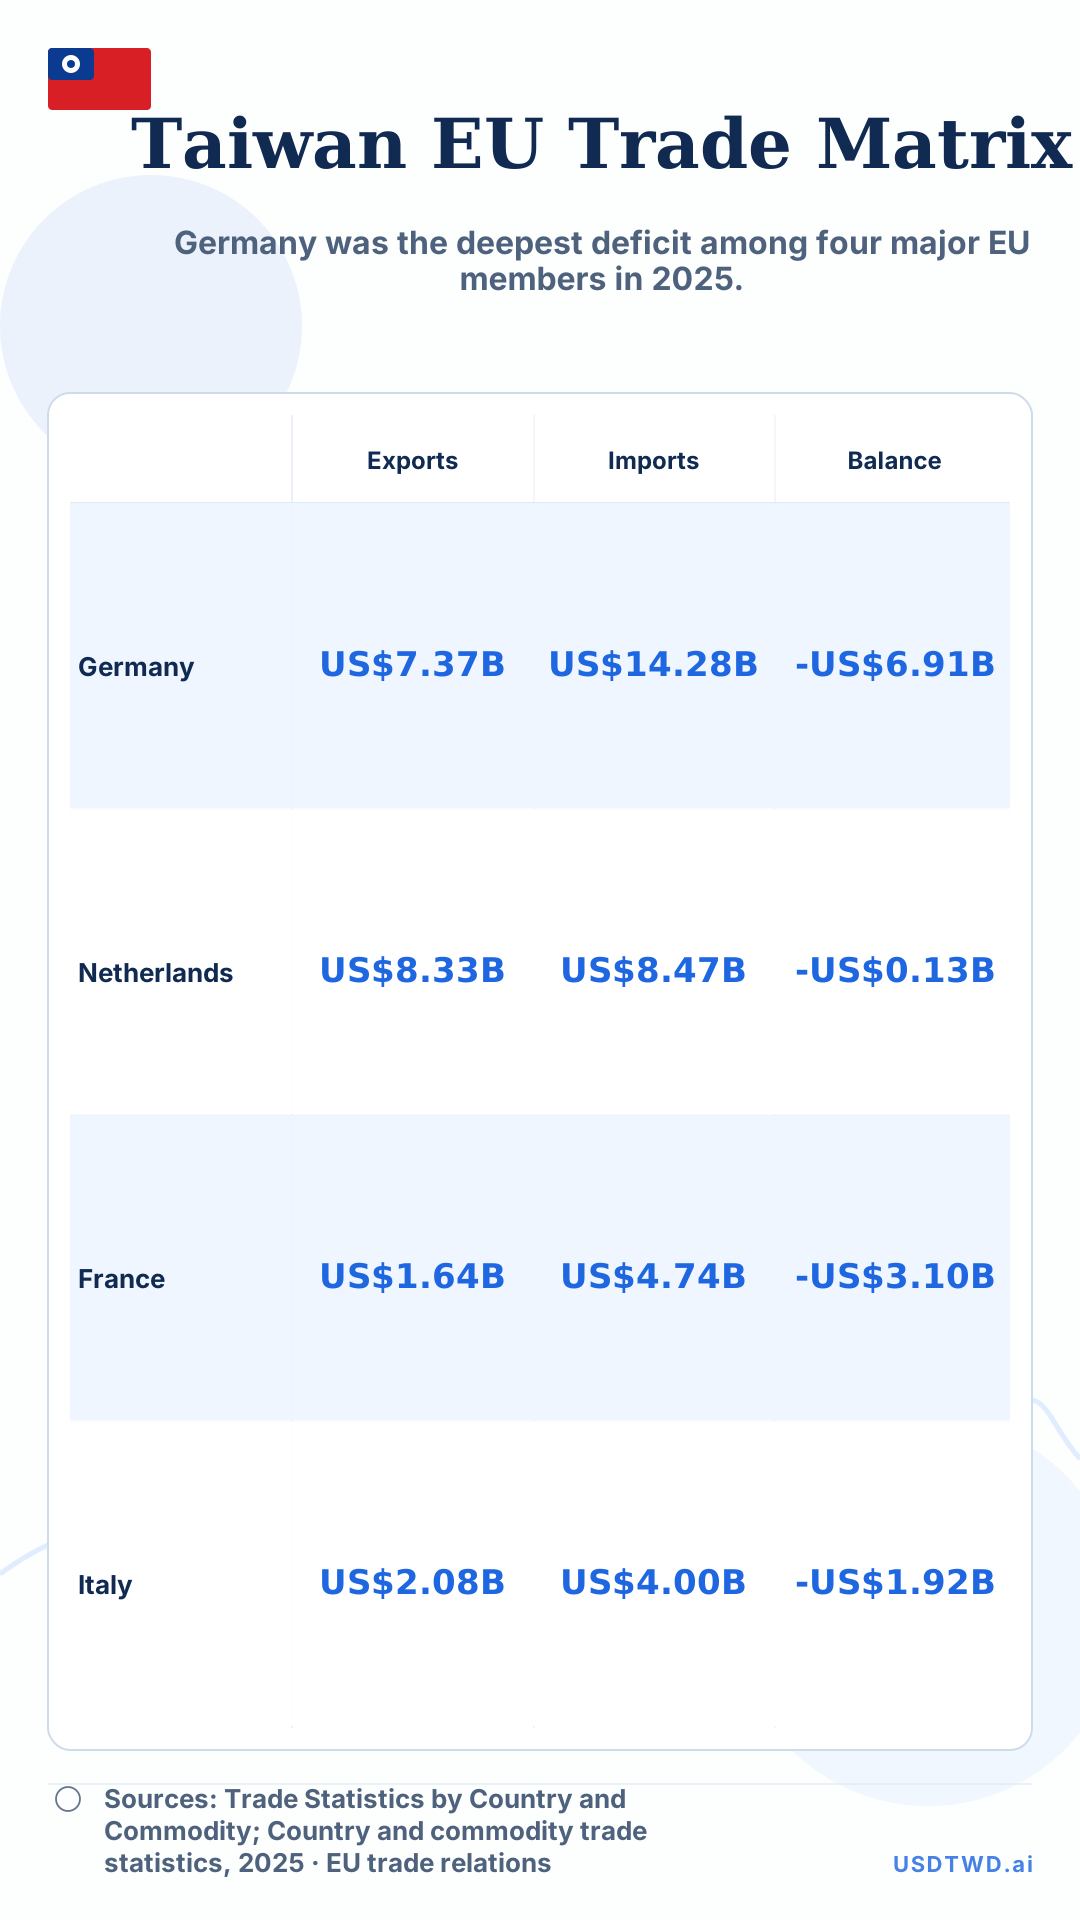
Taiwan EU member trade matrix, 2025
Germany was the deepest deficit among four major EU members in 2025.
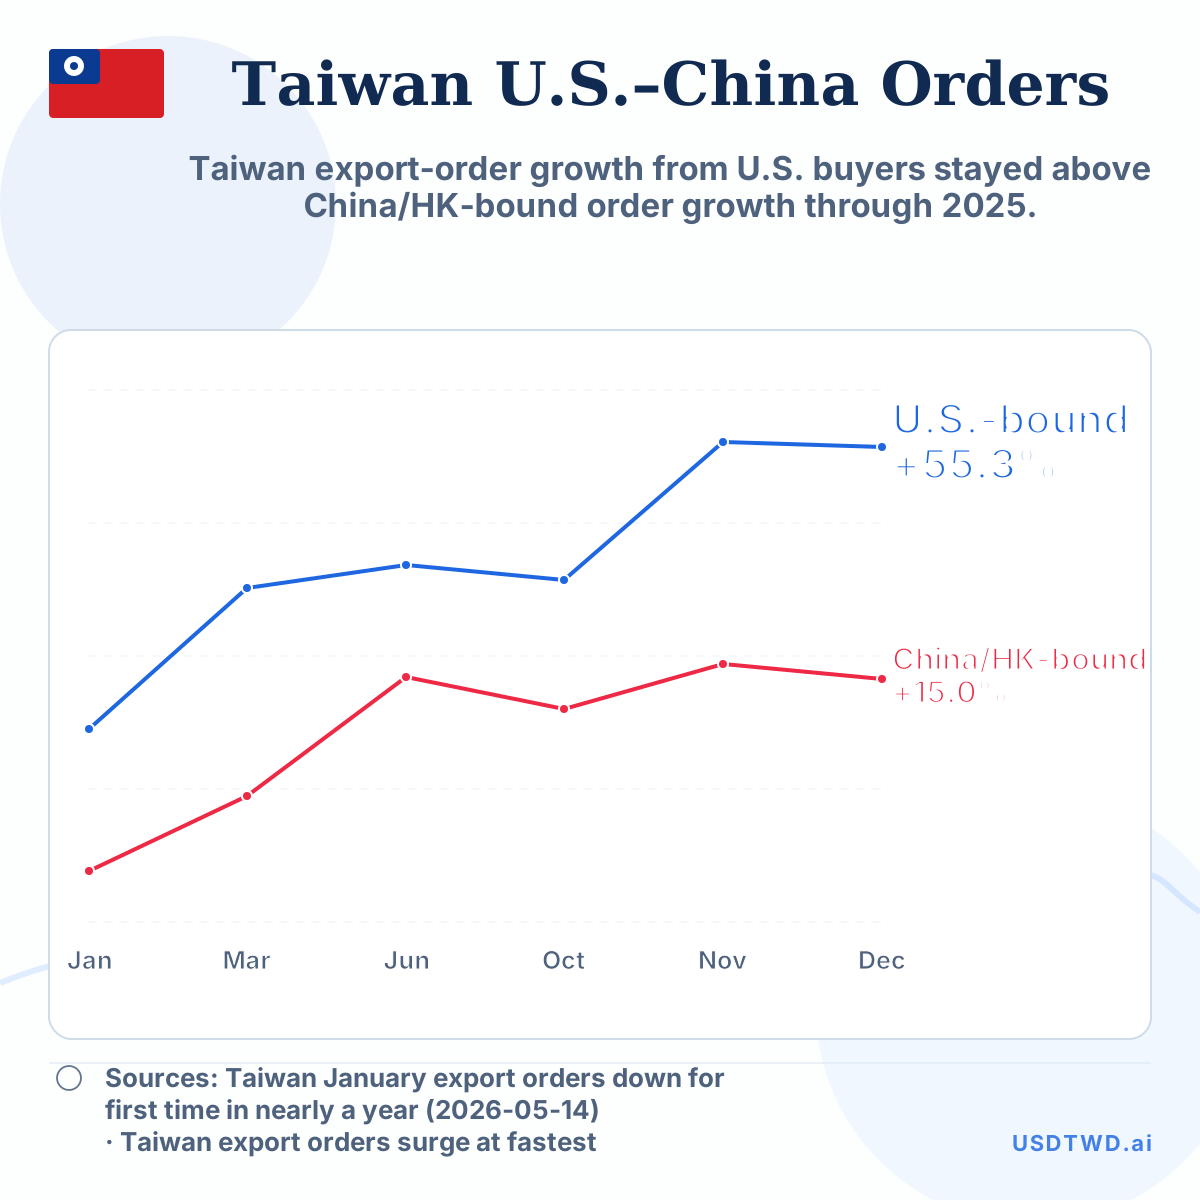
Taiwan U.S. versus China/HK export-order growth, 2025
Taiwan export-order growth from U.S. buyers stayed above China/HK-bound order growth through 2025.
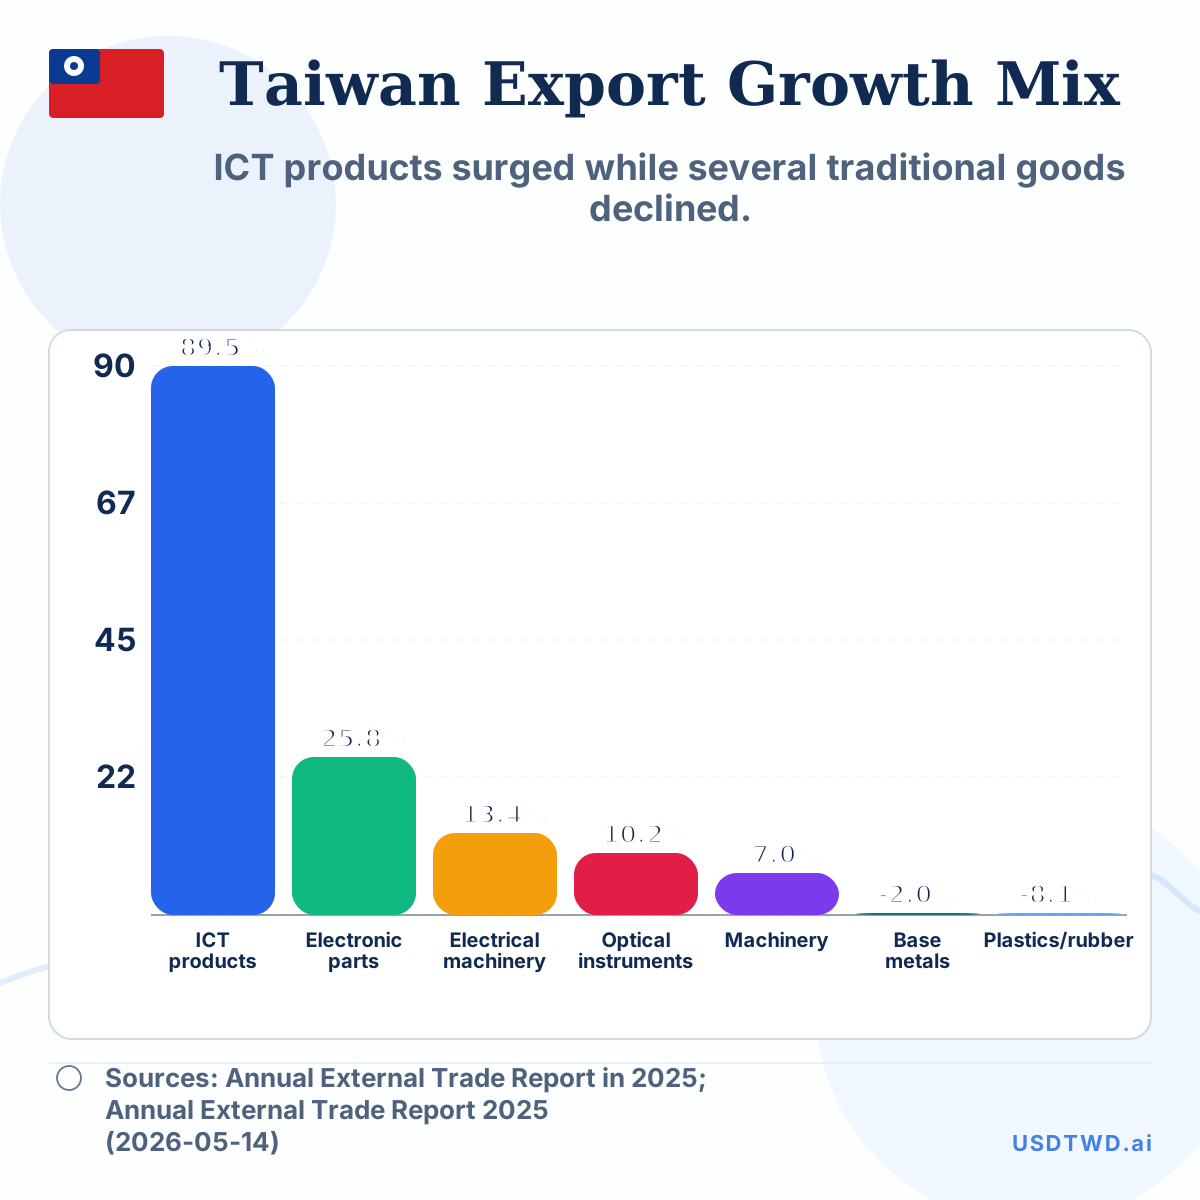
Taiwan export growth by commodity group, 2025
ICT products surged while several traditional goods declined.
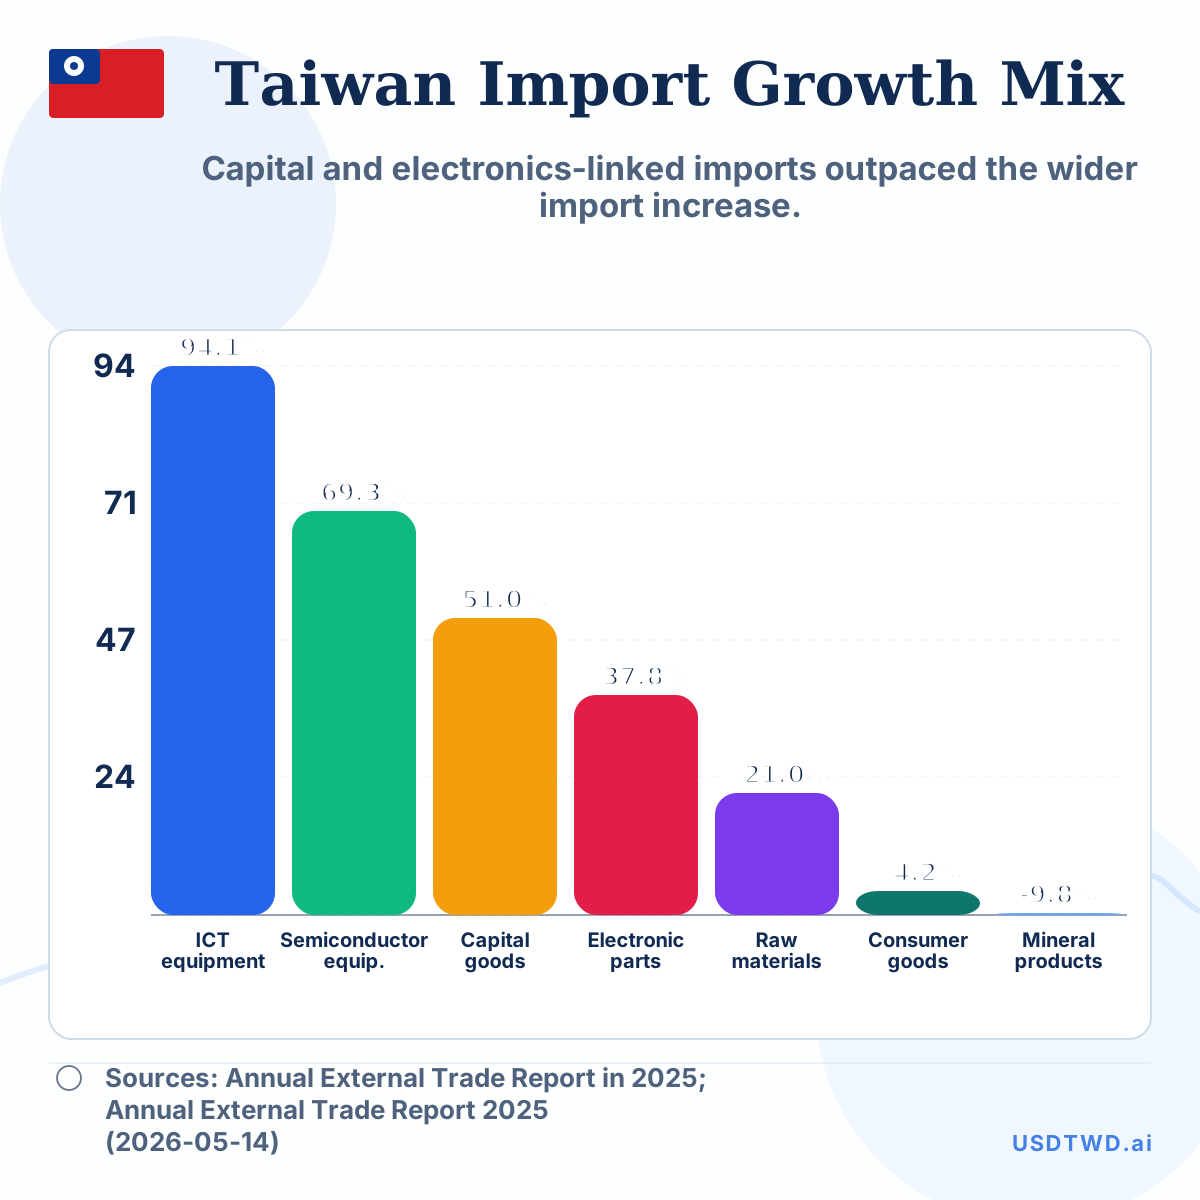
Taiwan import growth by commodity group, 2025
Capital and electronics-linked imports outpaced the wider import increase.
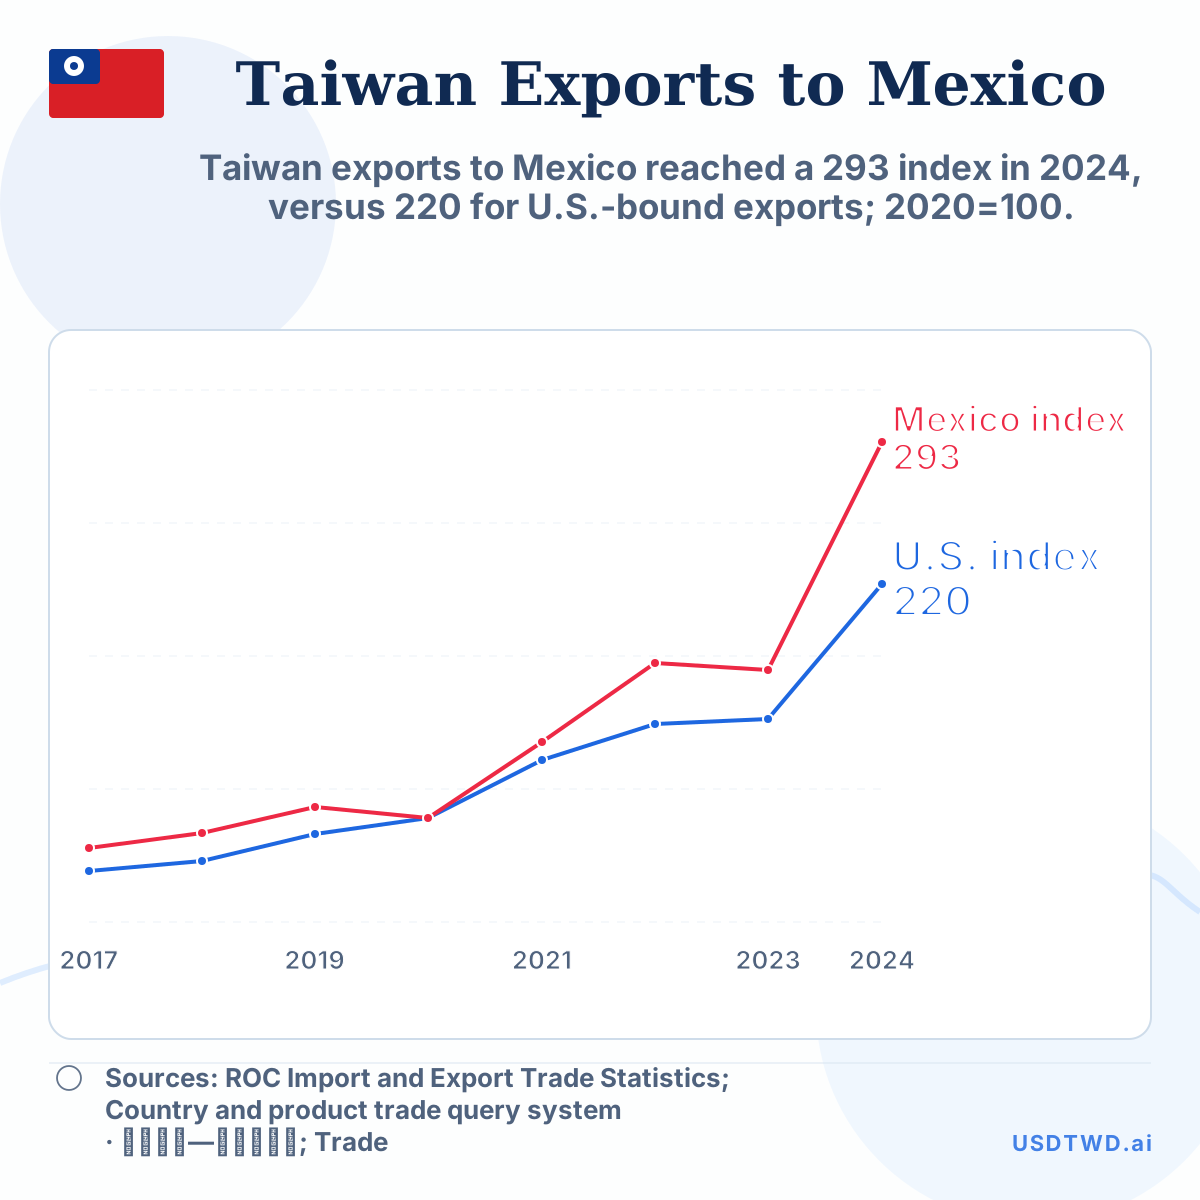
Taiwan exports to Mexico versus U.S. exports, 2017–2024
Taiwan exports to Mexico reached a 293 index in 2024, versus 220 for U.S.-bound exports; 2020=100.
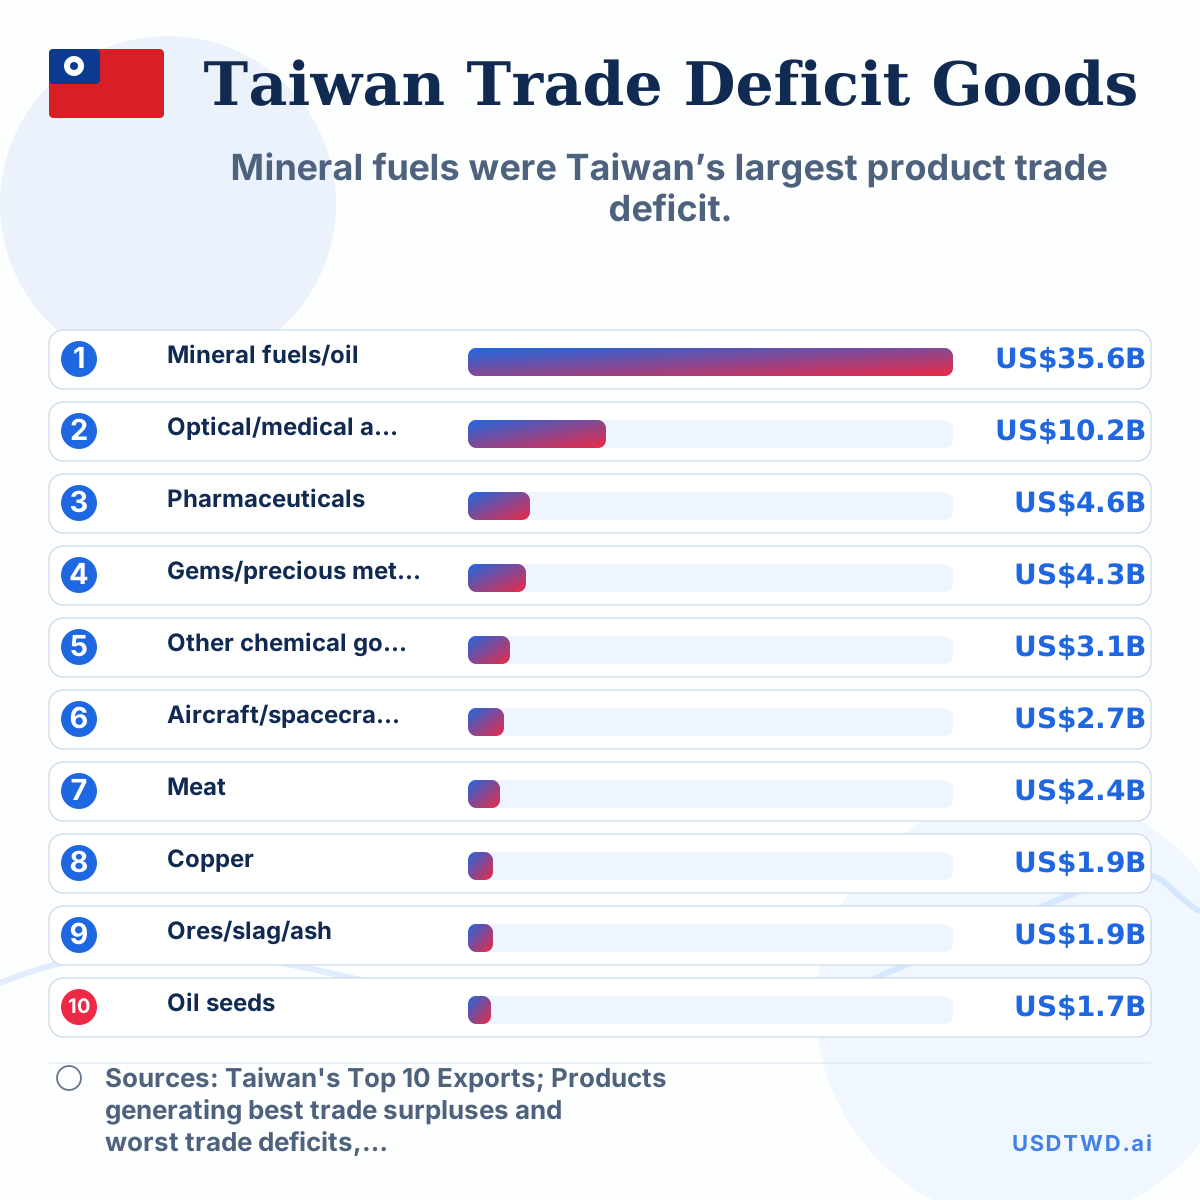
Taiwan goods trade-deficit categories, 2025
Mineral fuels were Taiwan’s largest product trade deficit.
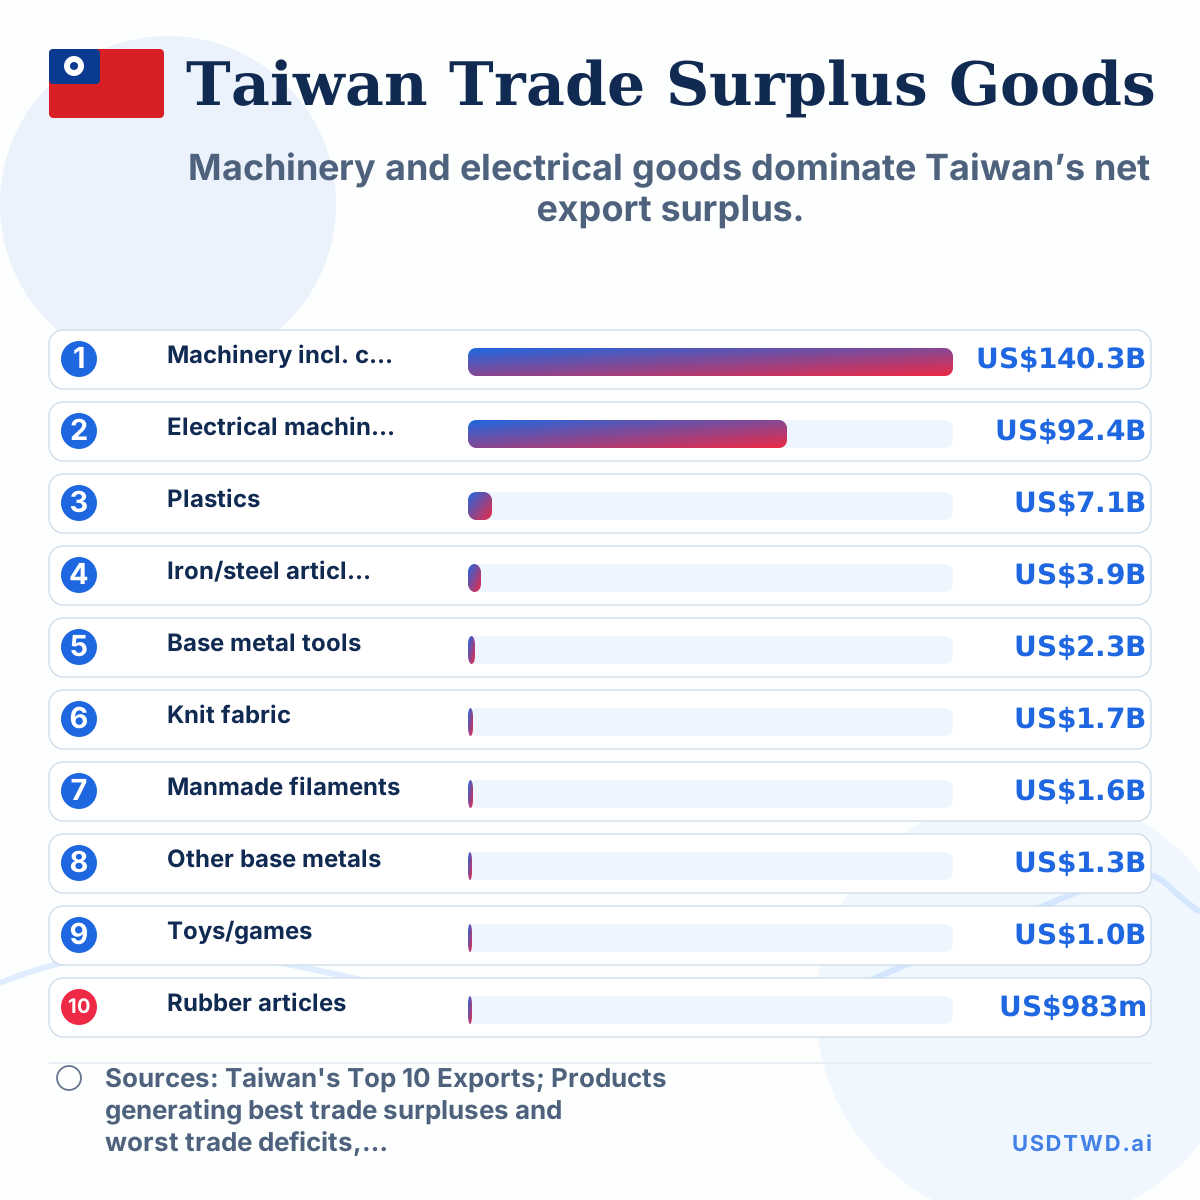
Taiwan goods trade-surplus categories, 2025
Machinery and electrical goods dominate Taiwan’s net export surplus.
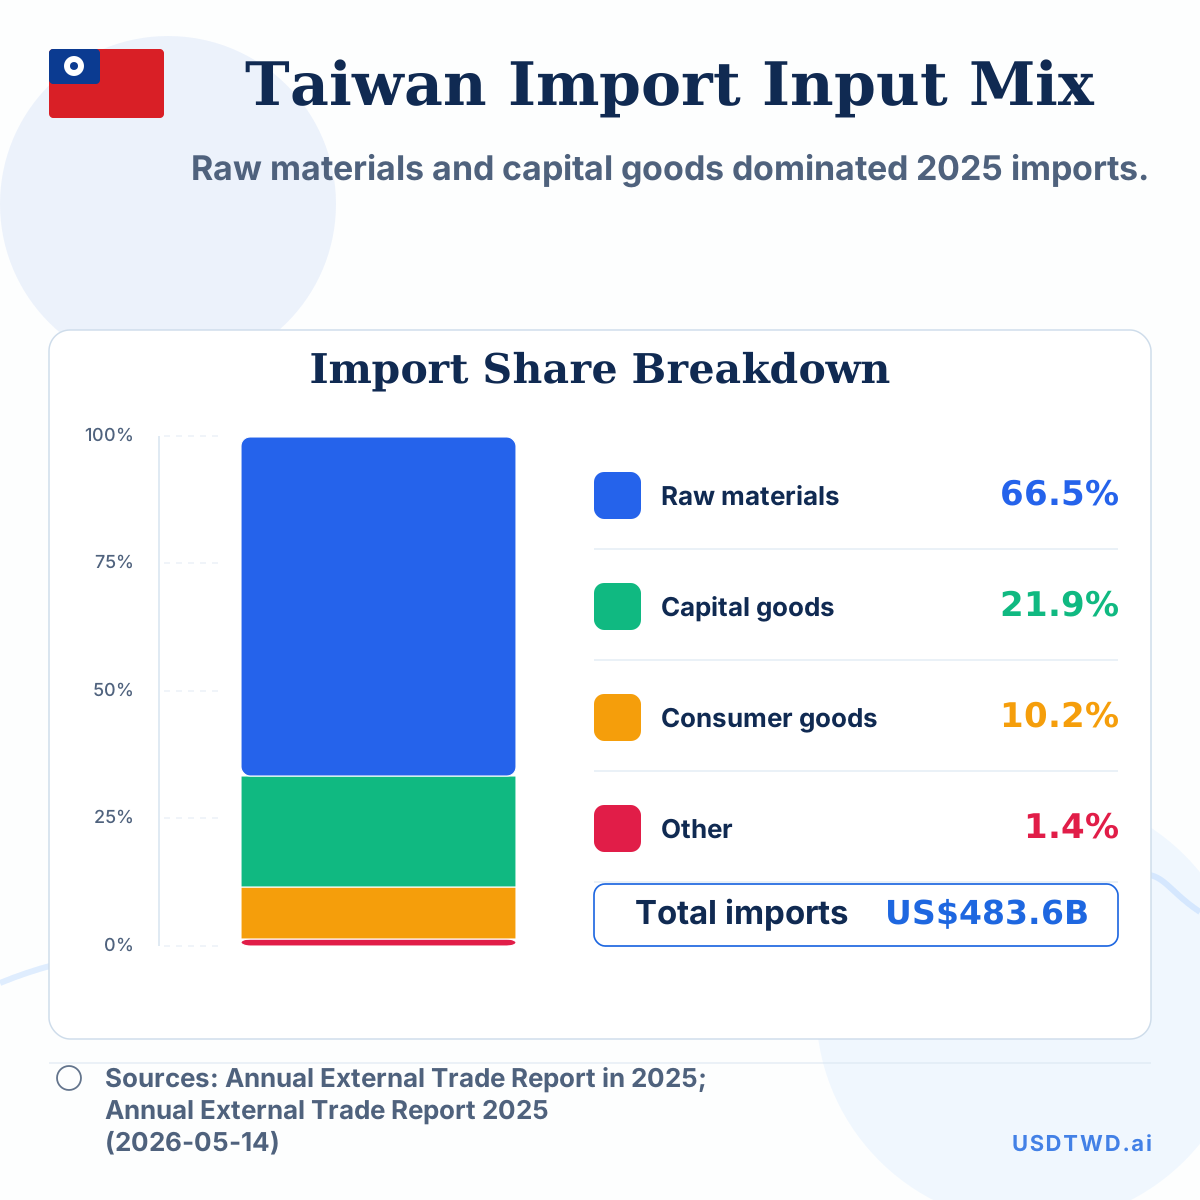
Taiwan import input mix, 2025
Raw materials and capital goods dominated 2025 imports.
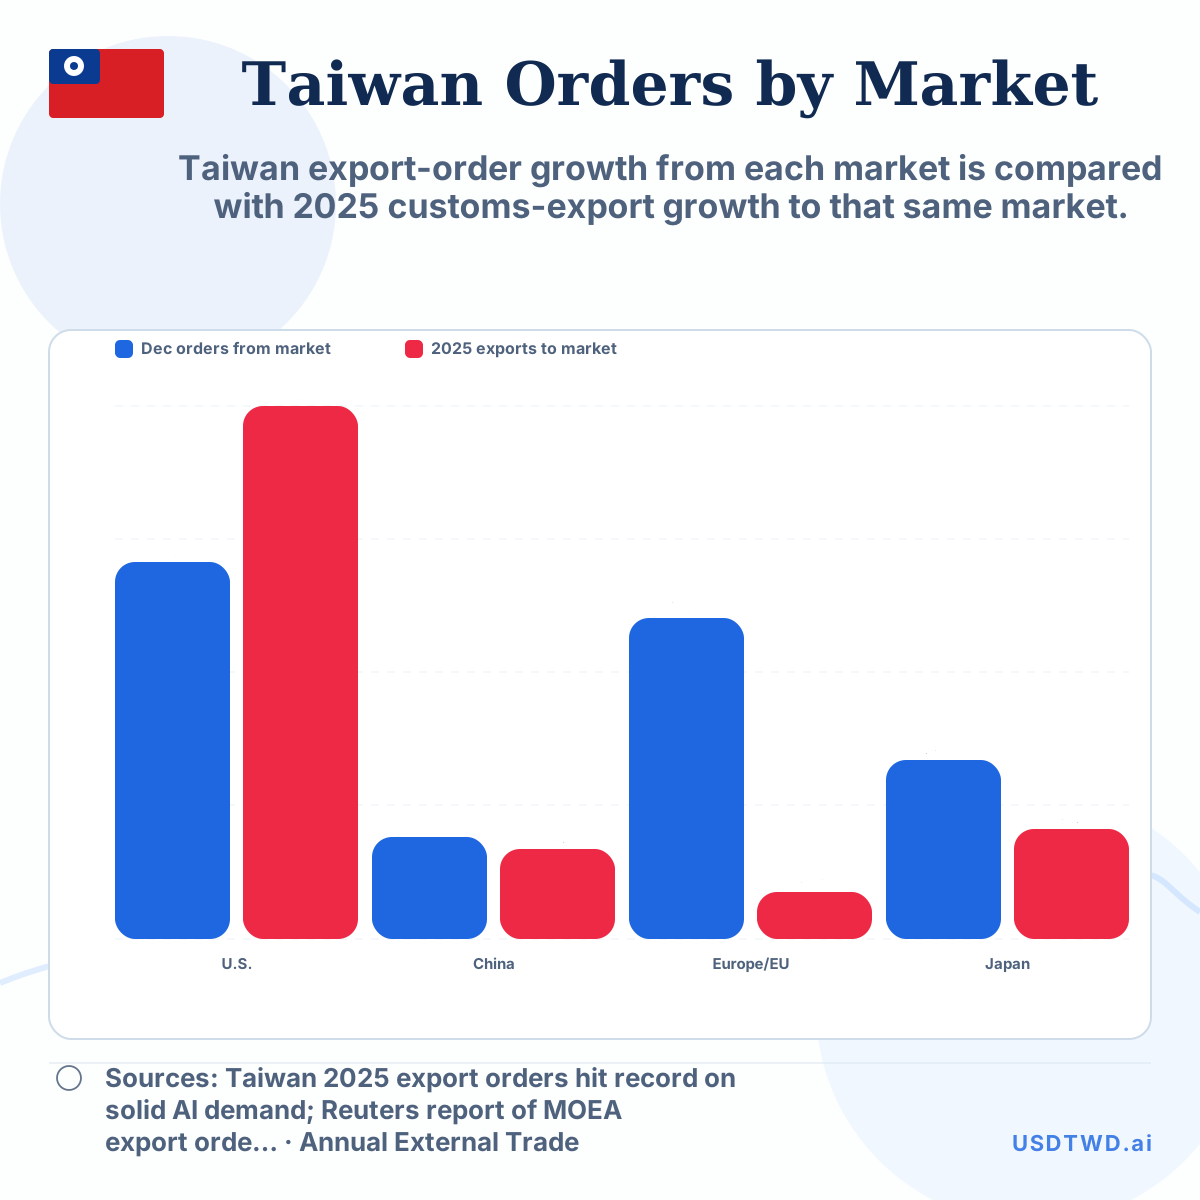
Taiwan export-order growth versus customs export growth by market, 2025
Taiwan export-order growth from each market is compared with 2025 customs-export growth to that same market.
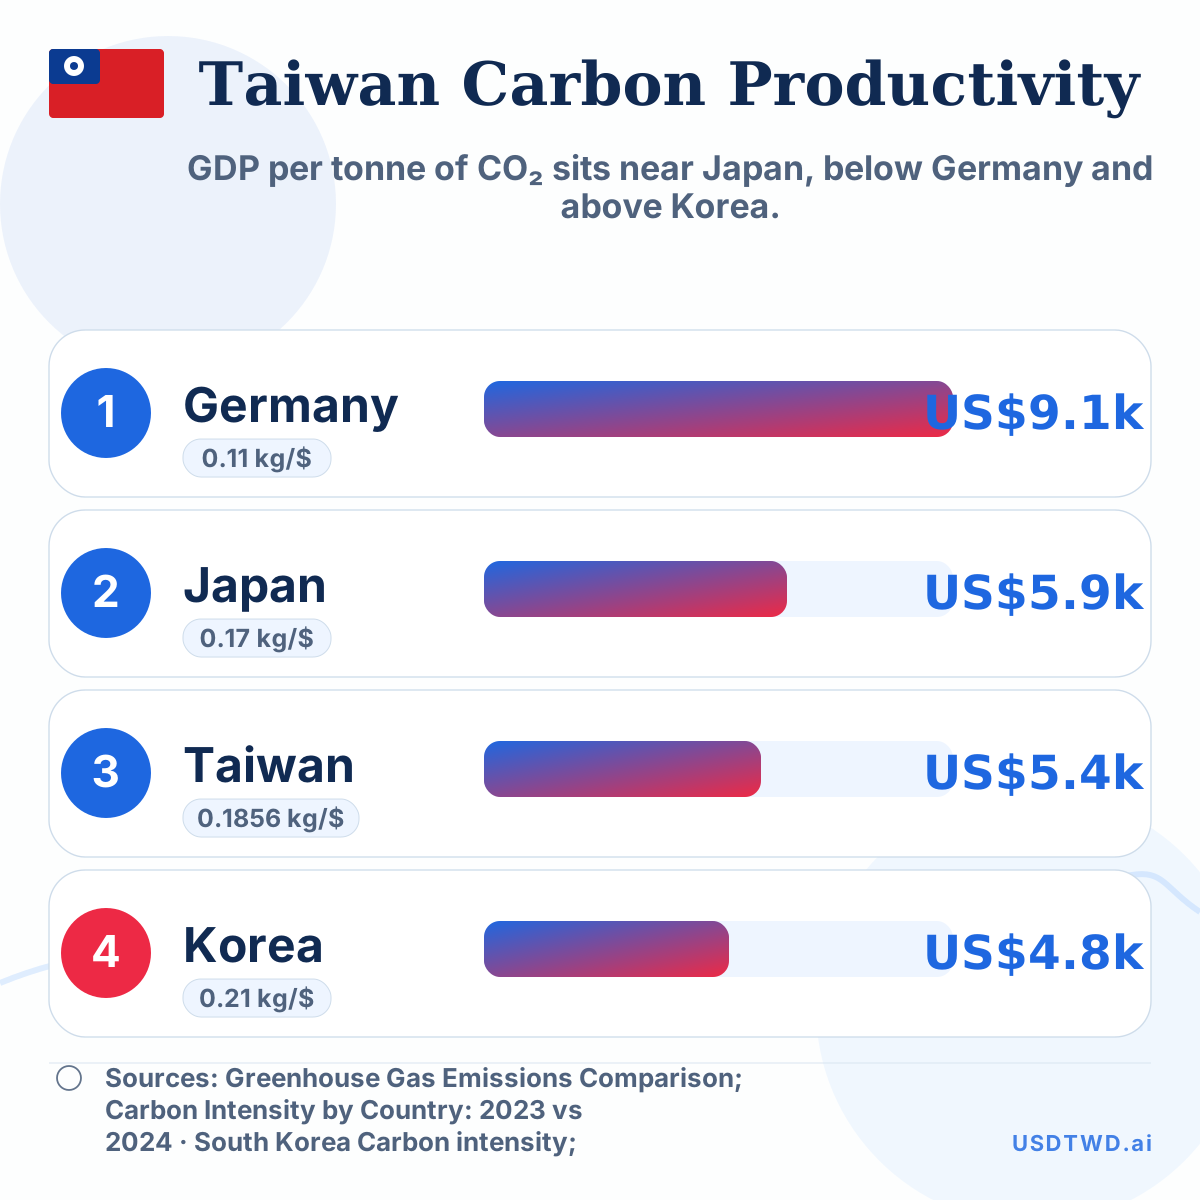
Taiwan carbon productivity versus peers, 2024
GDP per tonne of CO₂ sits near Japan, below Germany and above Korea.
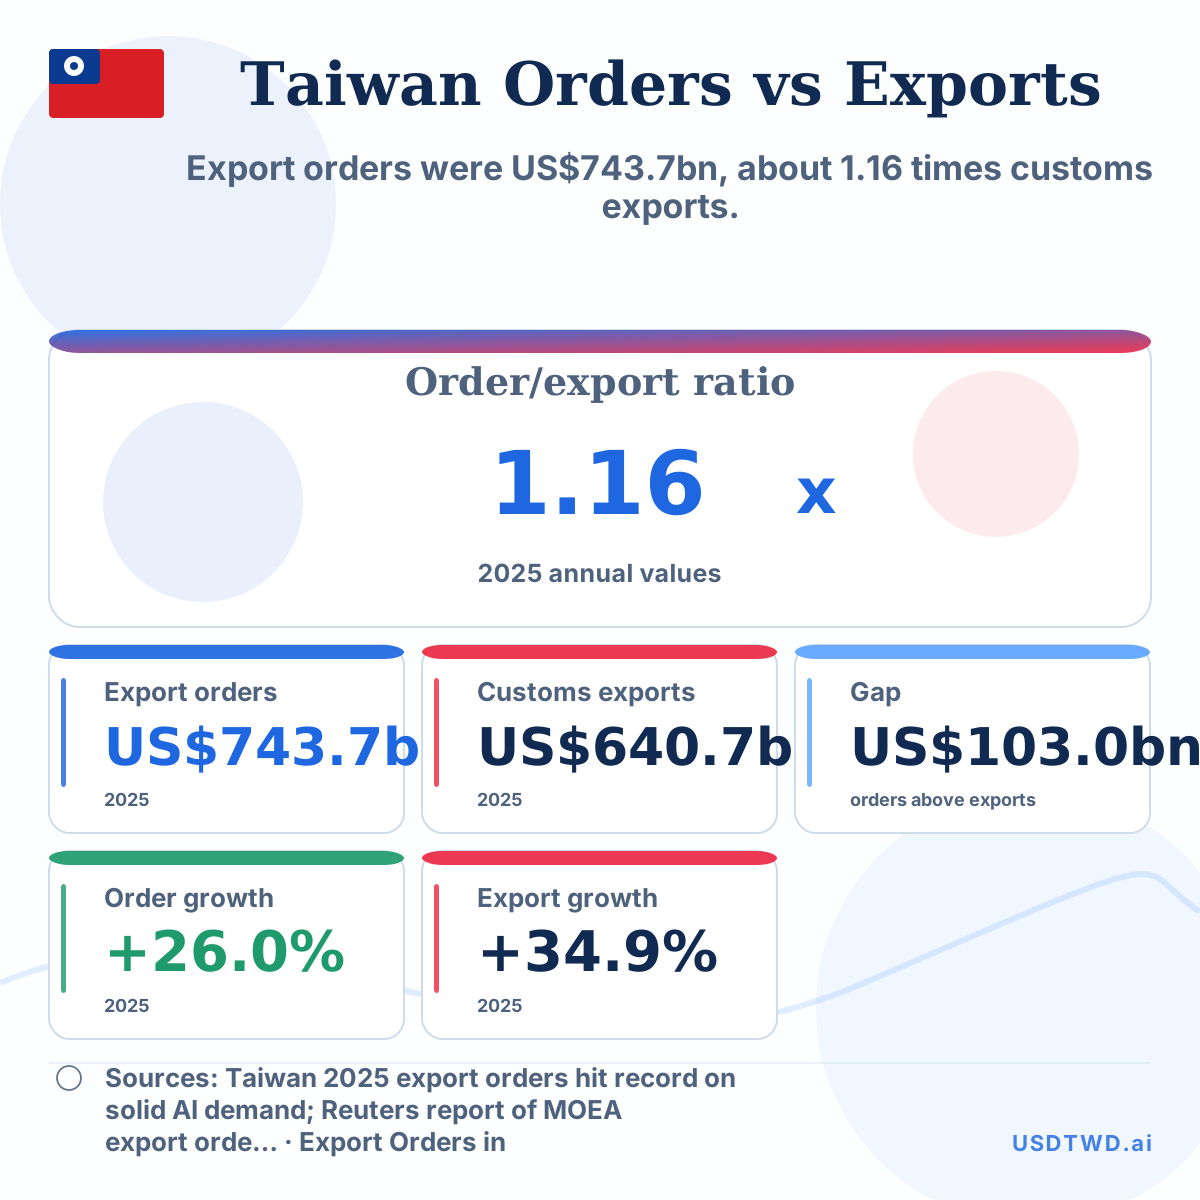
Taiwan export orders versus customs exports, 2025
Export orders were US$743.7bn, about 1.16 times customs exports.
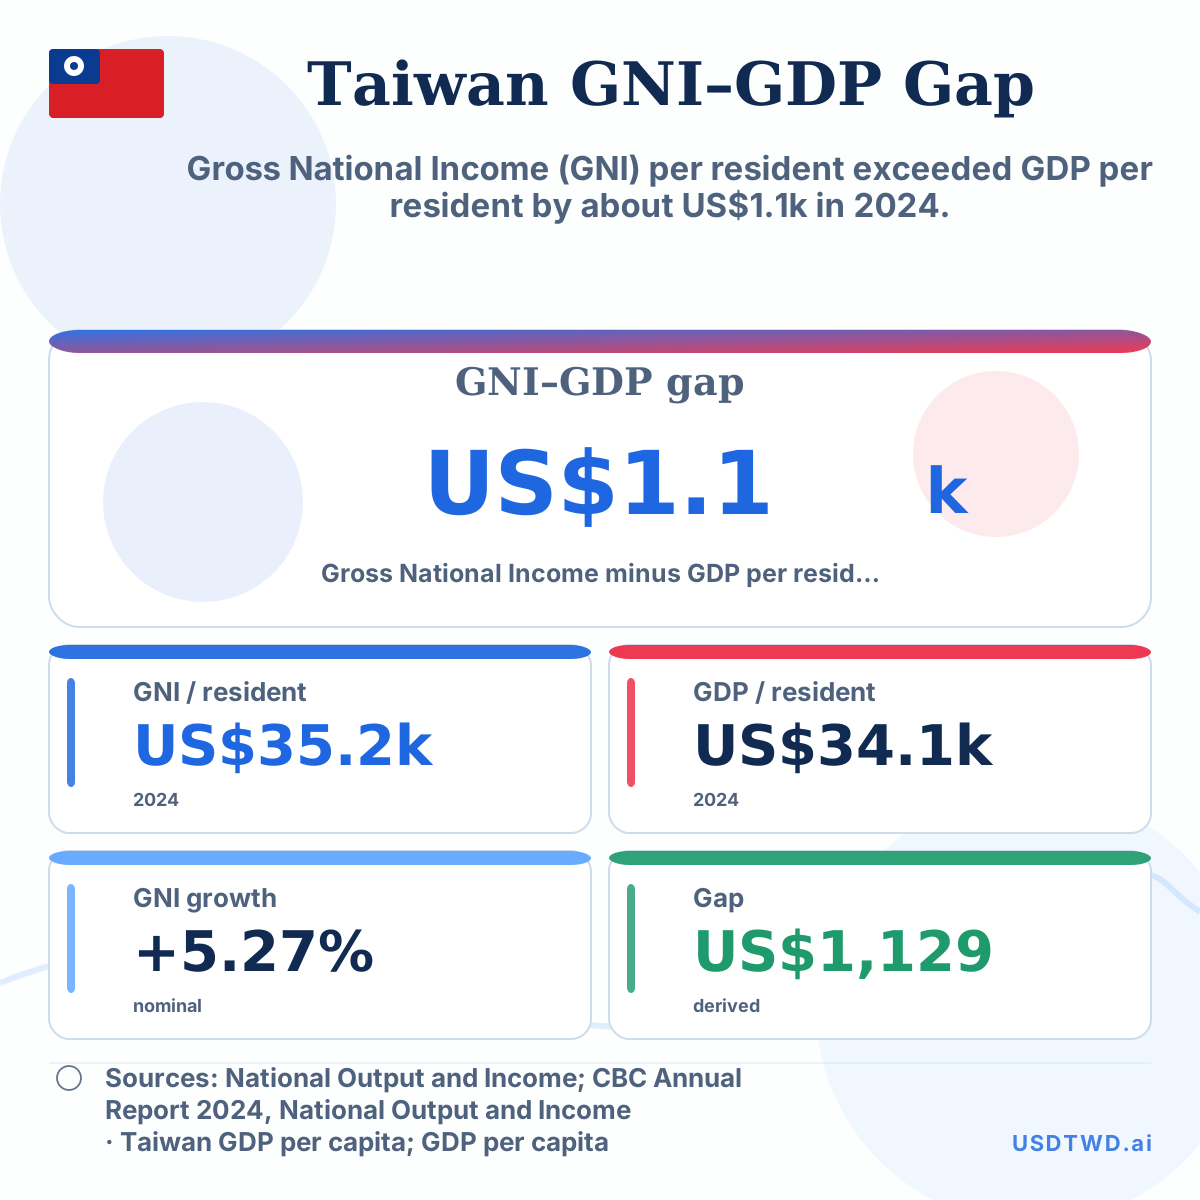
Taiwan GNI per capita versus GDP per capita, 2024
Gross National Income (GNI) per resident exceeded GDP per resident by about US$1.1k in 2024.
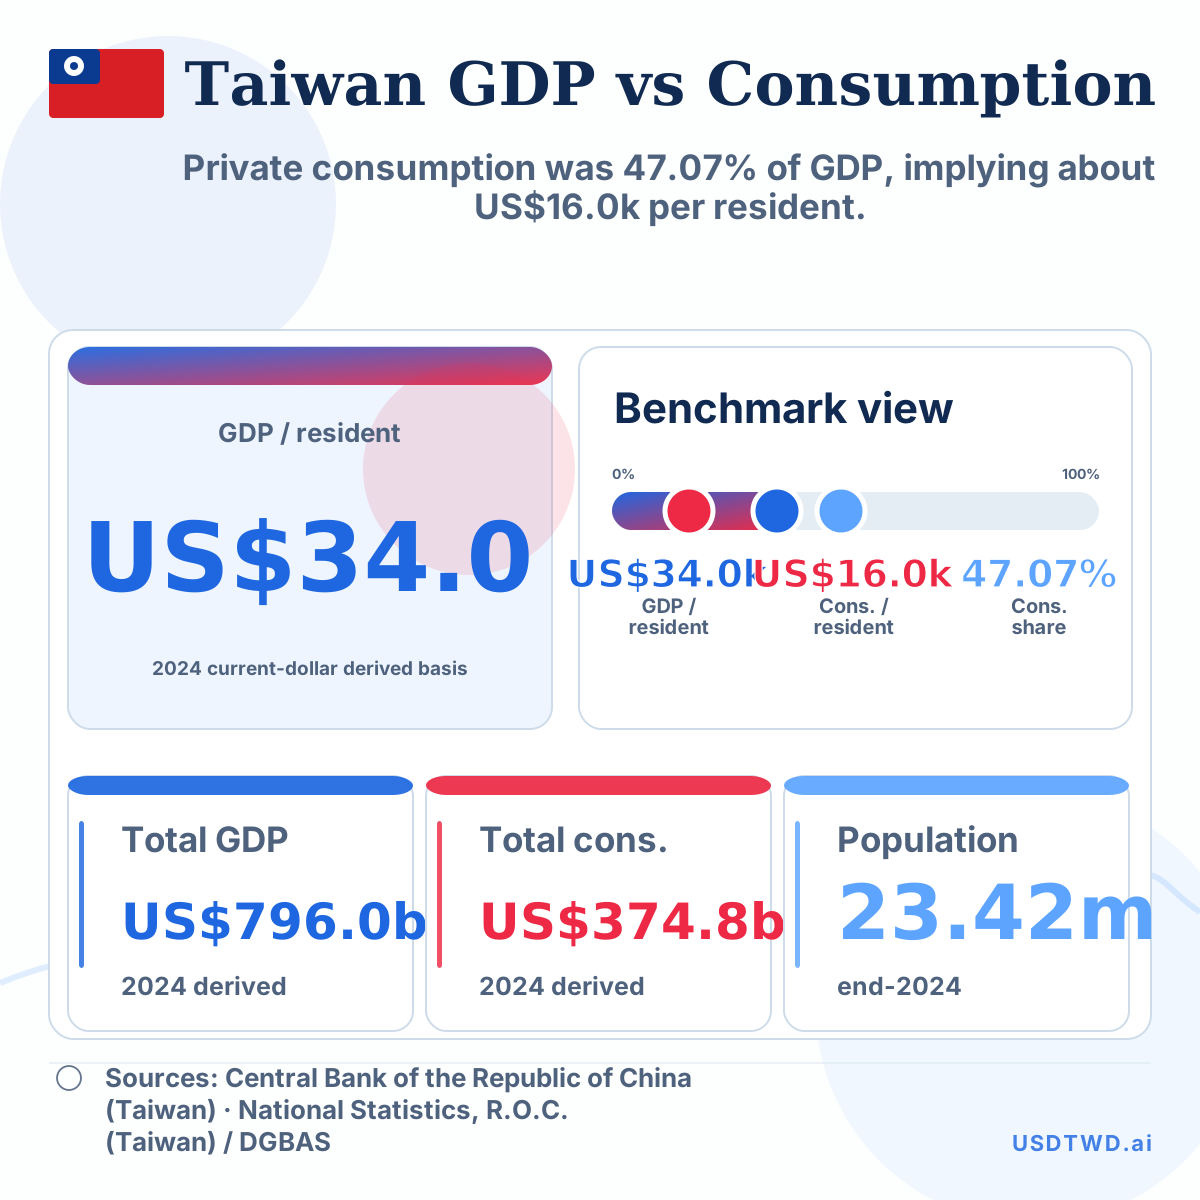
Taiwan GDP per Capita versus Household Consumption per Capita, 2024
Private consumption was 47.07% of GDP, implying about US$16.0k per resident.
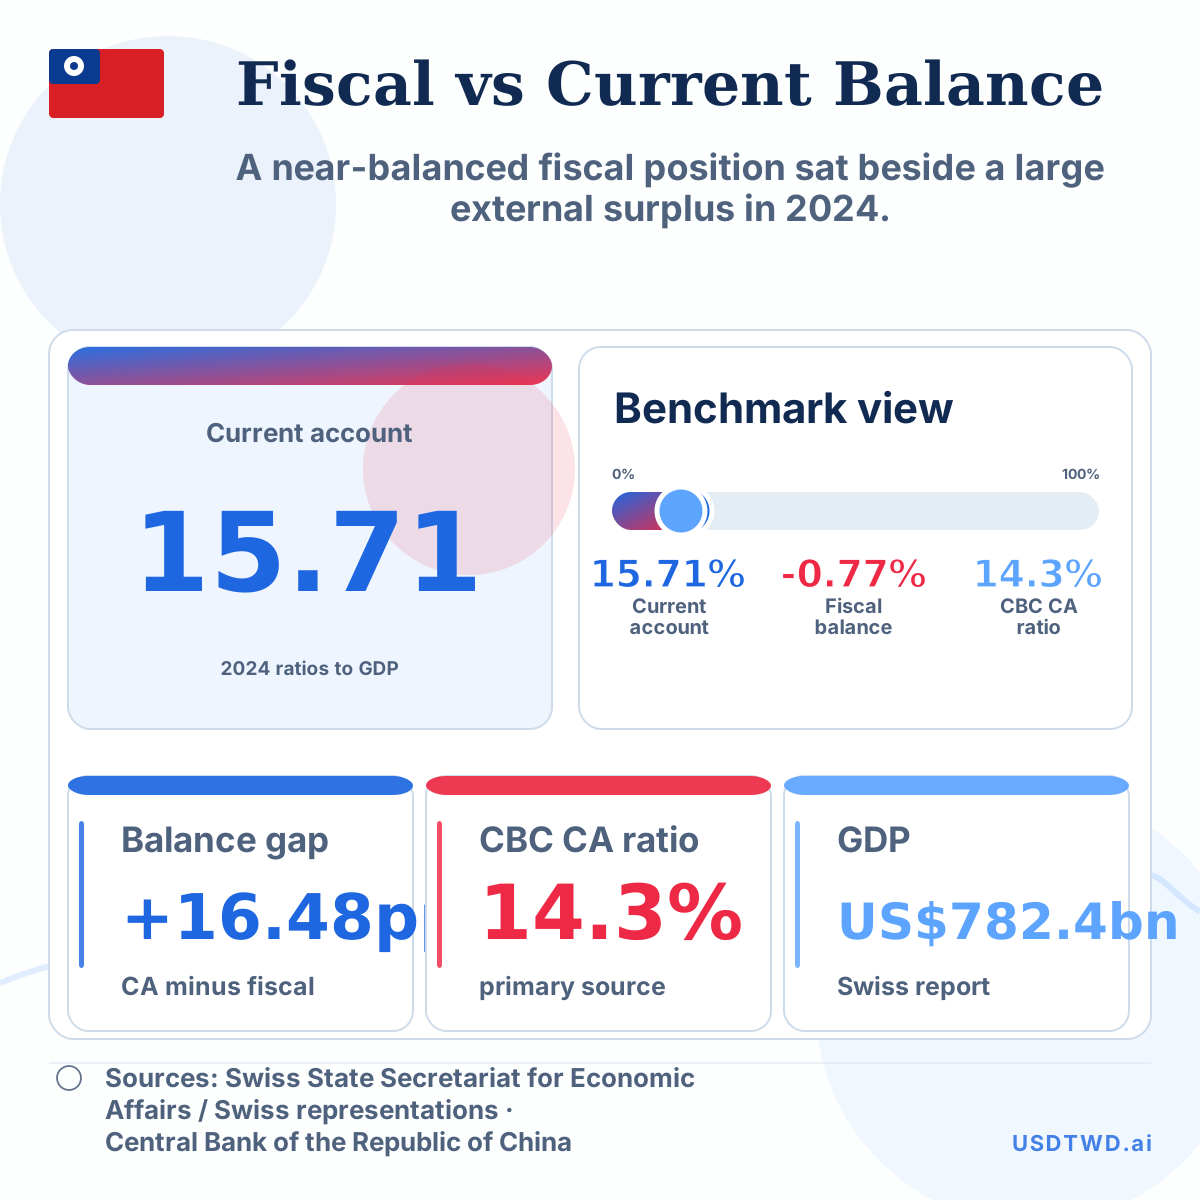
Taiwan Fiscal Balance vs Current-account Balance, 2024
A near-balanced fiscal position sat beside a large external surplus in 2024.
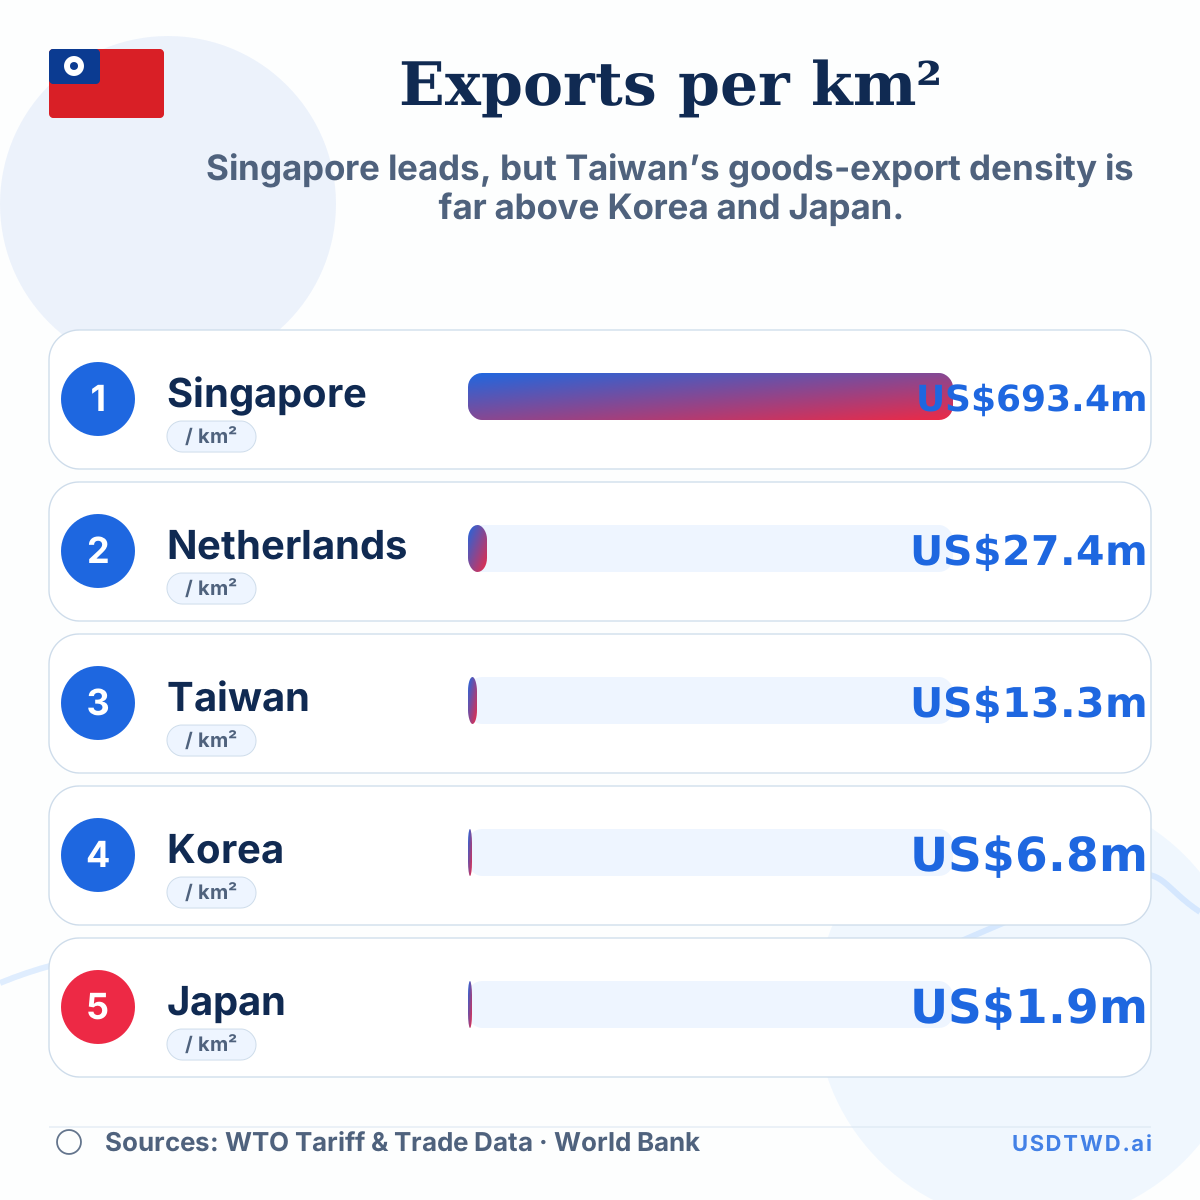
Exports per Square Kilometre: Taiwan vs Dense Export Economies
Singapore leads, but Taiwan’s goods-export density is far above Korea and Japan.
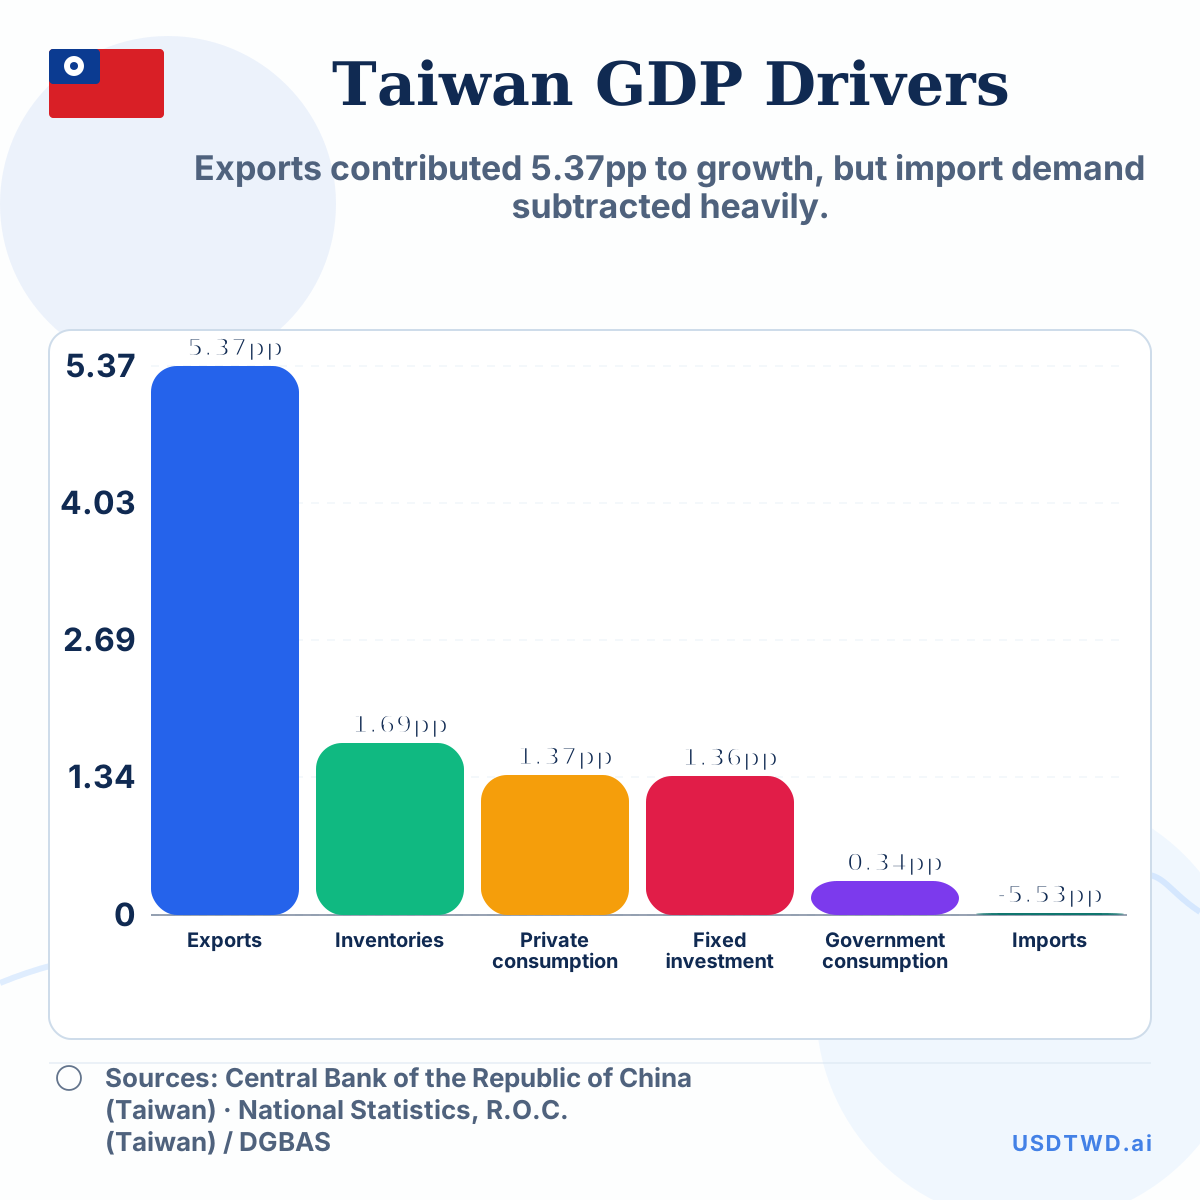
Taiwan GDP Demand Drivers, 2024
Exports contributed 5.37pp to growth, but import demand subtracted heavily.
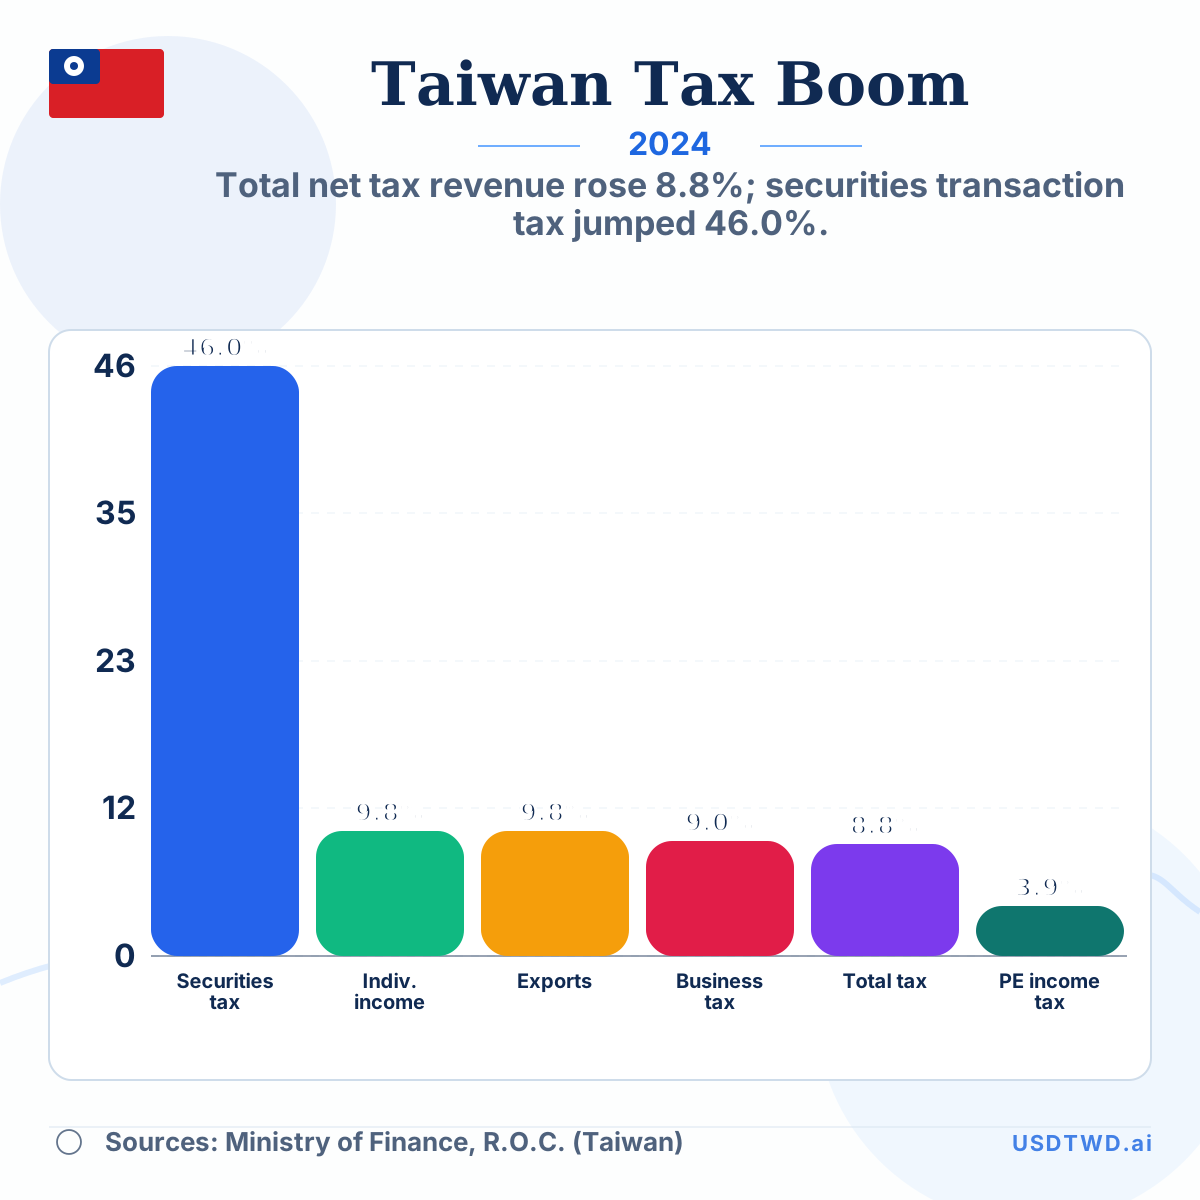
Taiwan Tax Revenue versus the 2024 Export Boom
Total net tax revenue rose 8.8%; securities transaction tax jumped 46.0%.
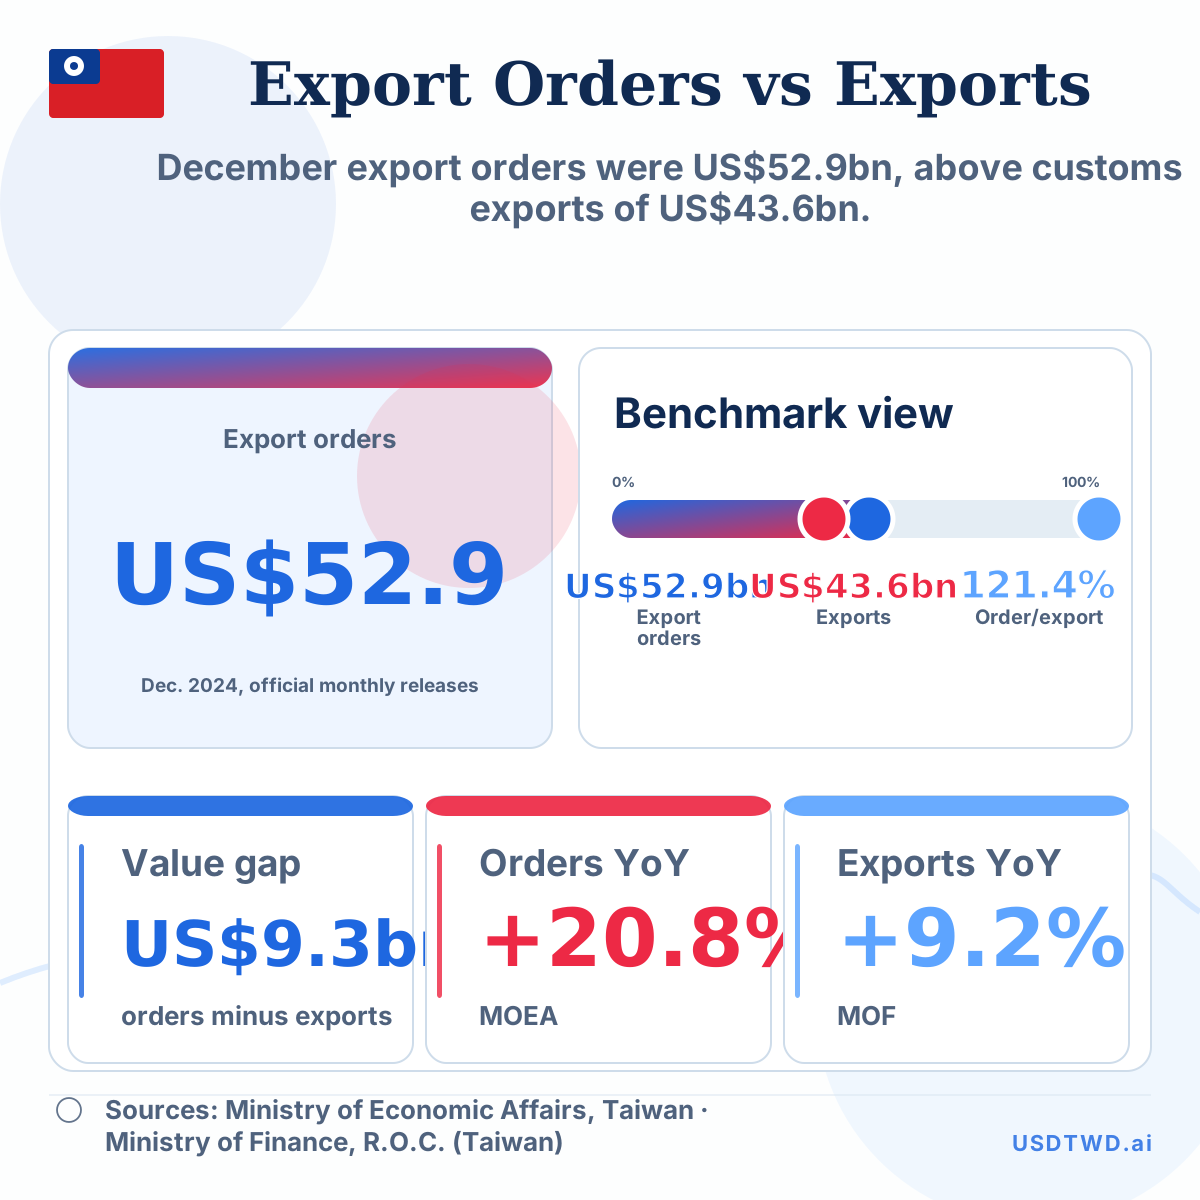
Taiwan Export Orders vs Actual Exports in December 2024
December export orders were US$52.9bn, above customs exports of US$43.6bn.
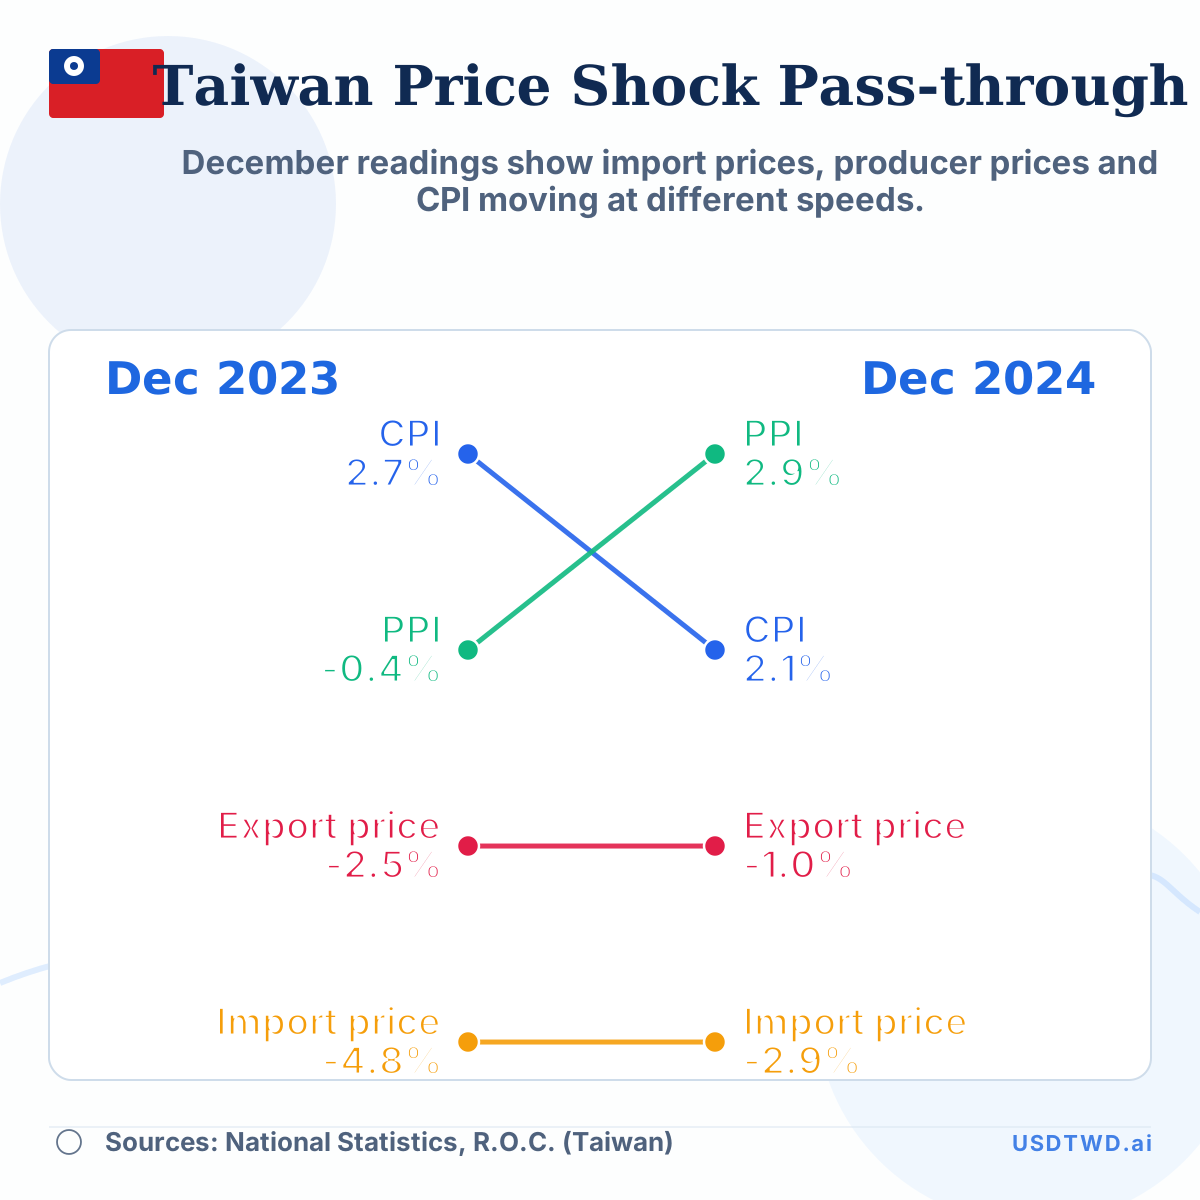
Taiwan Import Price Pass-through: Dec 2023 vs Dec 2024
December readings show import prices, producer prices and CPI moving at different speeds.
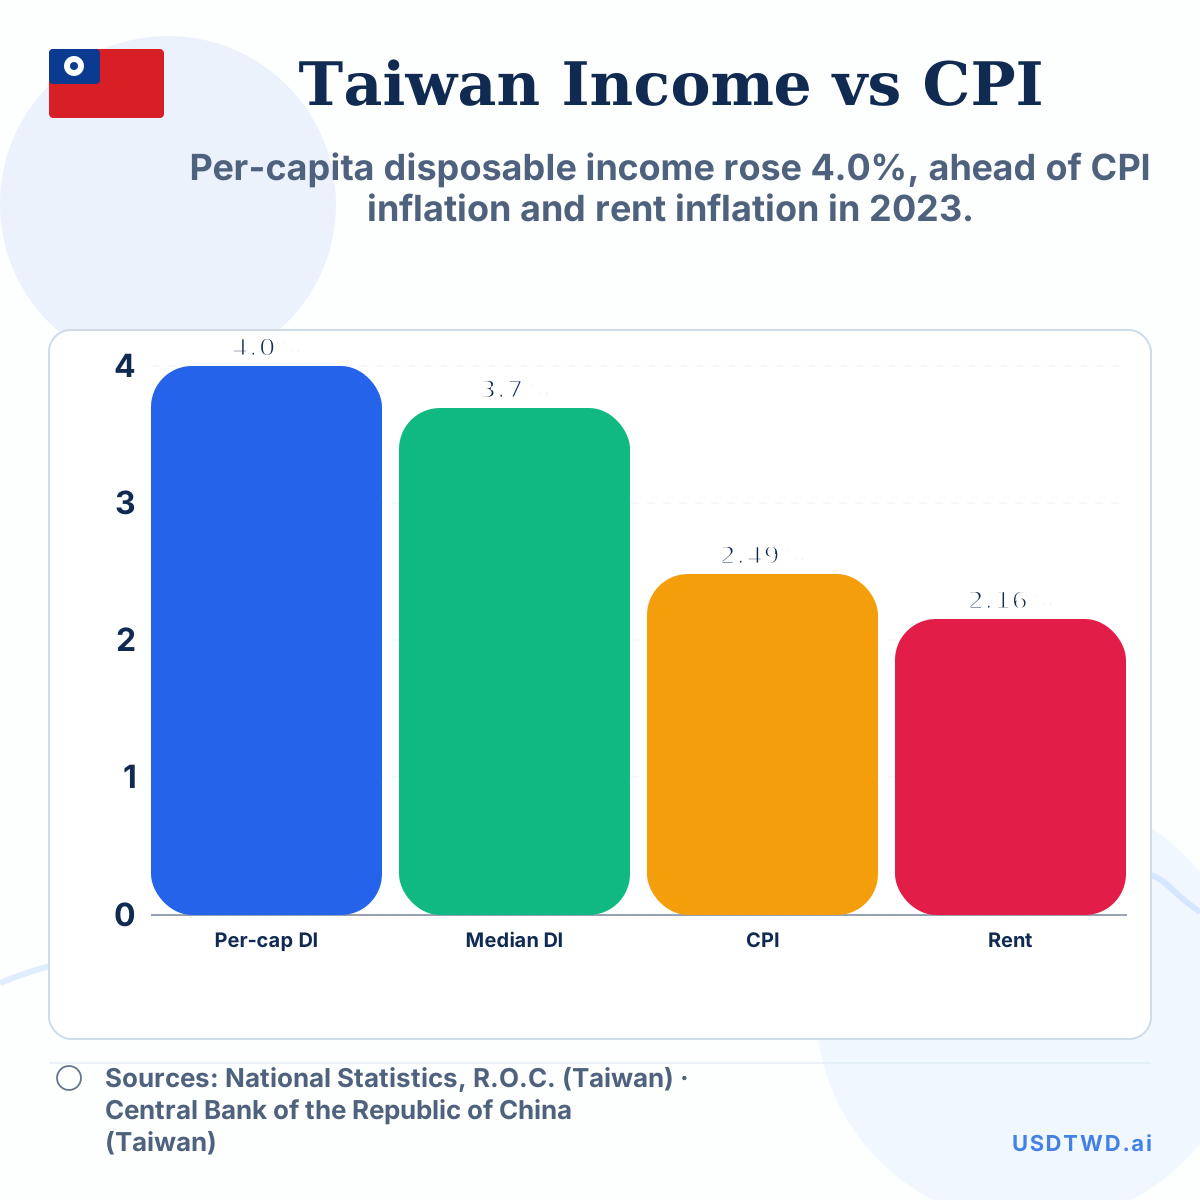
Taiwan Household Disposable Income vs CPI and Rent Pressure, 2023
Per-capita disposable income rose 4.0%, ahead of CPI inflation and rent inflation in 2023.
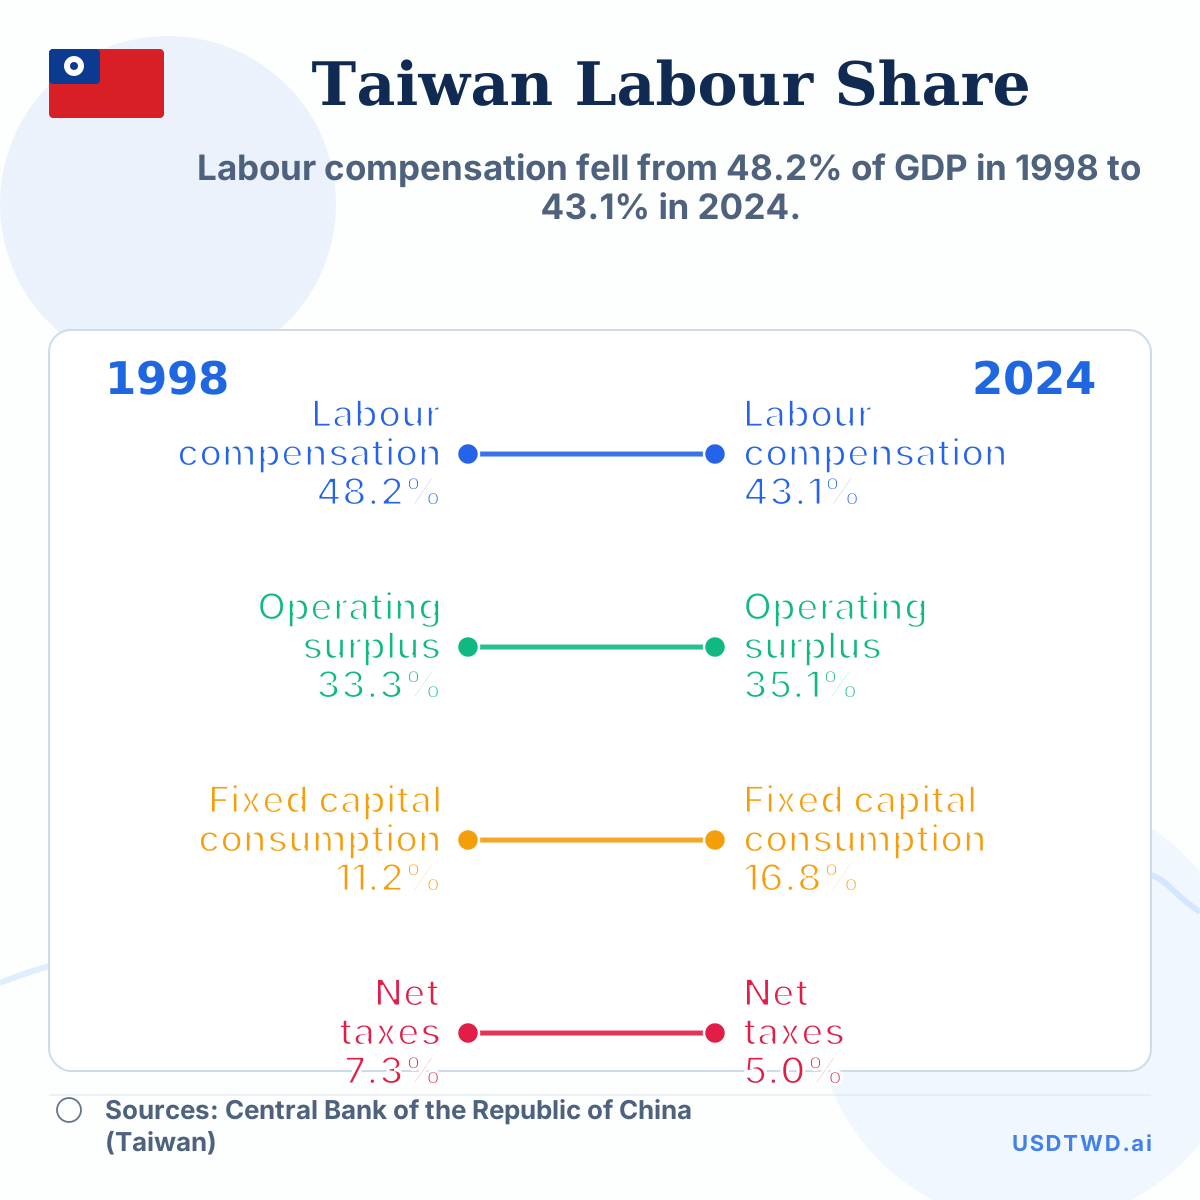
Taiwan Labour Compensation Share vs Operating Surplus, 1998–2024
Labour compensation fell from 48.2% of GDP in 1998 to 43.1% in 2024.
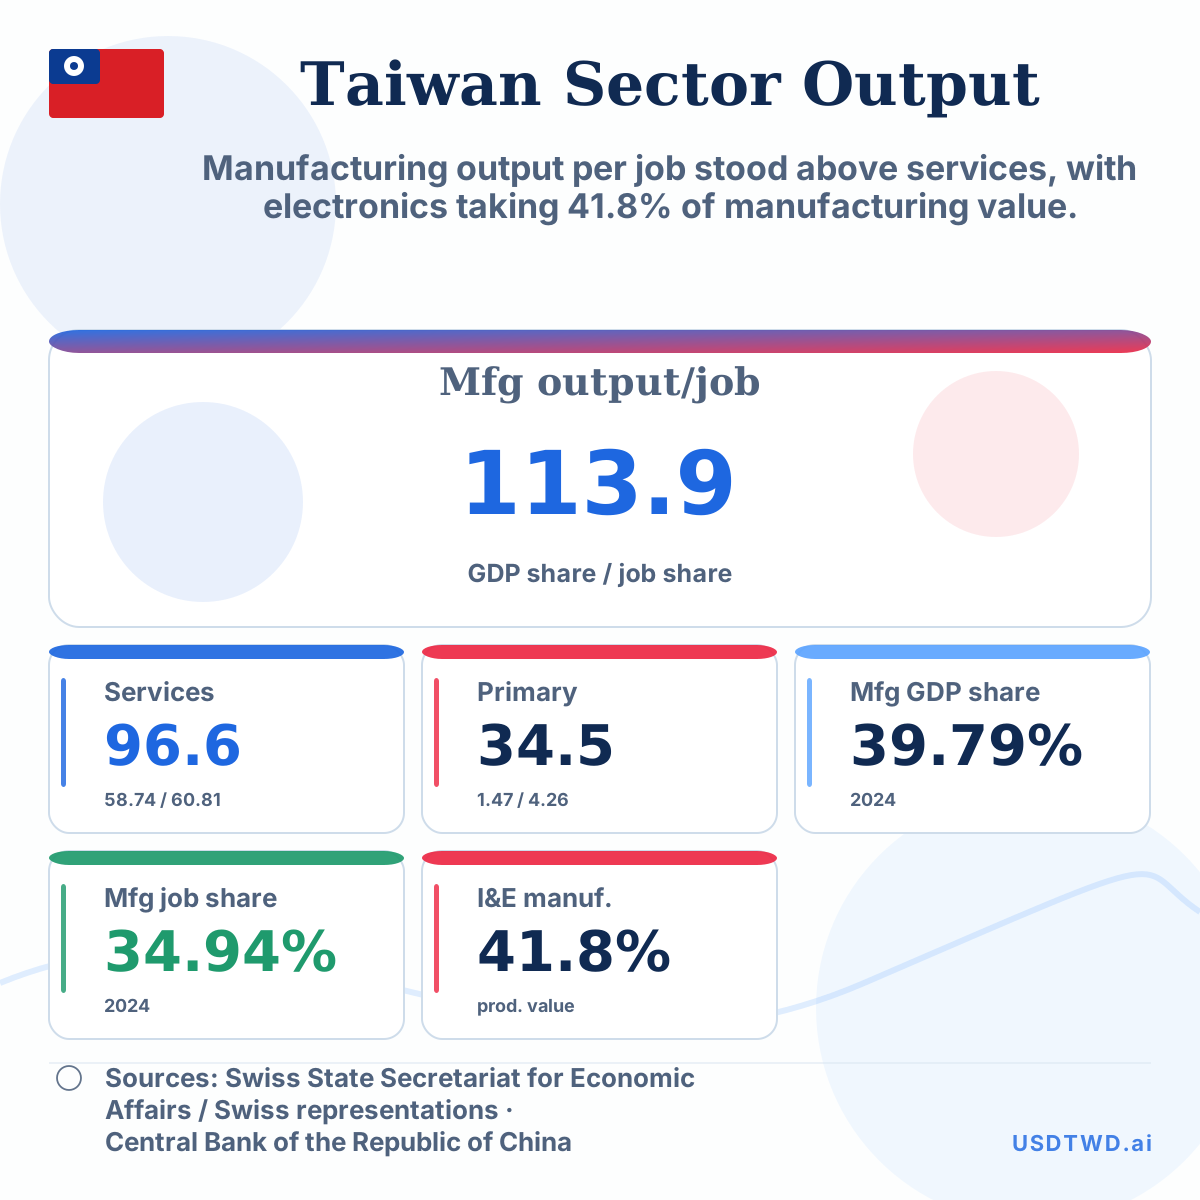
Taiwan Sector Output per Worker, 2024
Manufacturing output per job stood above services, with electronics taking 41.8% of manufacturing value.
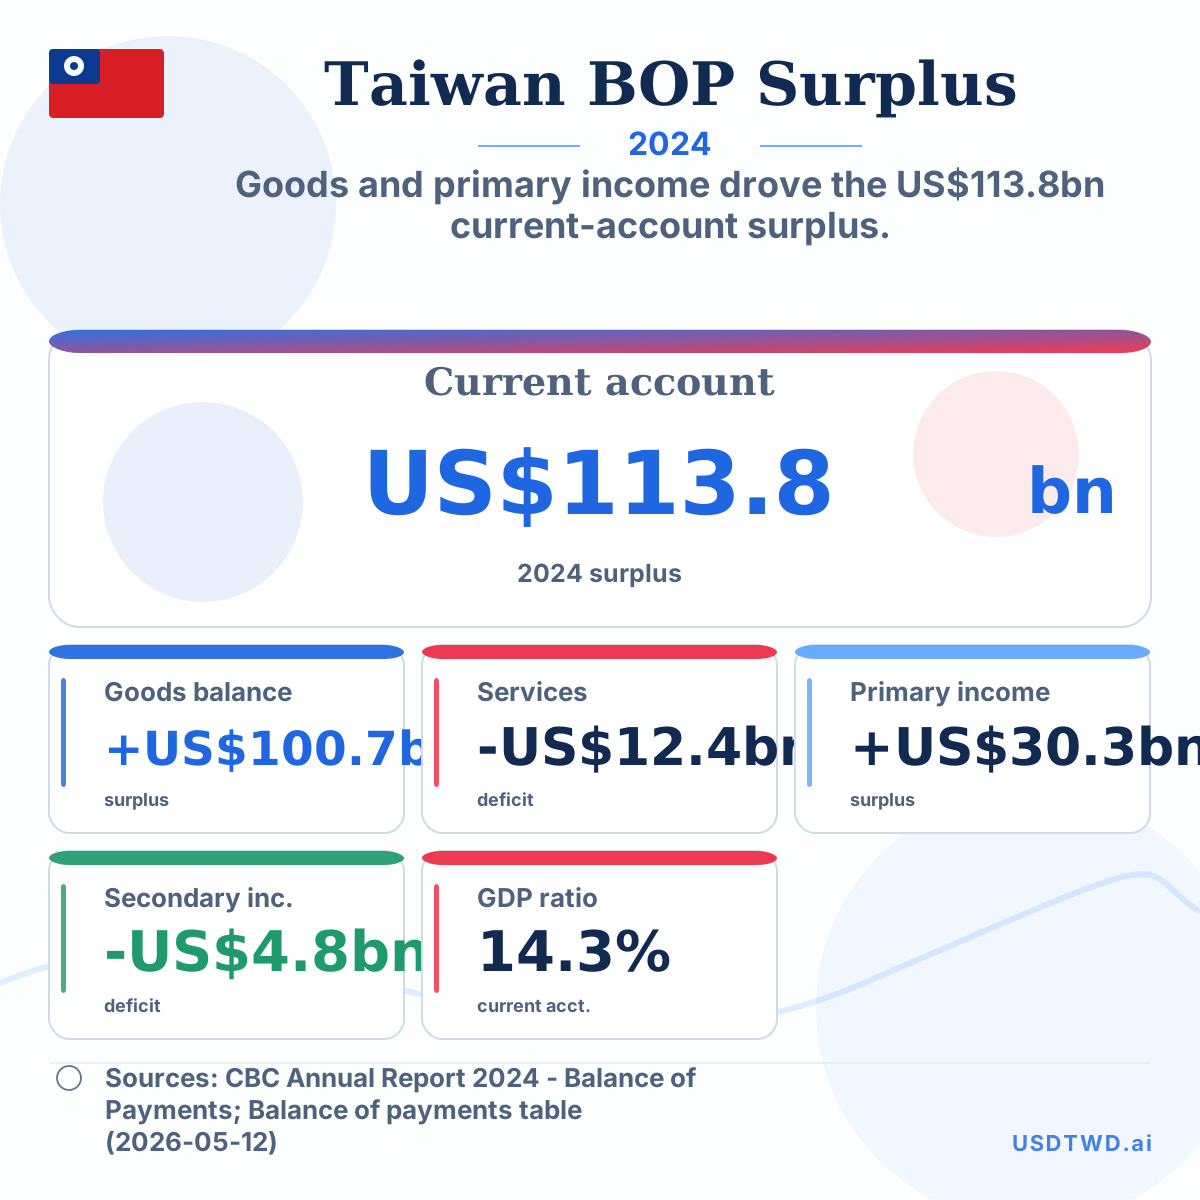
Taiwan Balance-of-Payments Mix, 2024
Goods and primary income drove the US$113.8bn current-account surplus.
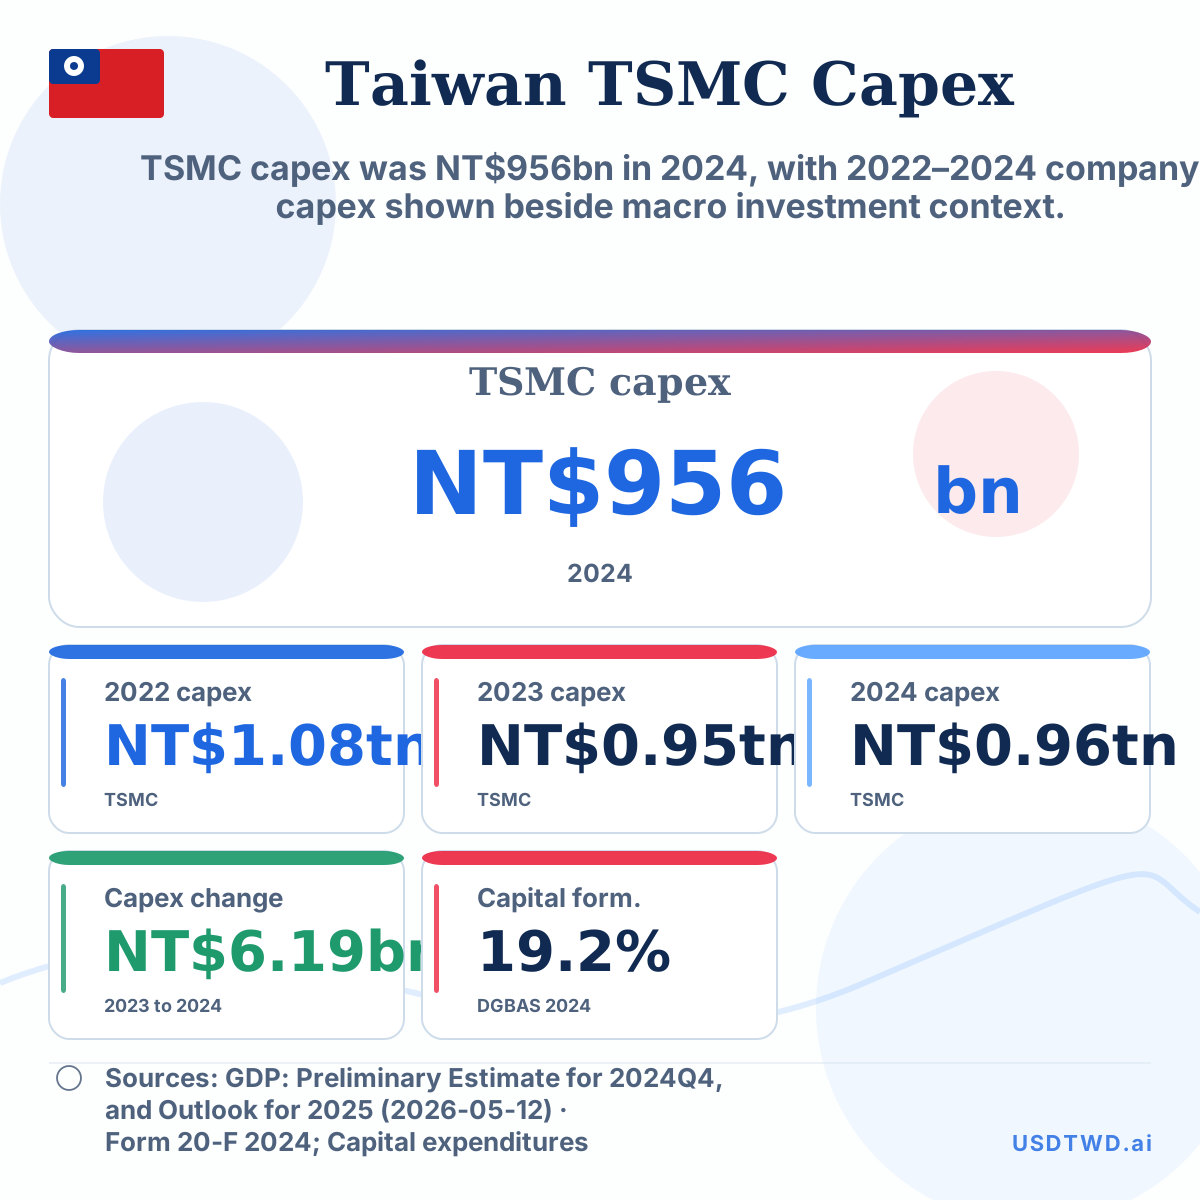
Taiwan TSMC Capex and Investment, 2022–2024
TSMC capex was NT$956bn in 2024, with 2022–2024 company capex shown beside macro investment context.
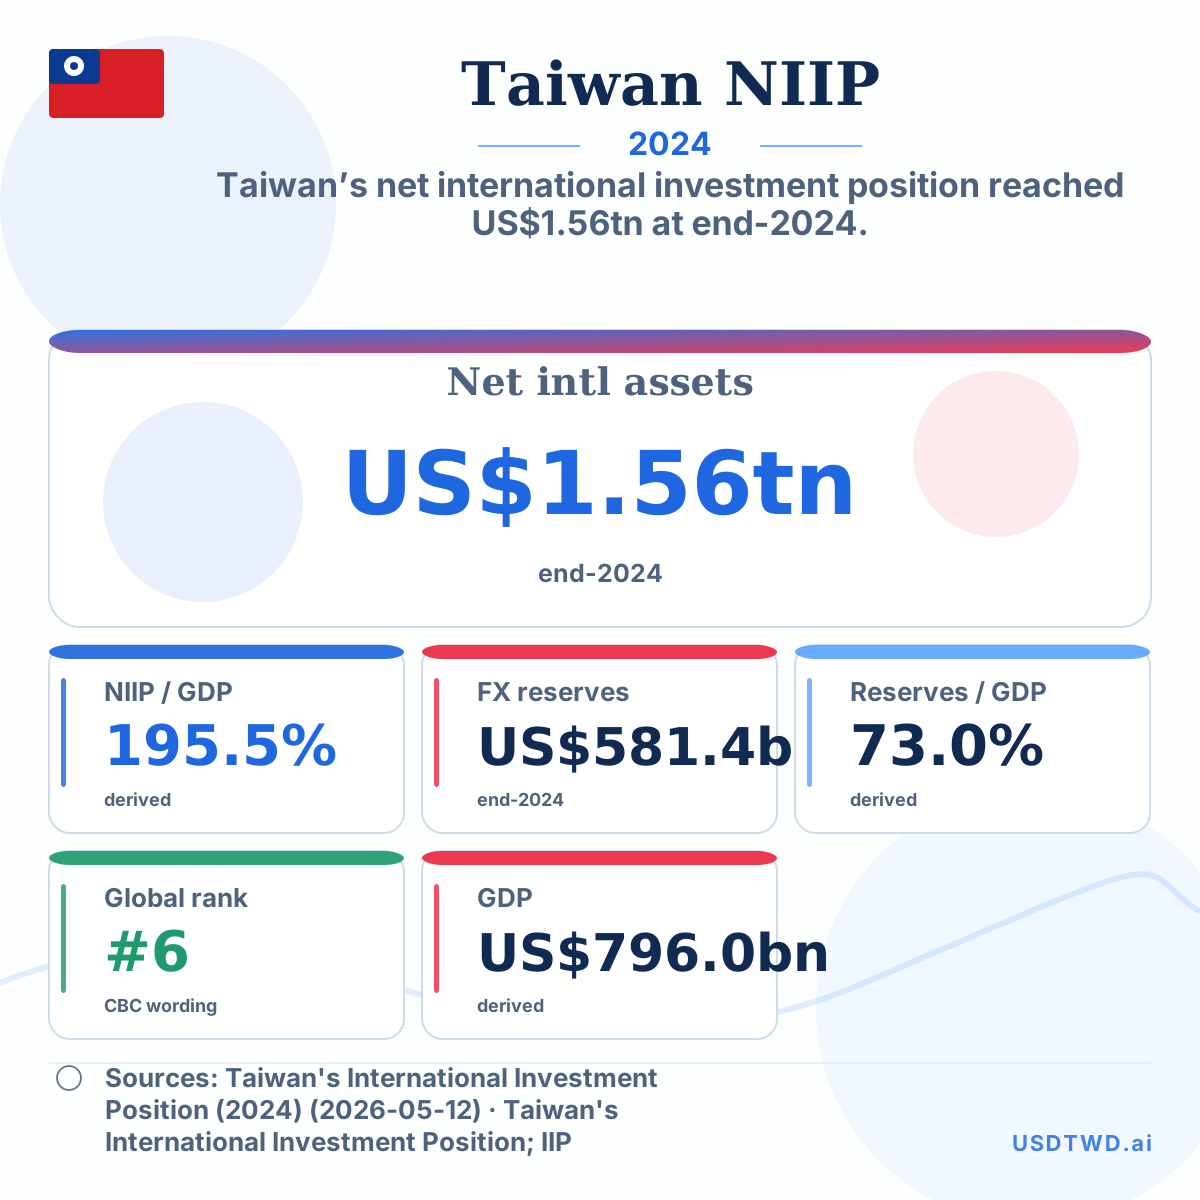
Taiwan Net International Assets vs GDP, 2024
Taiwan’s net international investment position reached US$1.56tn at end-2024.
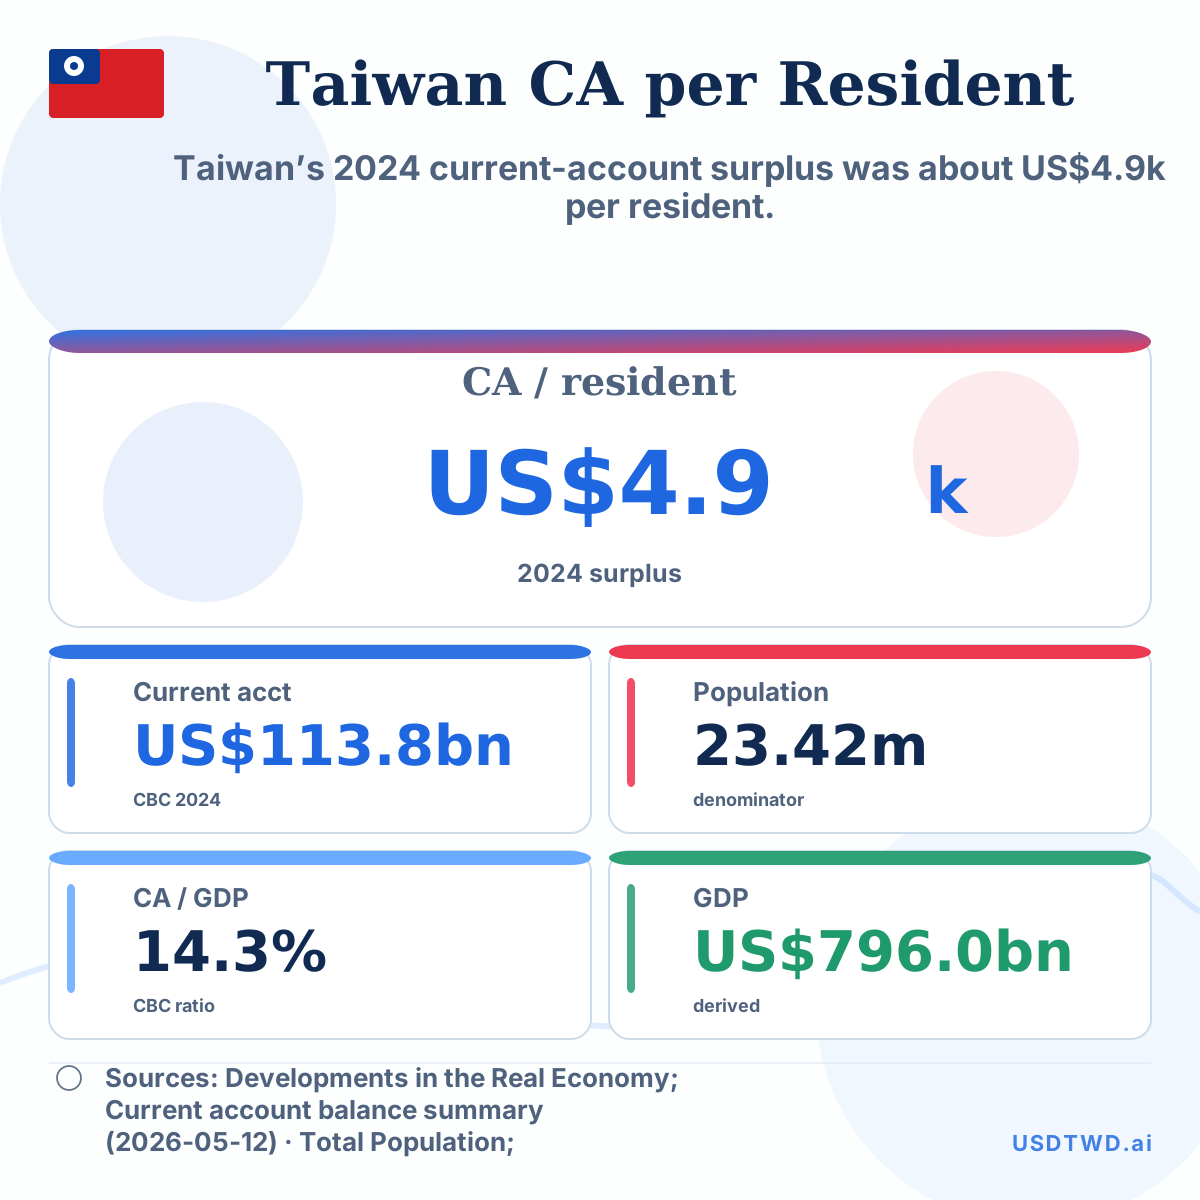
Taiwan Current-Account Surplus per Resident, 2024
Taiwan’s 2024 current-account surplus was about US$4.9k per resident.
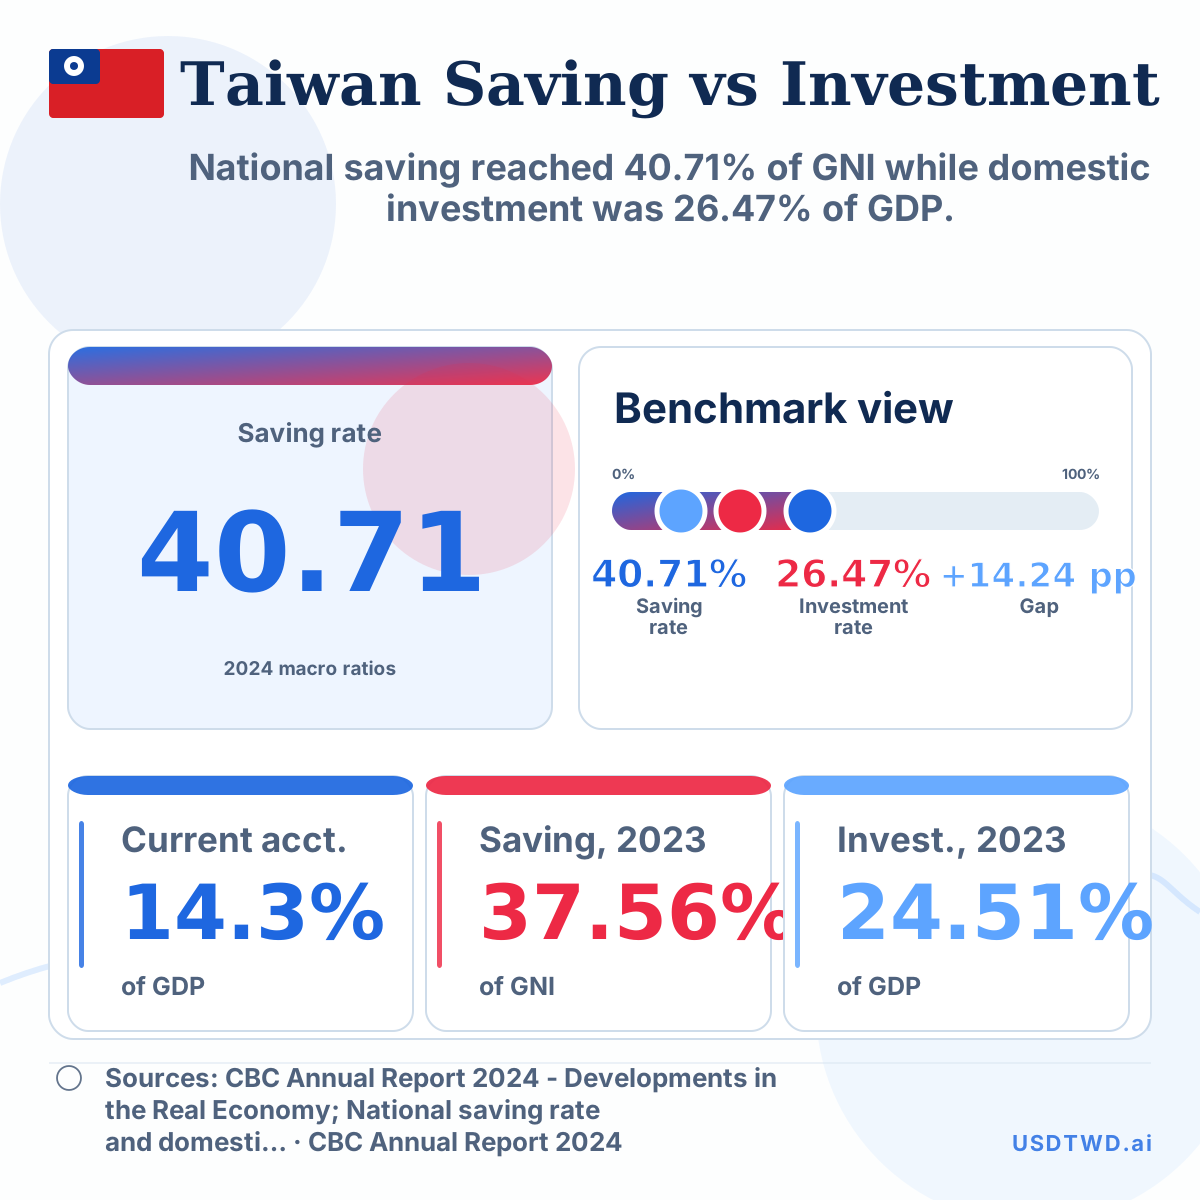
Taiwan Saving vs Investment Gap, 2024
National saving reached 40.71% of GNI while domestic investment was 26.47% of GDP.