Sources
Source 1: 2026 Taiwan Analysis Brief
Publisher: U.S. Energy Information Administration
Dataset/table: Figure 14: Taiwan's liquefied natural gas imports by source, 2025
Units: shares; barrels per day; short tons; billion cubic feet, depending figure
Date checked: 2026-05-14
Evidence: Supports Taiwan's 2025 LNG source shares and the over-1.1 Tcf import context.
Note: Supports Taiwan's 2025 LNG source shares and the over-1.1 Tcf import context.
Source 2: Figure 14 workbook: Taiwan LNG imports by source, 2025
Publisher: U.S. Energy Information Administration
Dataset/table: Taiwan_CAB_Fig14.xlsx
Units: percent of LNG imports
Date checked: 2026-05-14
Evidence: Supports exact supplier-share values for the leaderboard.
Note: Supports exact supplier-share values for the leaderboard.
Source 3: Energy Statistics Handbook: Various Forms of Energy statistical tables
Publisher: Energy Administration, Ministry of Economic Affairs, R.O.C.
Dataset/table: Sources of Imported Crude Oil; Sources of Imported LNG; Sources of Imported Coal
Units: physical energy units and source-country tables
Date checked: 2026-05-14
Evidence: Provides the official Taiwan Energy Administration route for annual sources of imported LNG tables.
Note: Provides the official Taiwan Energy Administration route for annual sources of imported LNG tables.

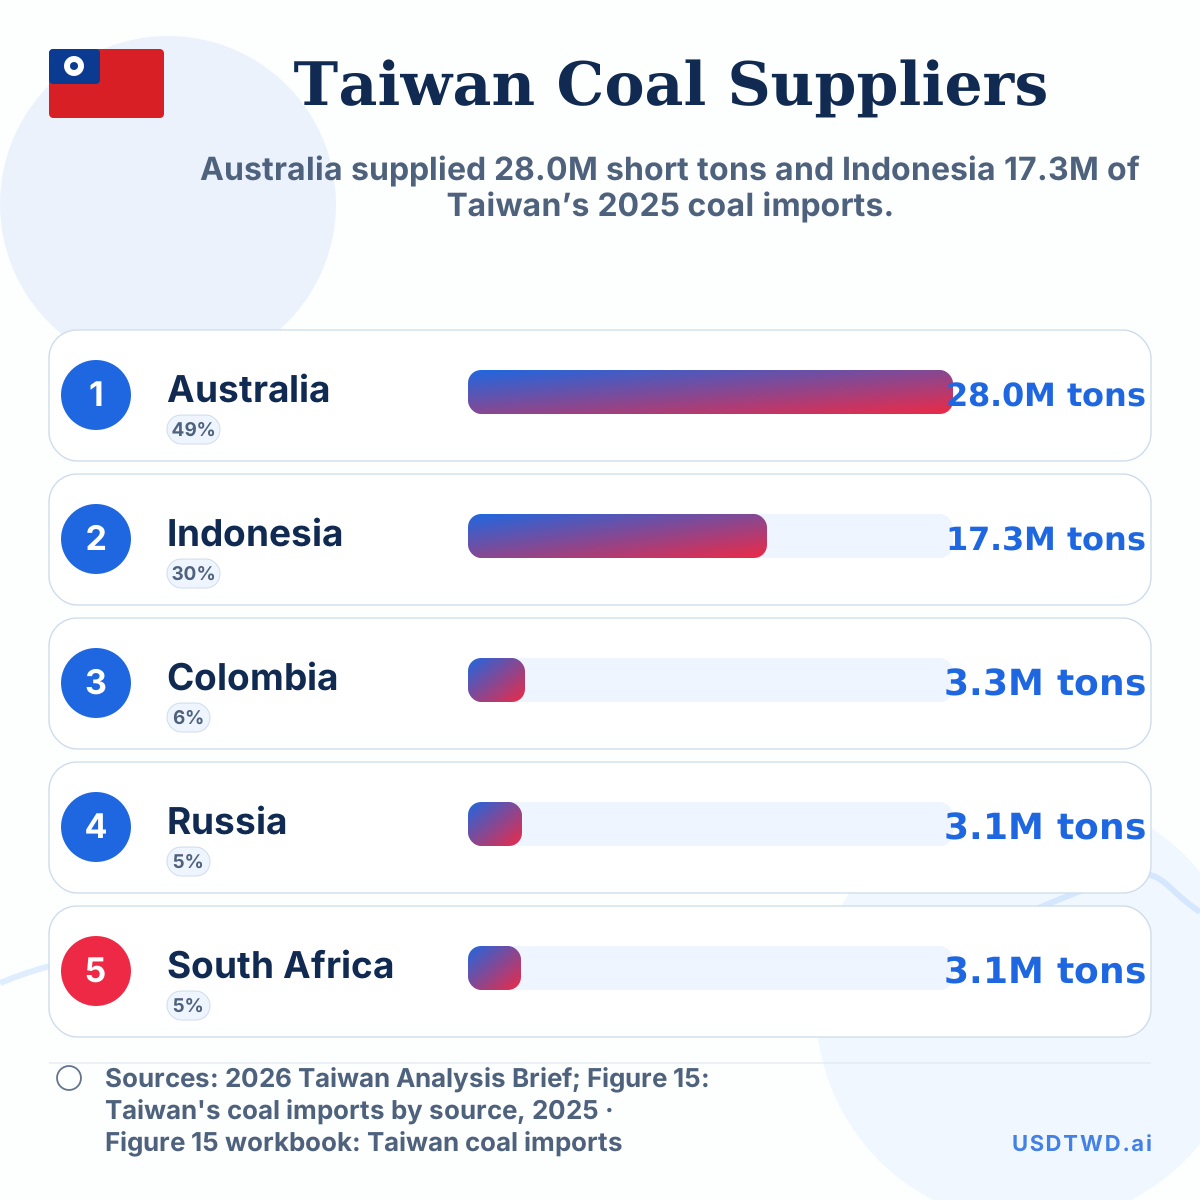 Taiwan’s 5 largest coal suppliers
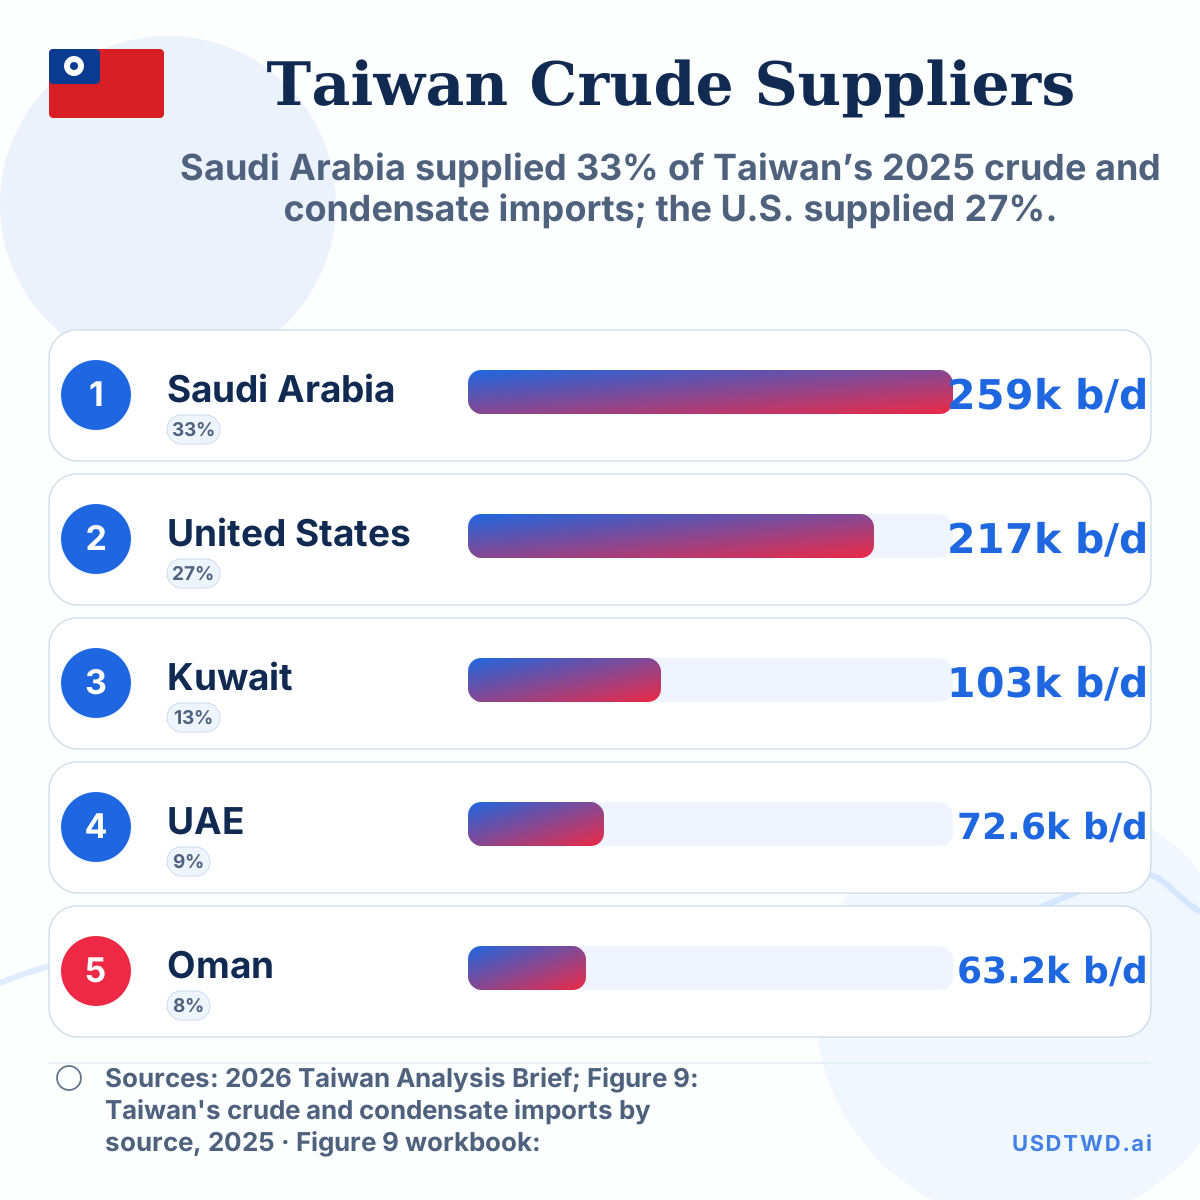 Taiwan’s 5 largest crude oil suppliers
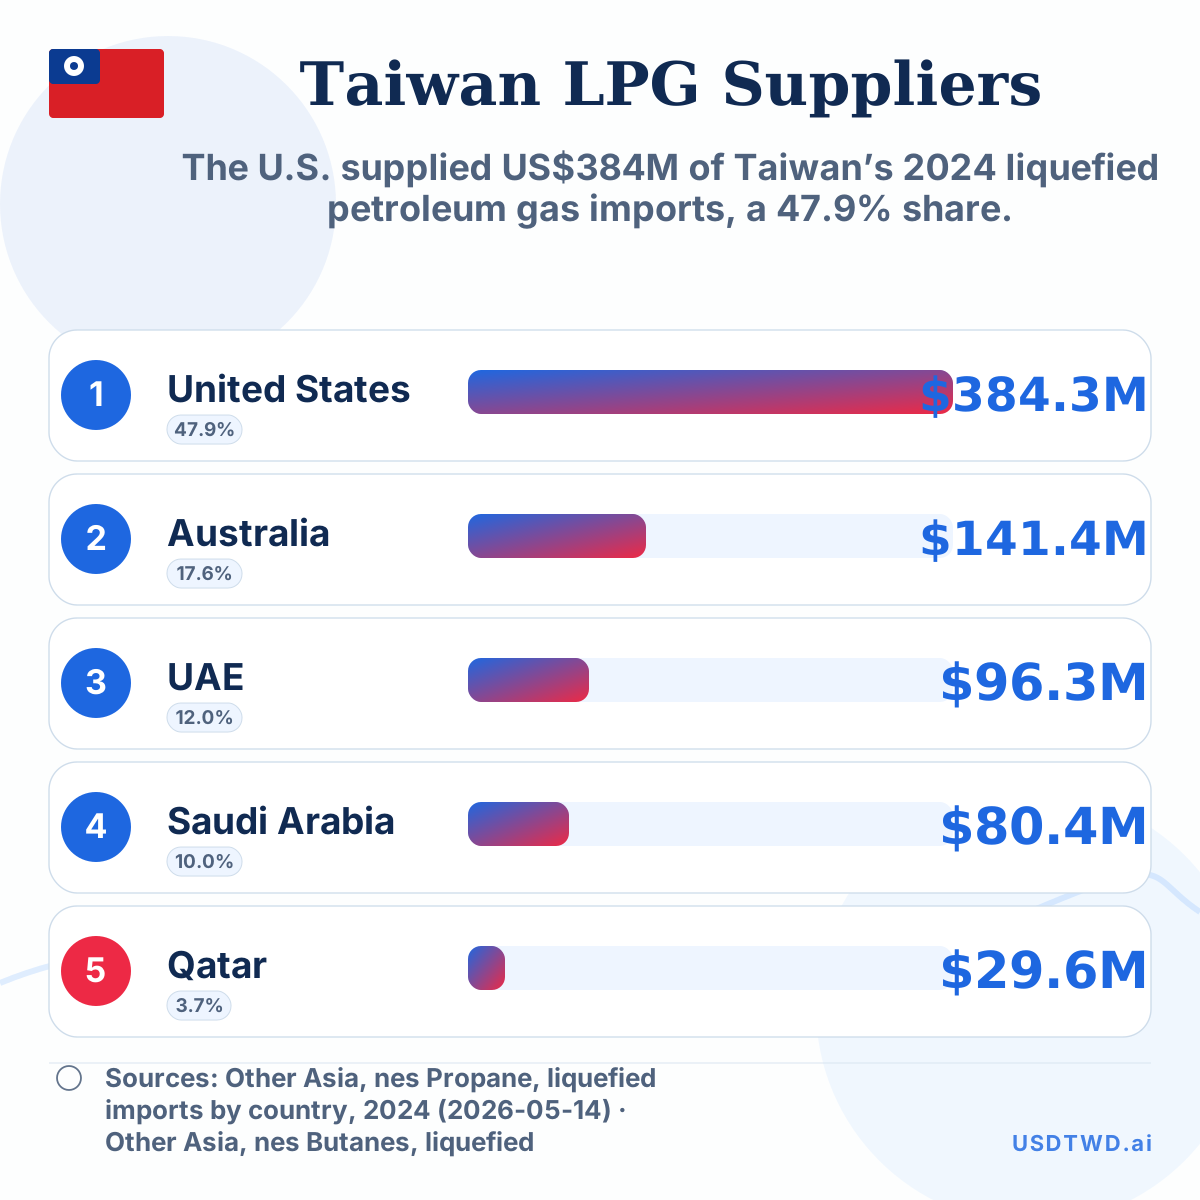 Taiwan’s 5 largest liquefied petroleum gas suppliers