
Stat Graphics Library
Browse source-labelled FX, economy, market, demographic, social, technology, culture, health and government graphics by category, source and reusable visual format.
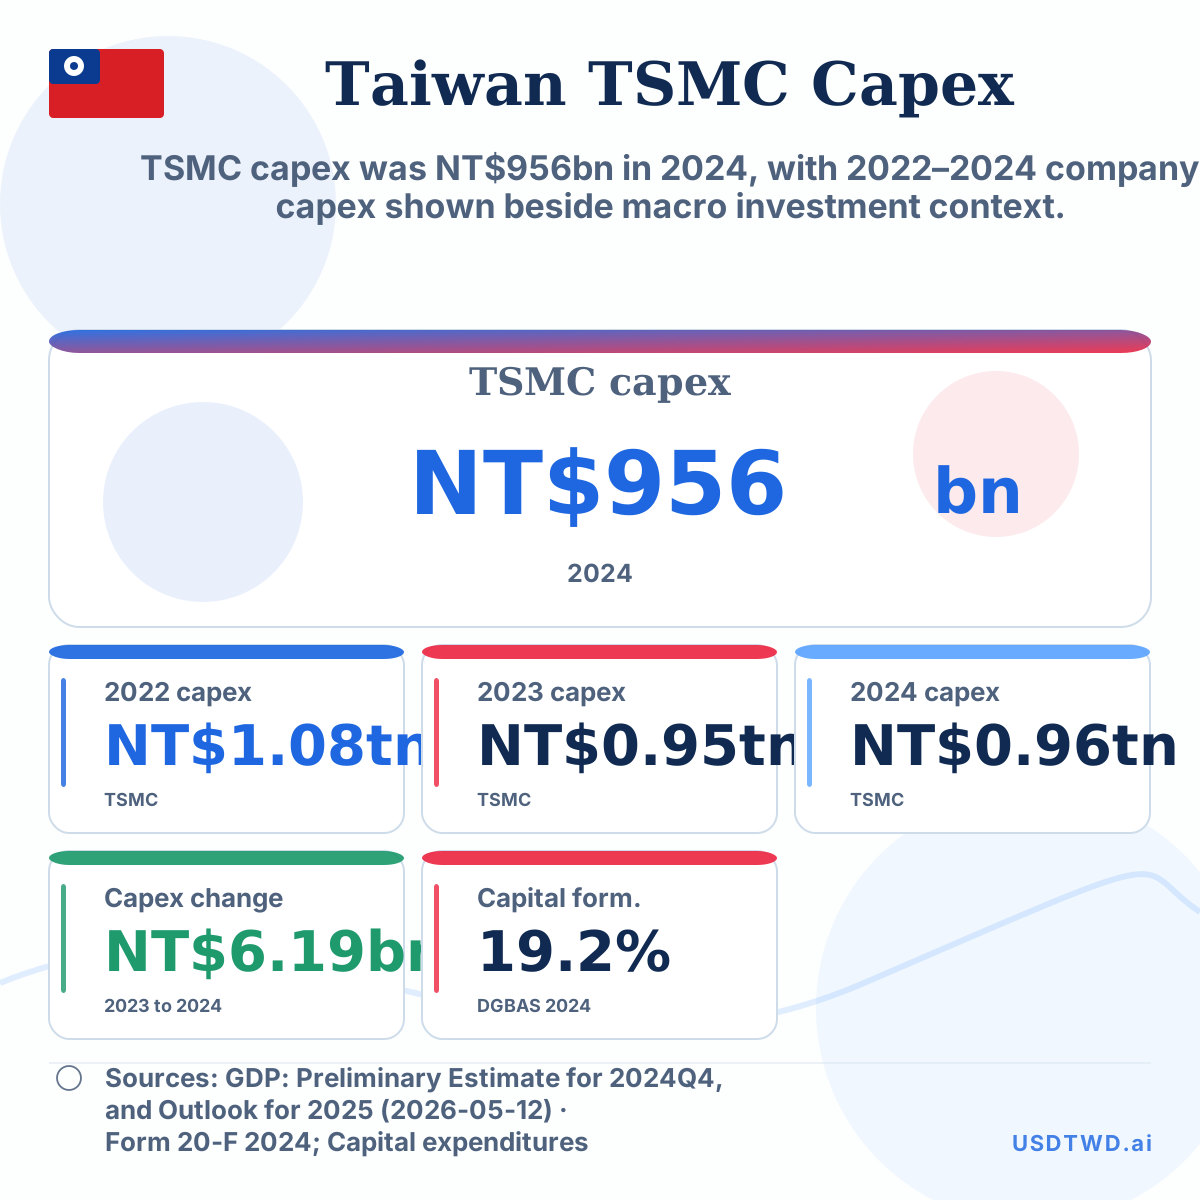
Taiwan TSMC Capex and Investment, 2022–2024
TSMC capex was NT$956bn in 2024, with 2022–2024 company capex shown beside macro investment context.
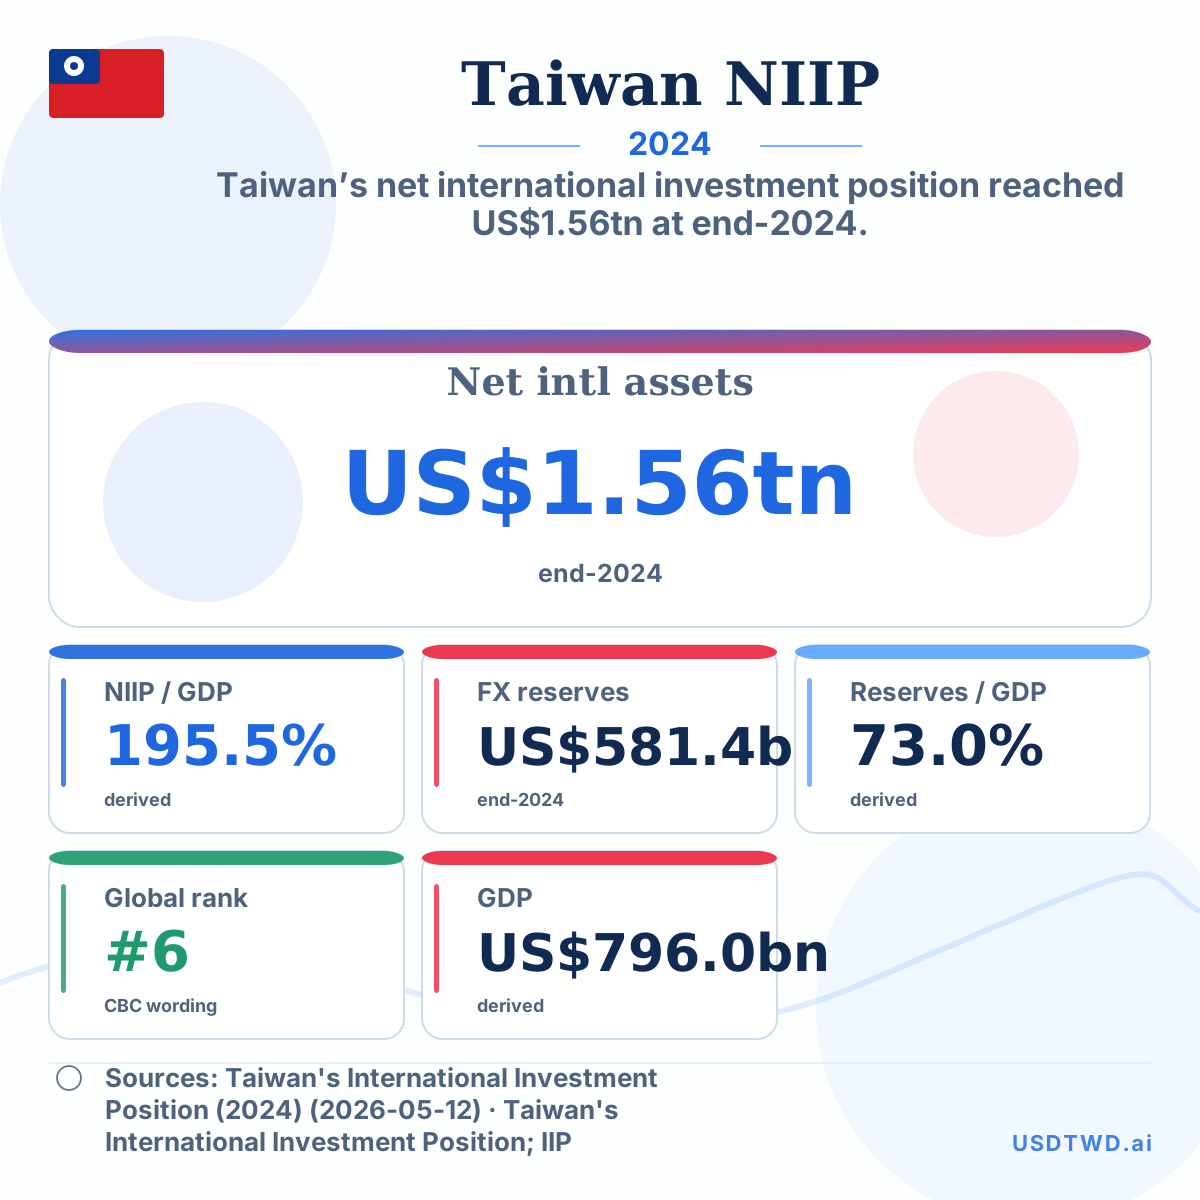
Taiwan Net International Assets vs GDP, 2024
Taiwan’s net international investment position reached US$1.56tn at end-2024.
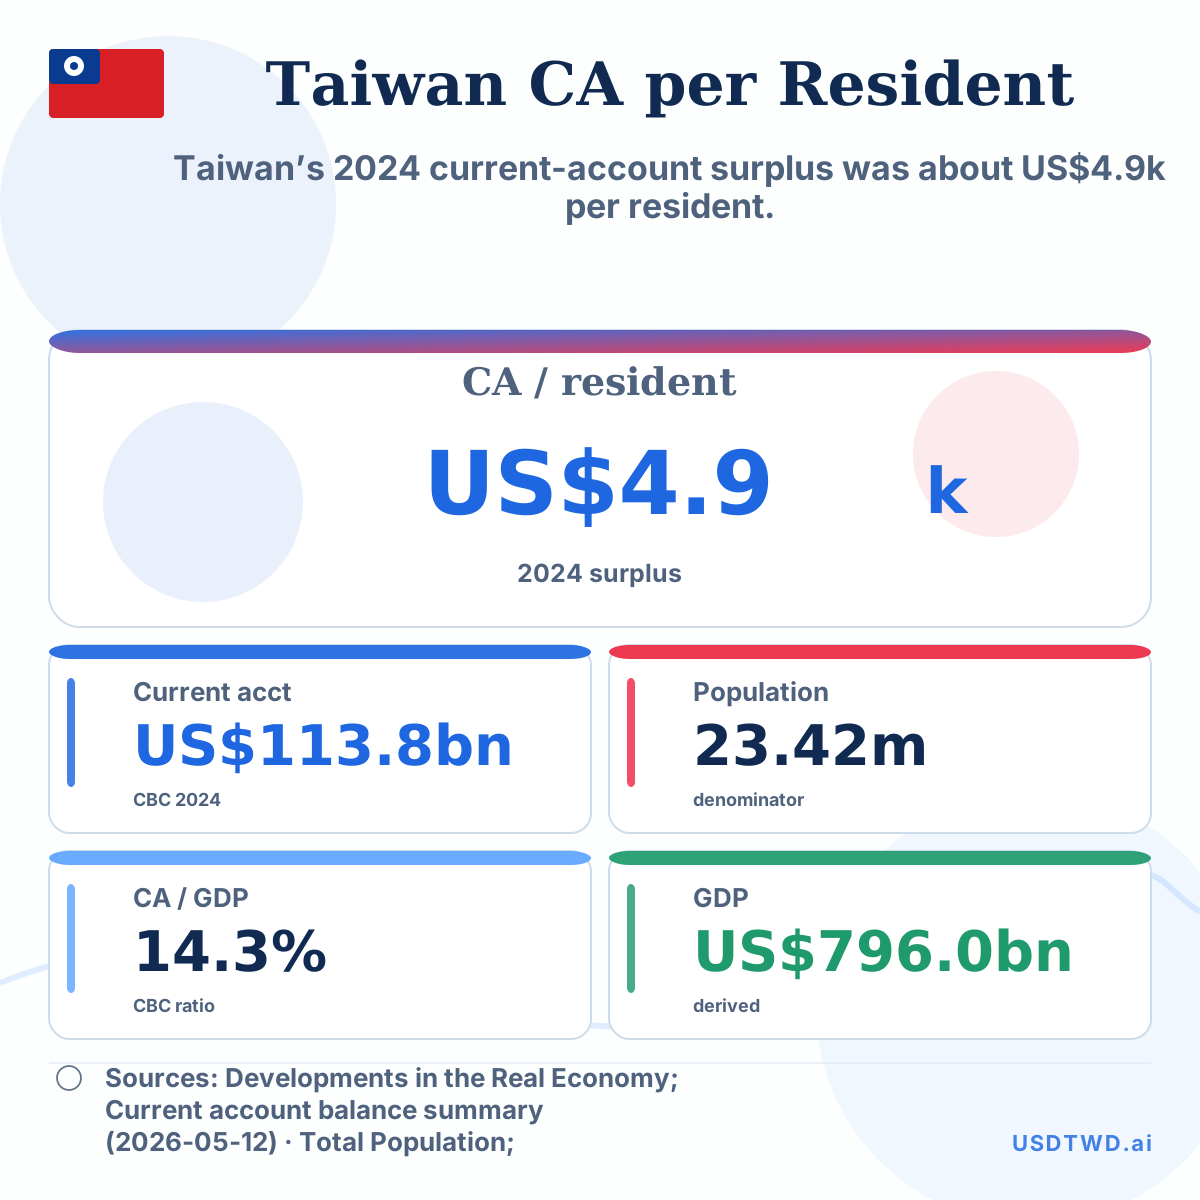
Taiwan Current-Account Surplus per Resident, 2024
Taiwan’s 2024 current-account surplus was about US$4.9k per resident.
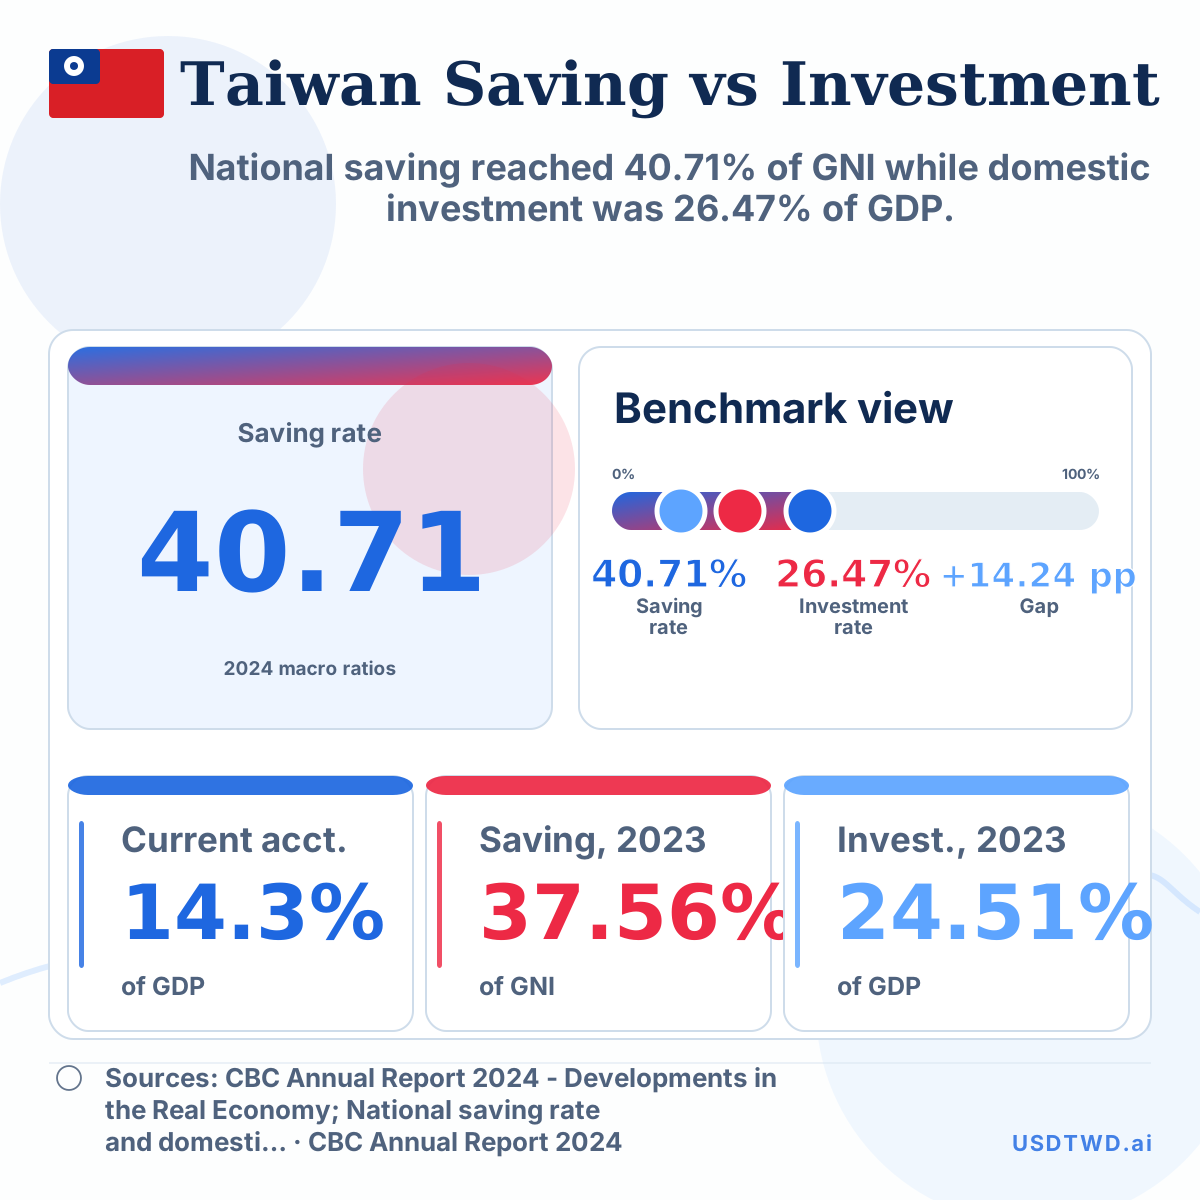
Taiwan Saving vs Investment Gap, 2024
National saving reached 40.71% of GNI while domestic investment was 26.47% of GDP.
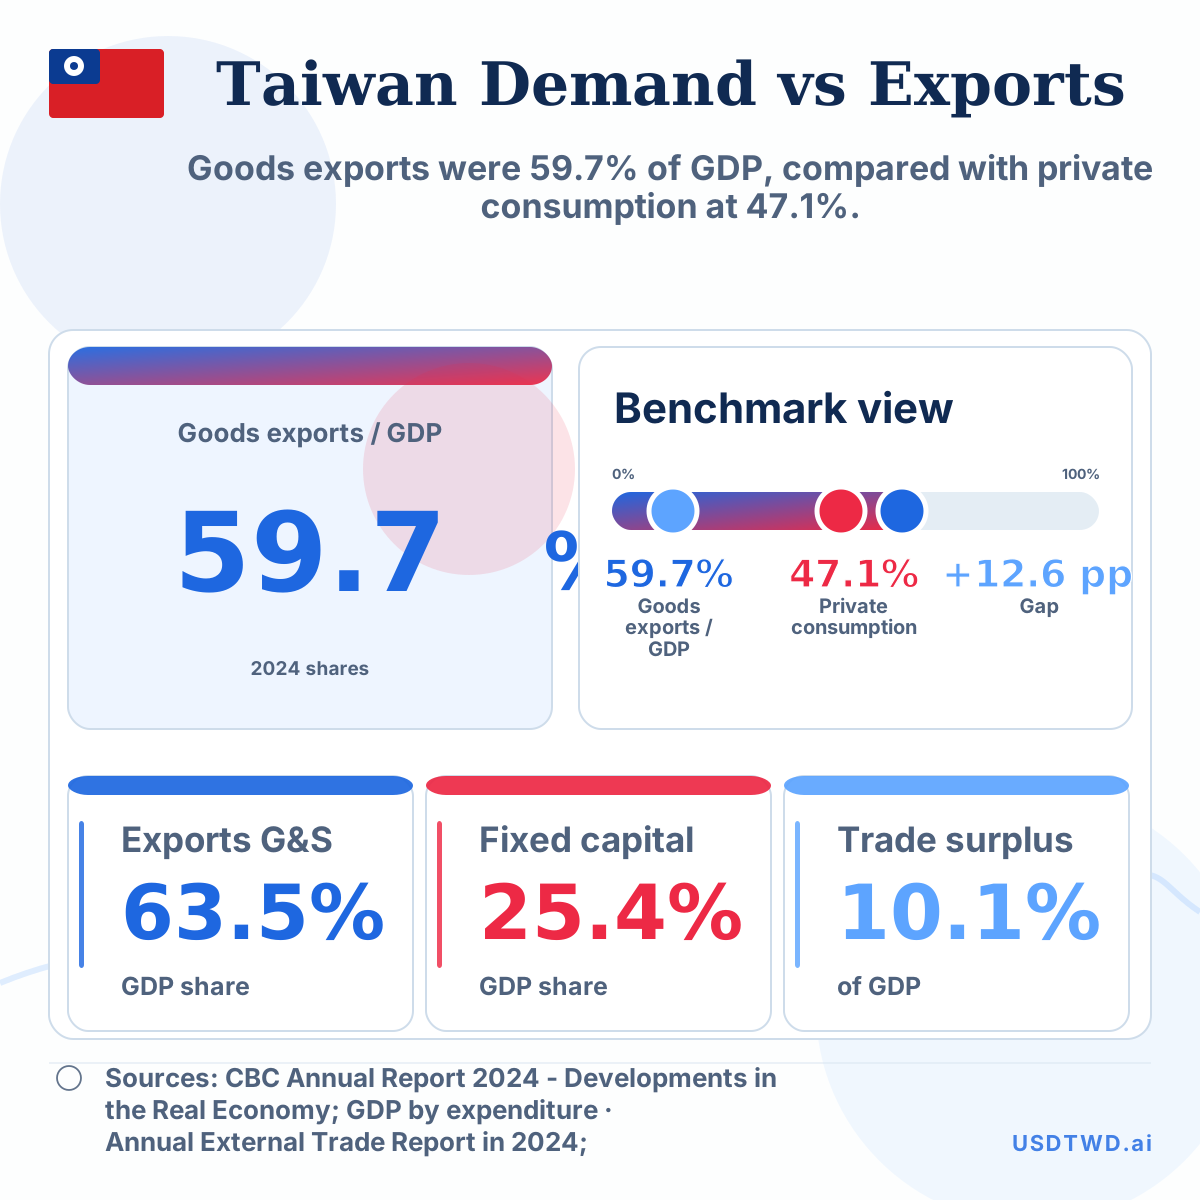
Taiwan Consumption vs Goods Exports, 2024
Goods exports were 59.7% of GDP, compared with private consumption at 47.1%.
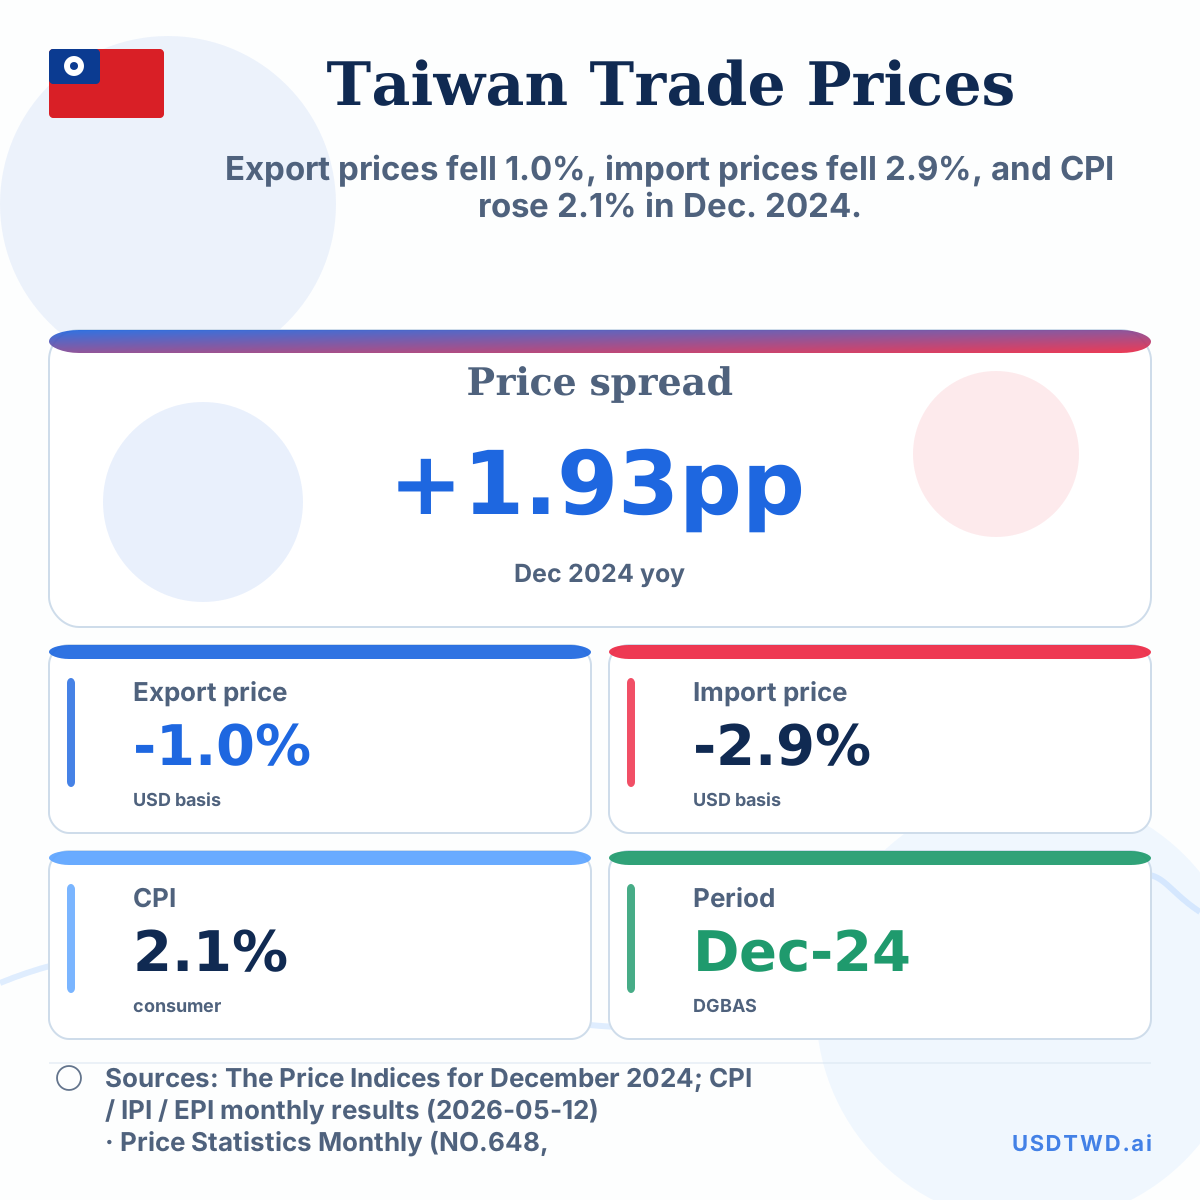
Taiwan Trade Prices and CPI, Dec 2024
Export prices fell 1.0%, import prices fell 2.9%, and CPI rose 2.1% in Dec. 2024.
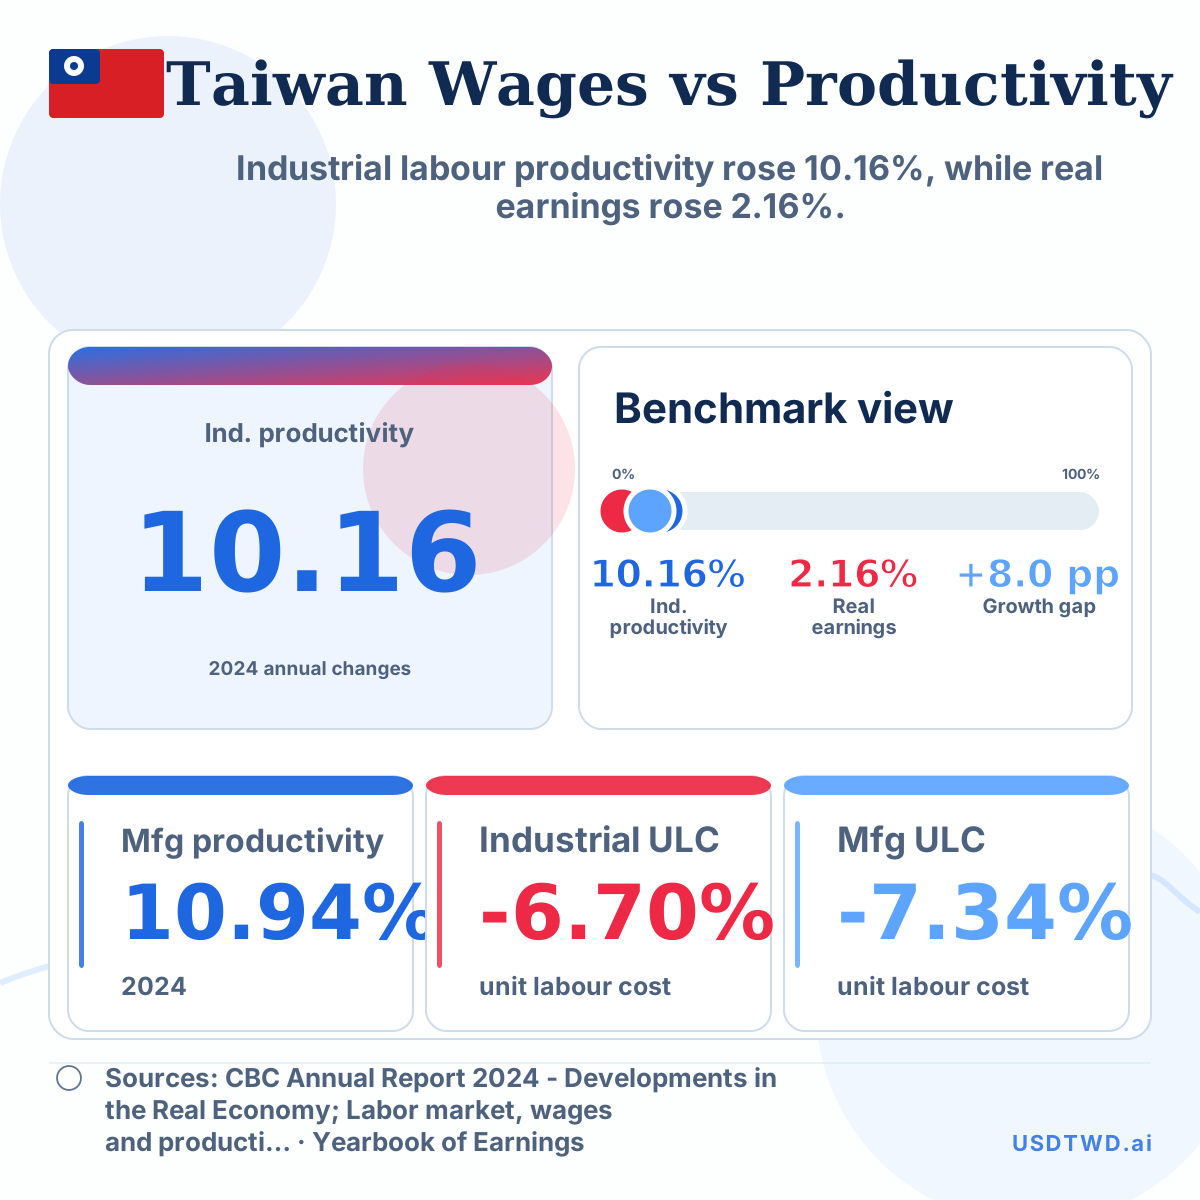
Taiwan Wages vs Productivity Growth, 2024
Industrial labour productivity rose 10.16%, while real earnings rose 2.16%.
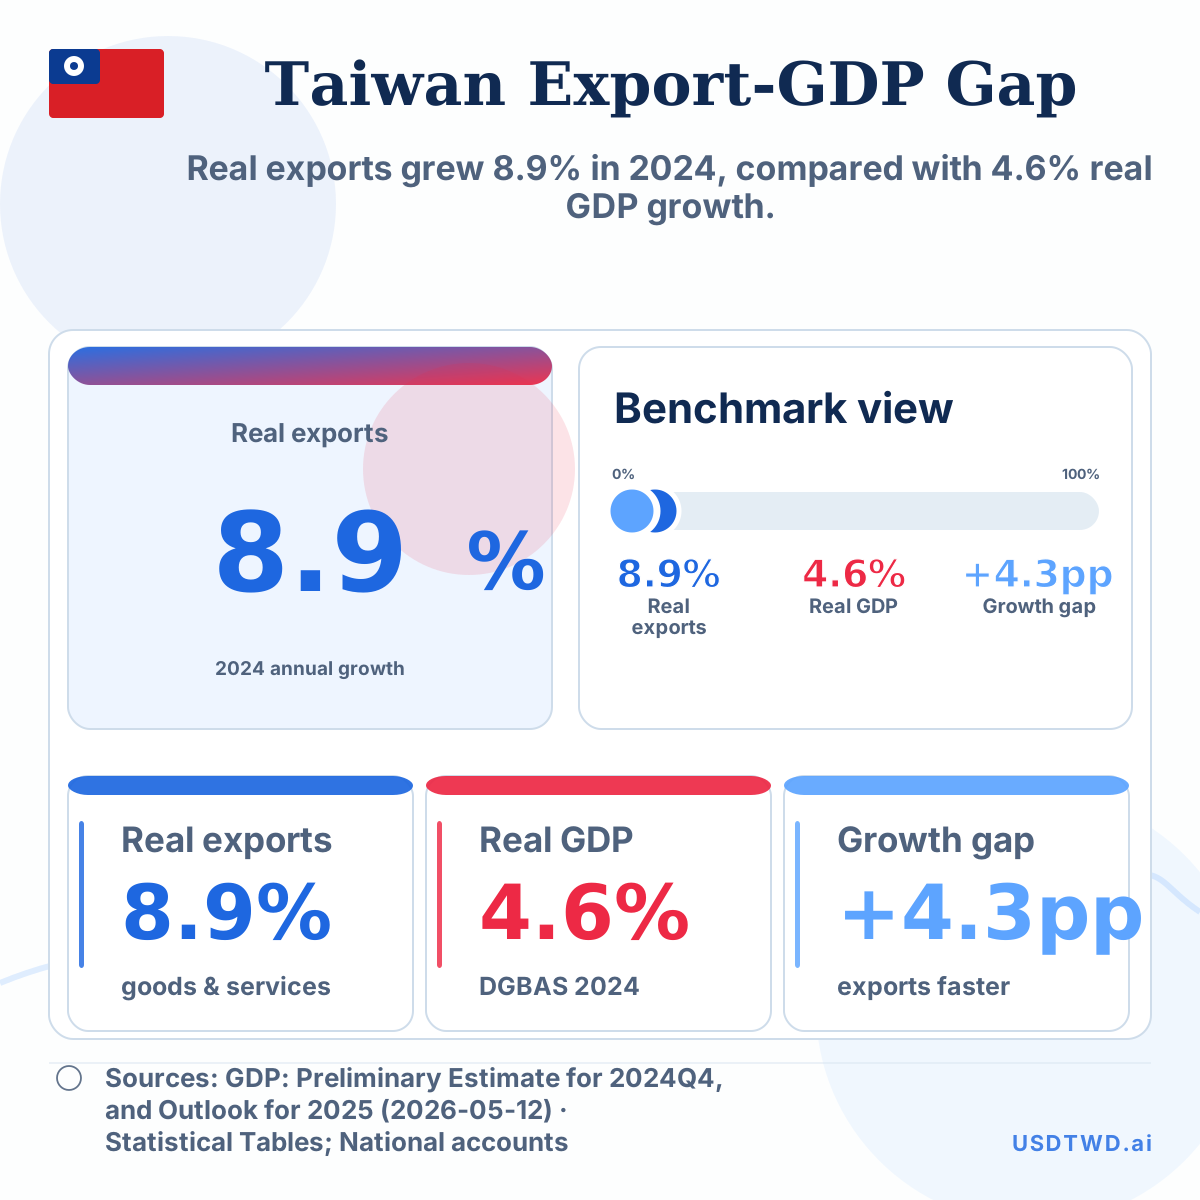
Taiwan Export Growth vs GDP Growth, 2024
Real exports grew 8.9% in 2024, compared with 4.6% real GDP growth.
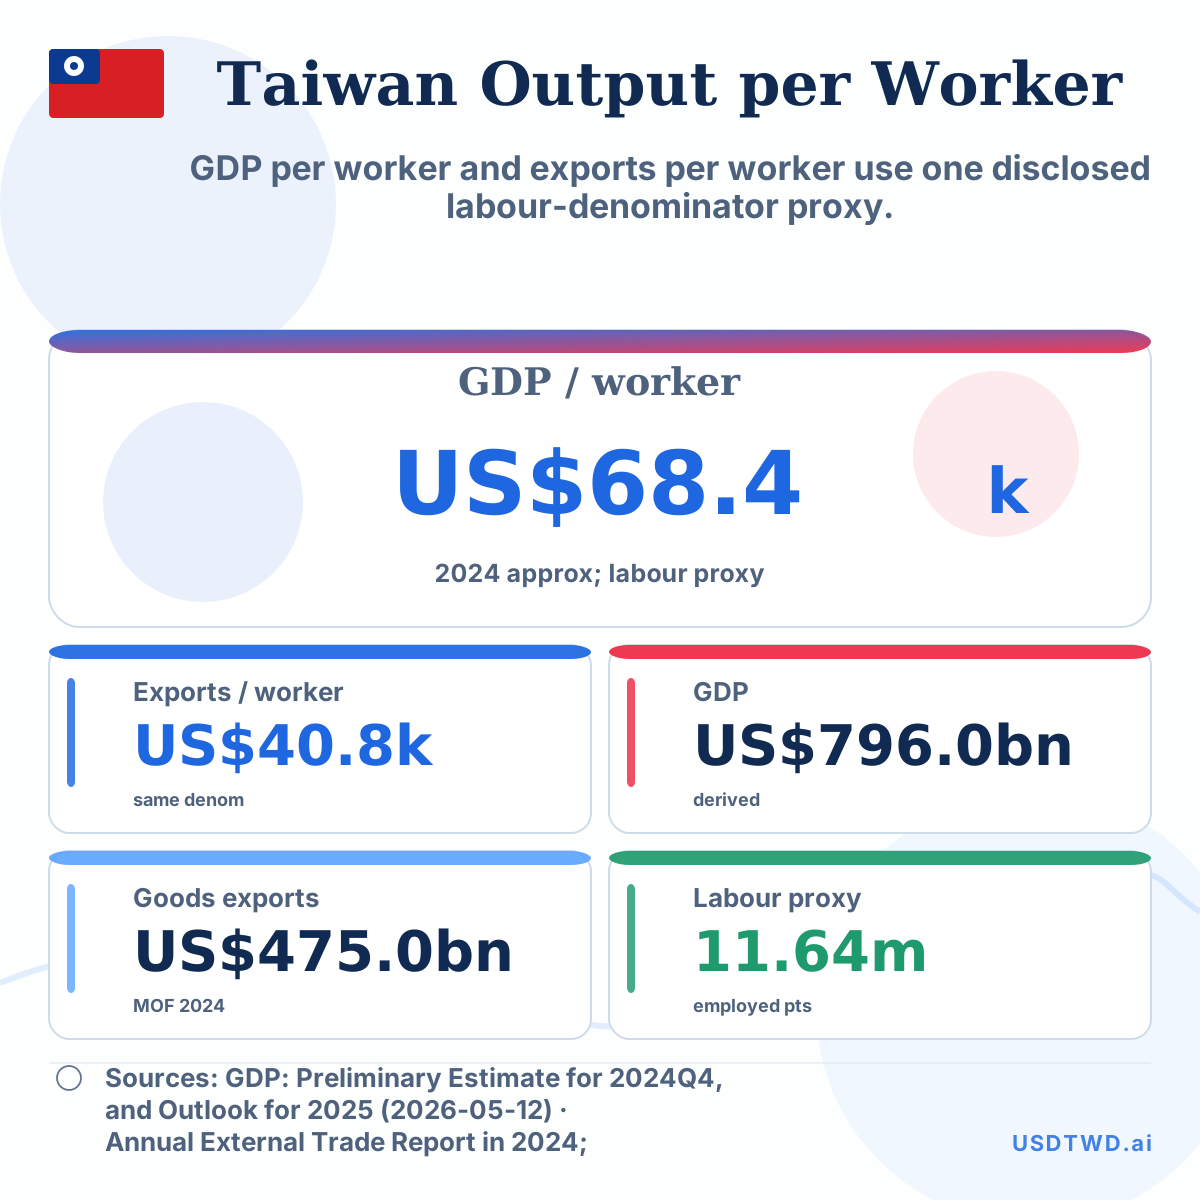
Taiwan GDP and Exports per Worker, 2024
GDP per worker and exports per worker use one disclosed labour-denominator proxy.
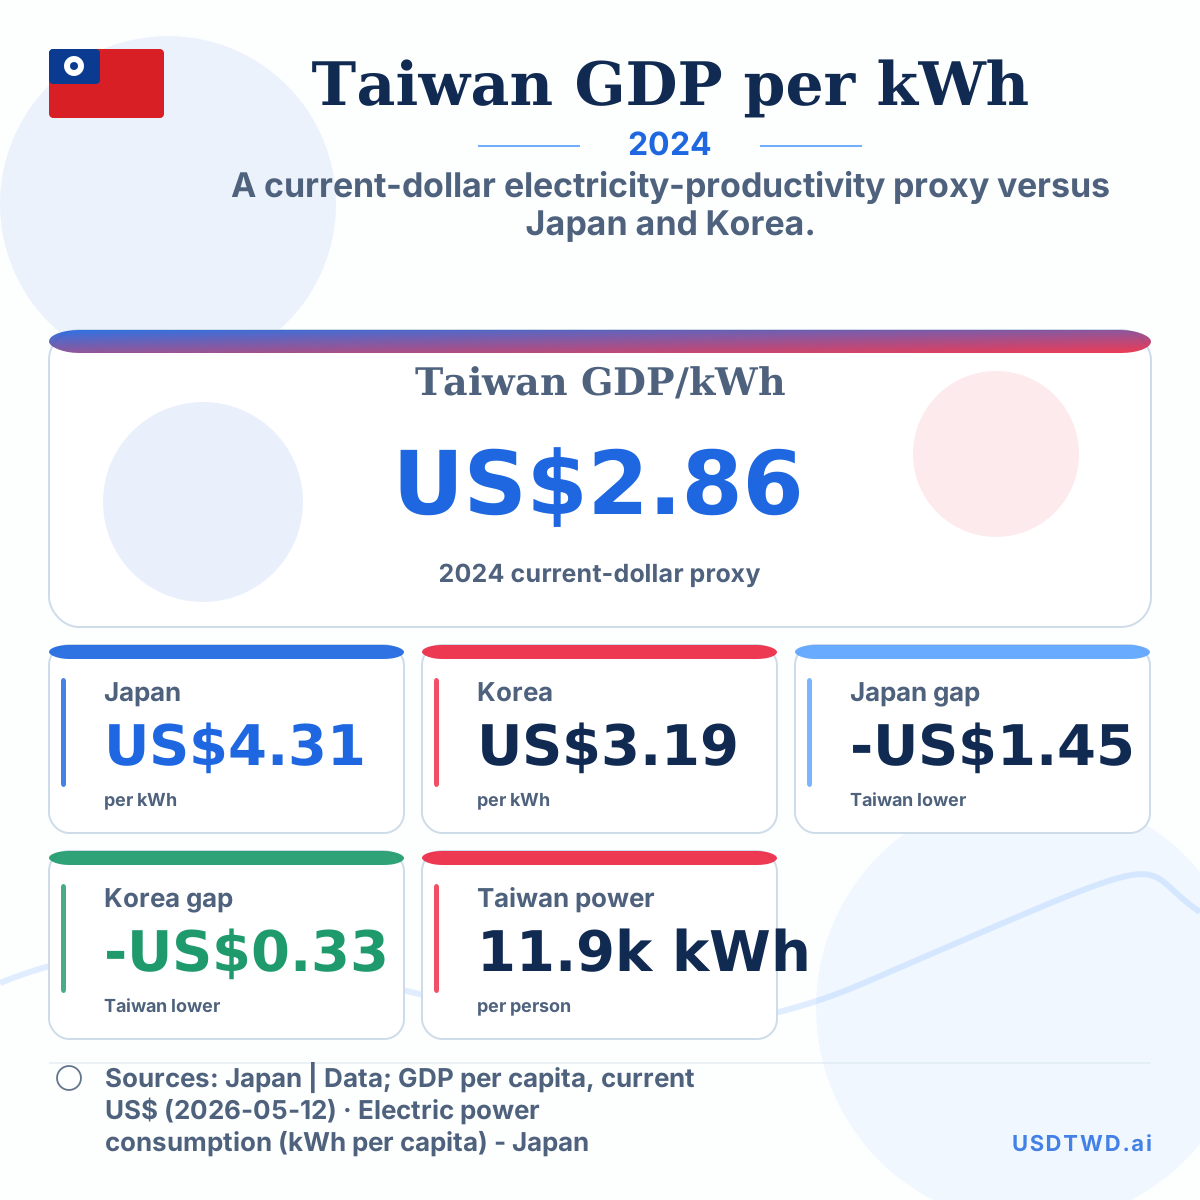
Taiwan GDP per kWh vs Japan and Korea, 2024
A current-dollar electricity-productivity proxy versus Japan and Korea.
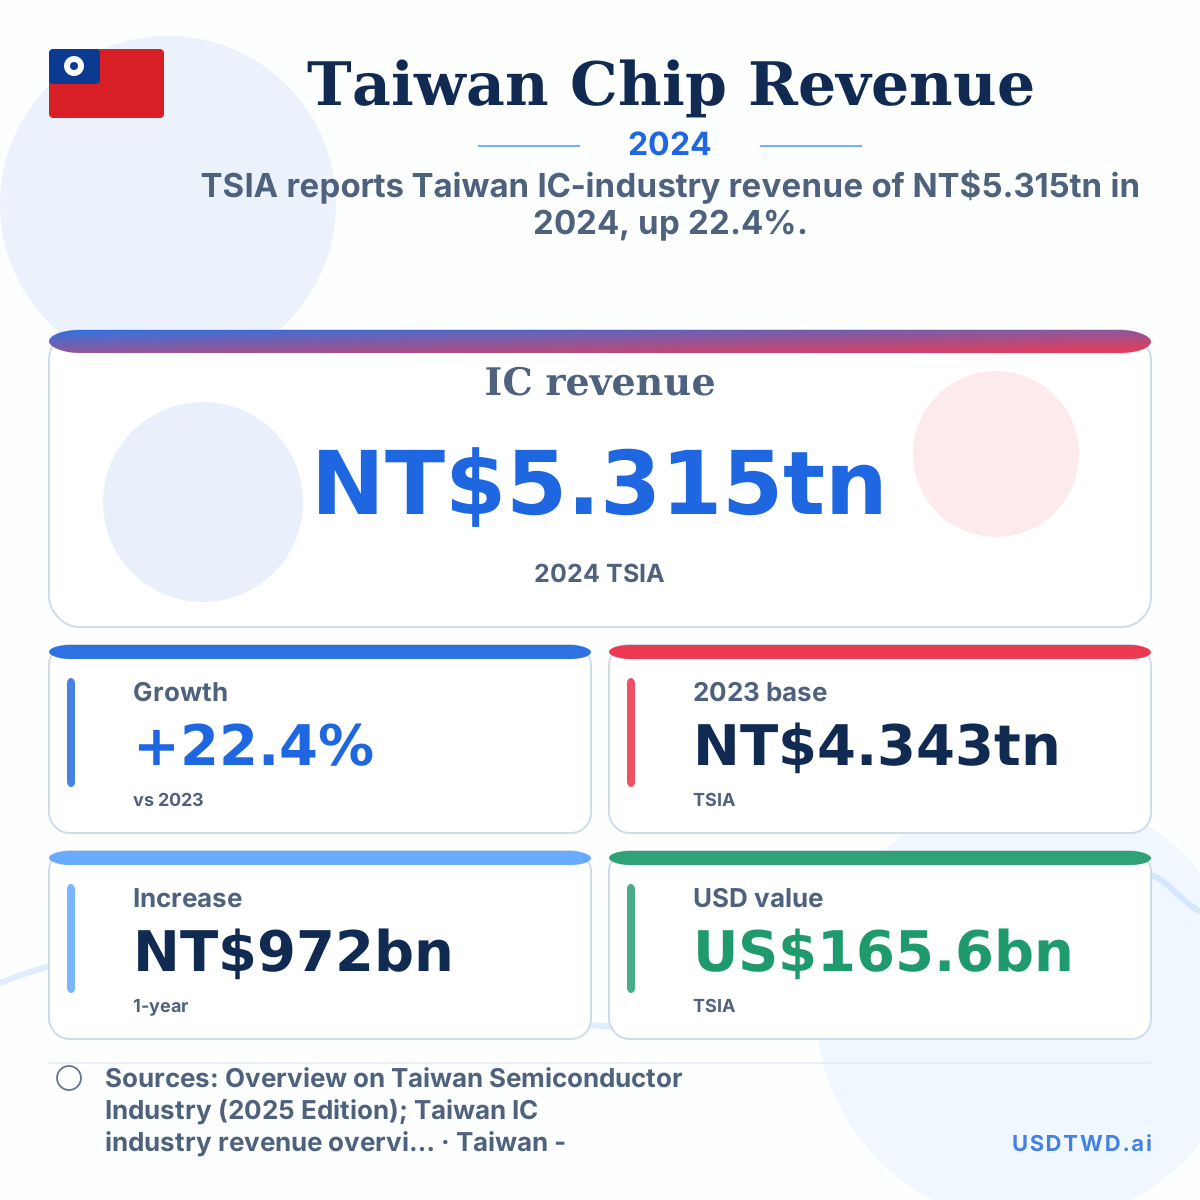
Taiwan semiconductor industry revenue, 2024
TSIA reports Taiwan IC-industry revenue of NT$5.315tn in 2024, up 22.4%.
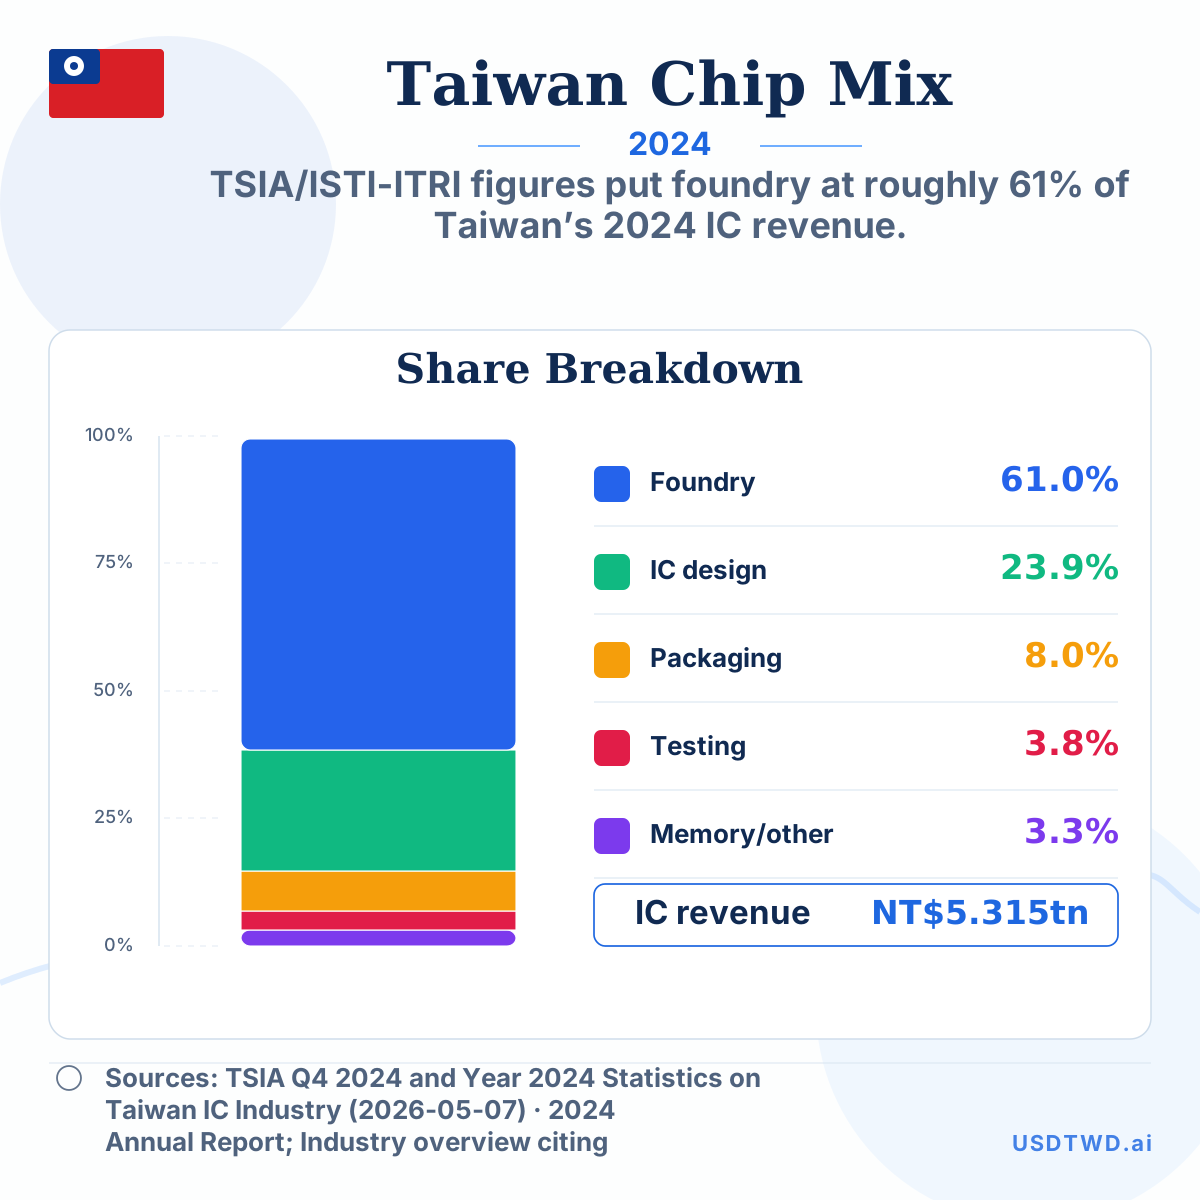
Taiwan semiconductor sector revenue mix, 2024
TSIA/ISTI-ITRI figures put foundry at roughly 61% of Taiwan’s 2024 IC revenue.
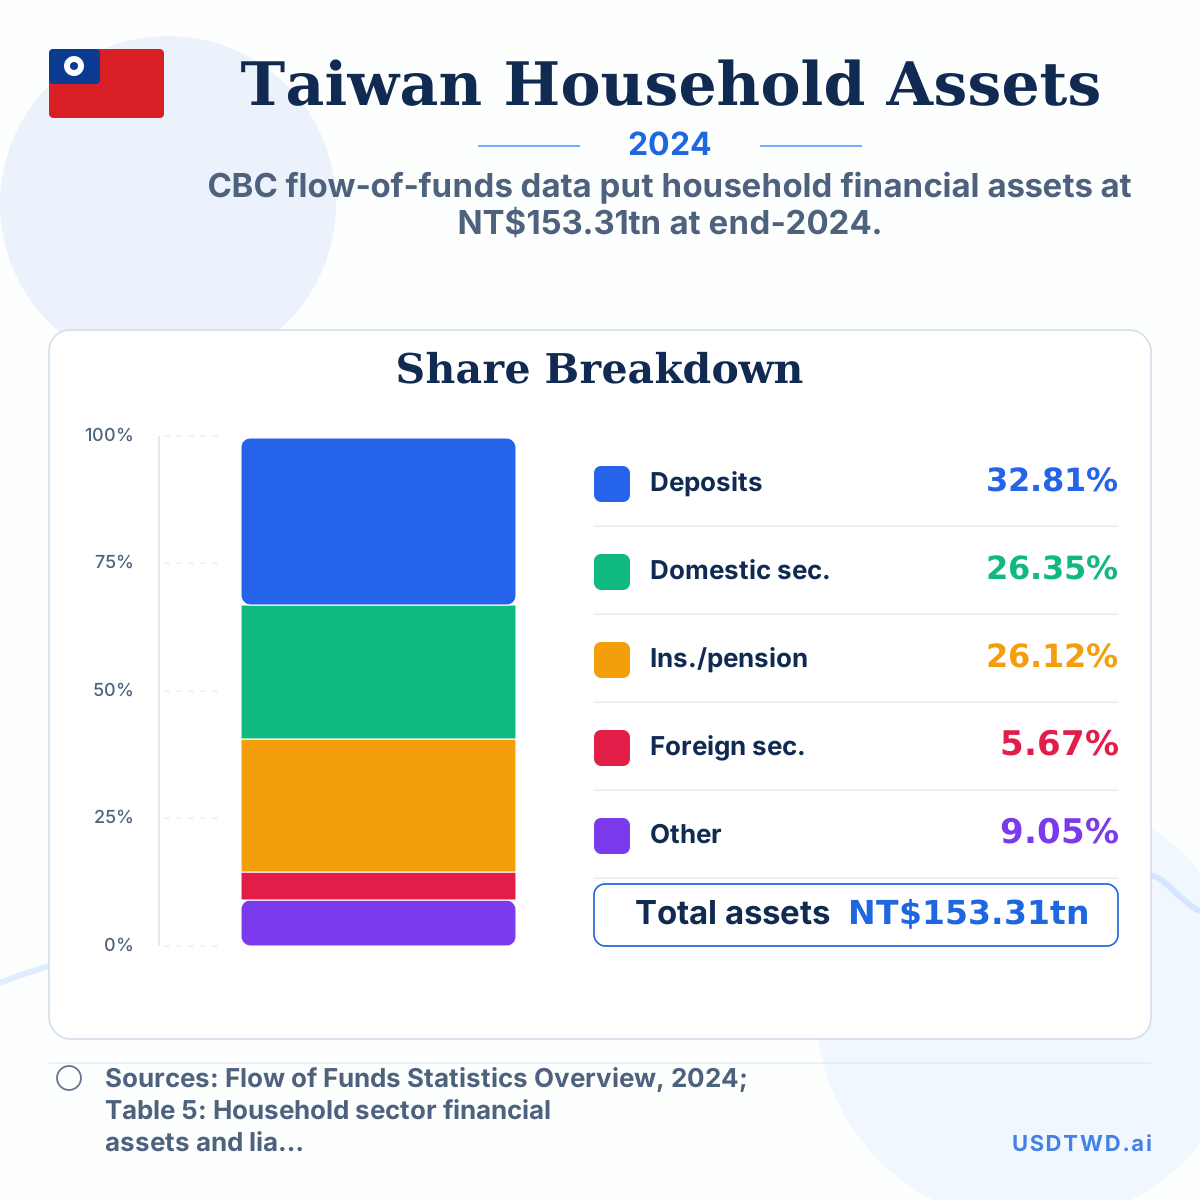
Taiwan household financial assets by category, 2024
CBC flow-of-funds data put household financial assets at NT$153.31tn at end-2024.
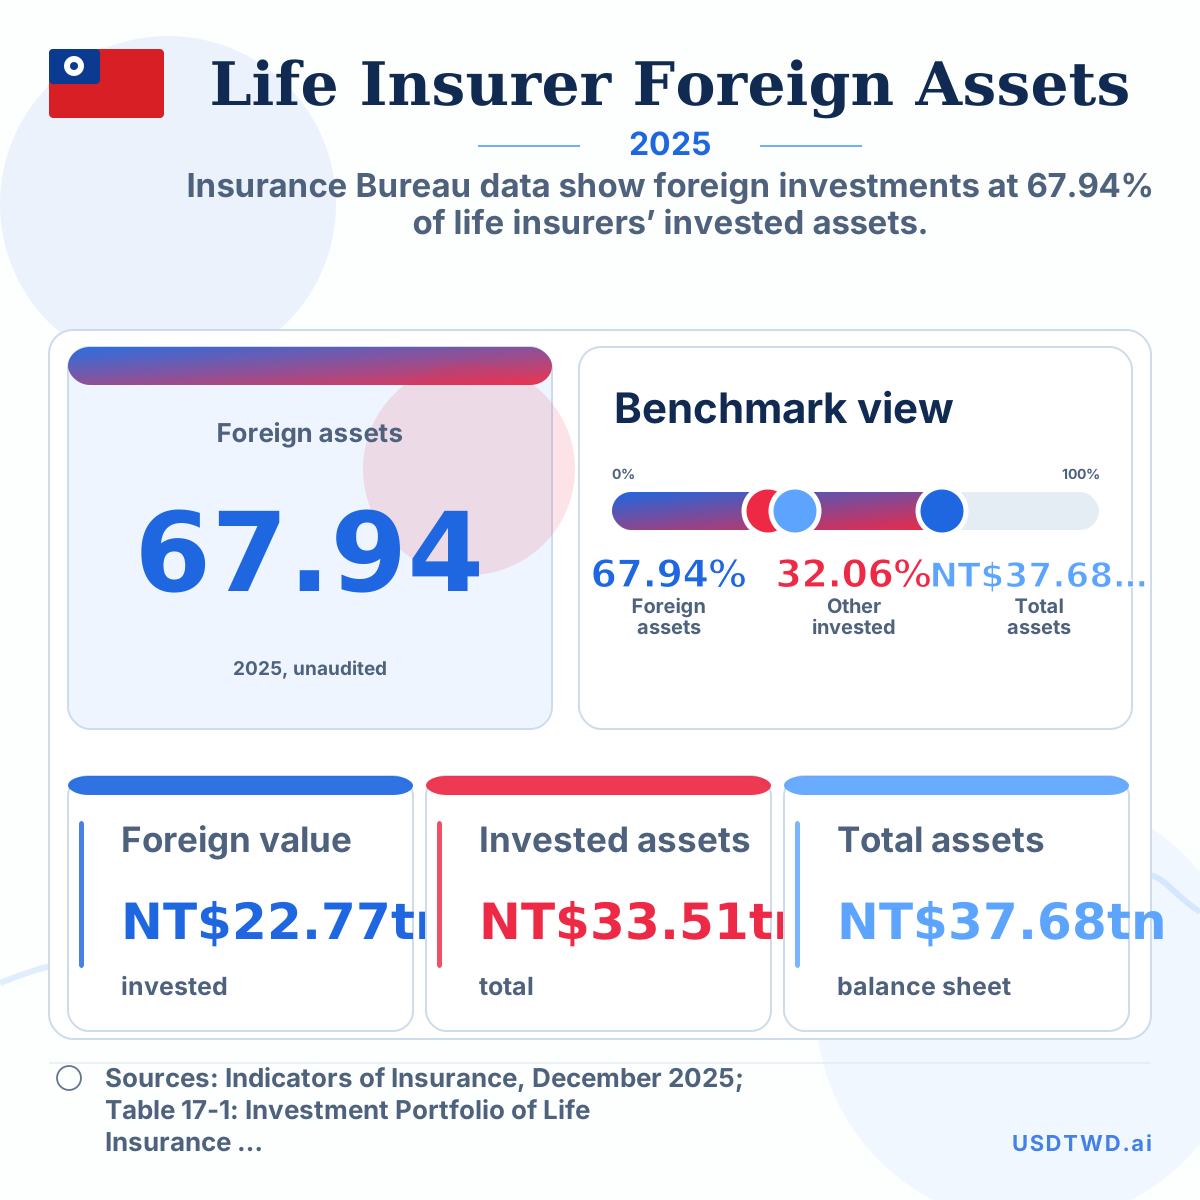
Taiwan life-insurance foreign investments, 2025
Insurance Bureau data show foreign investments at 67.94% of life insurers’ invested assets.
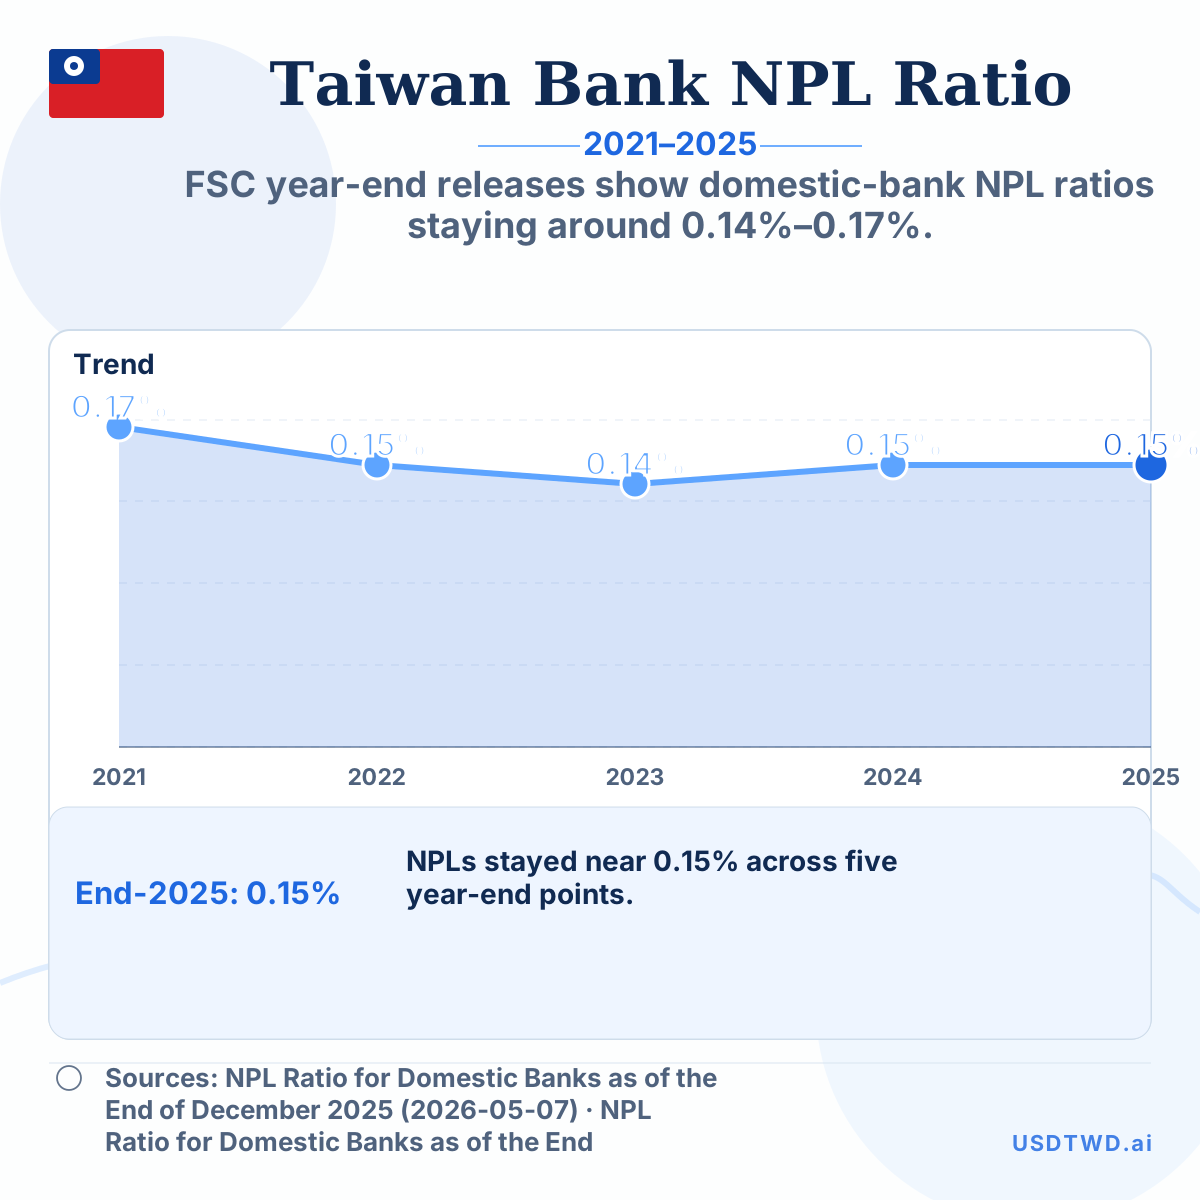
Taiwan domestic-bank non-performing loan ratio, 2021–2025
FSC year-end releases show domestic-bank NPL ratios staying around 0.14%–0.17%.
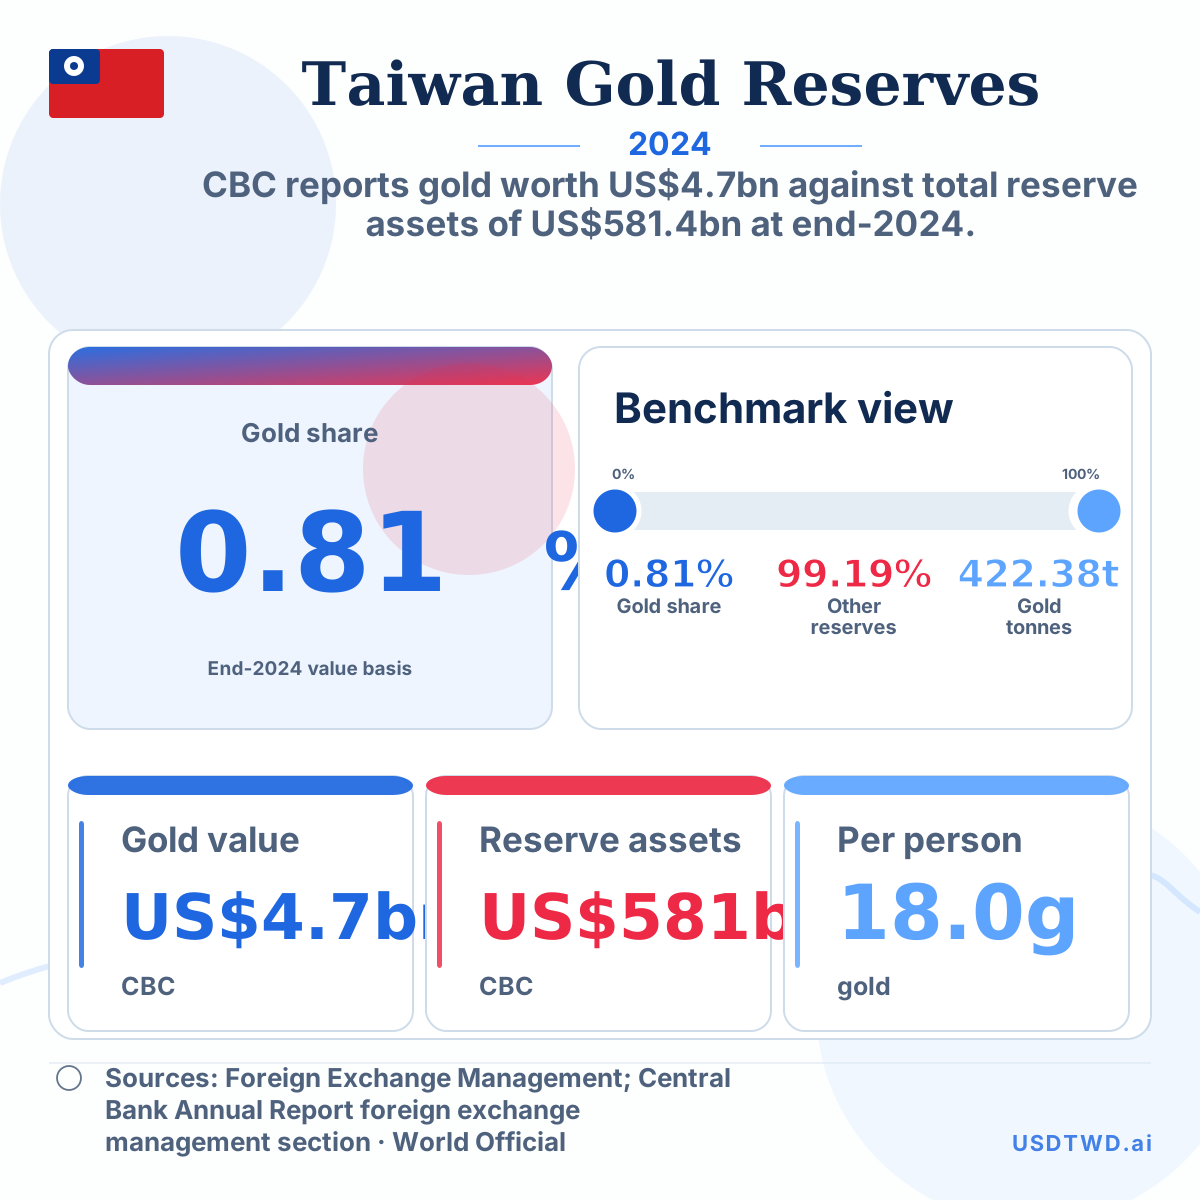
Taiwan central-bank gold reserves versus reserve assets, 2024
CBC reports gold worth US$4.7bn against total reserve assets of US$581.4bn at end-2024.
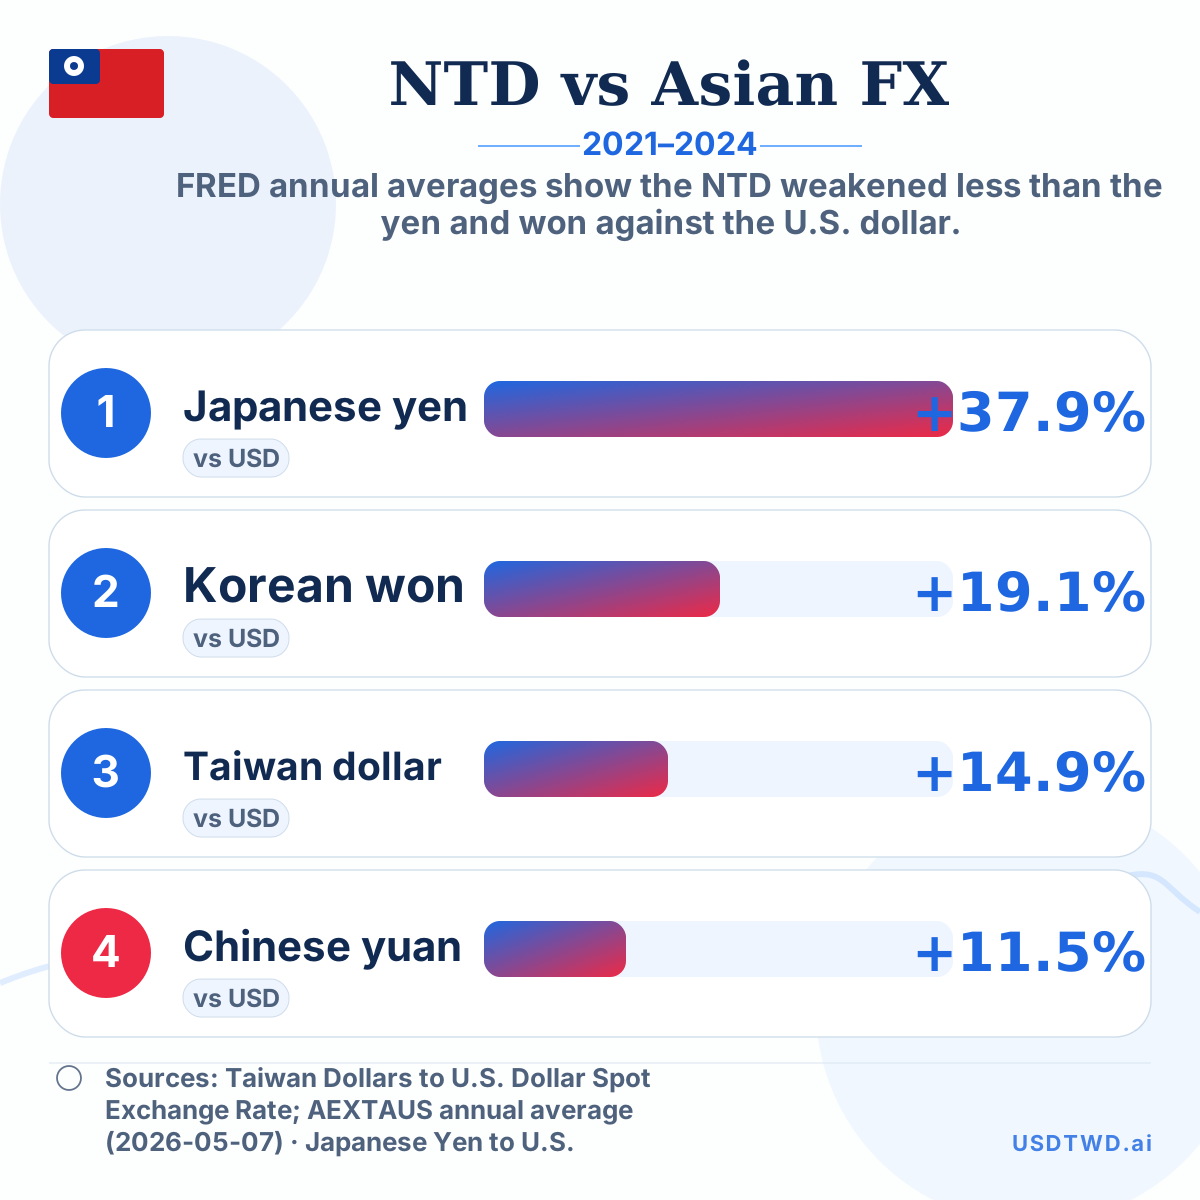
New Taiwan dollar movement versus yen, won and yuan, 2021–2024
FRED annual averages show the NTD weakened less than the yen and won against the U.S. dollar.
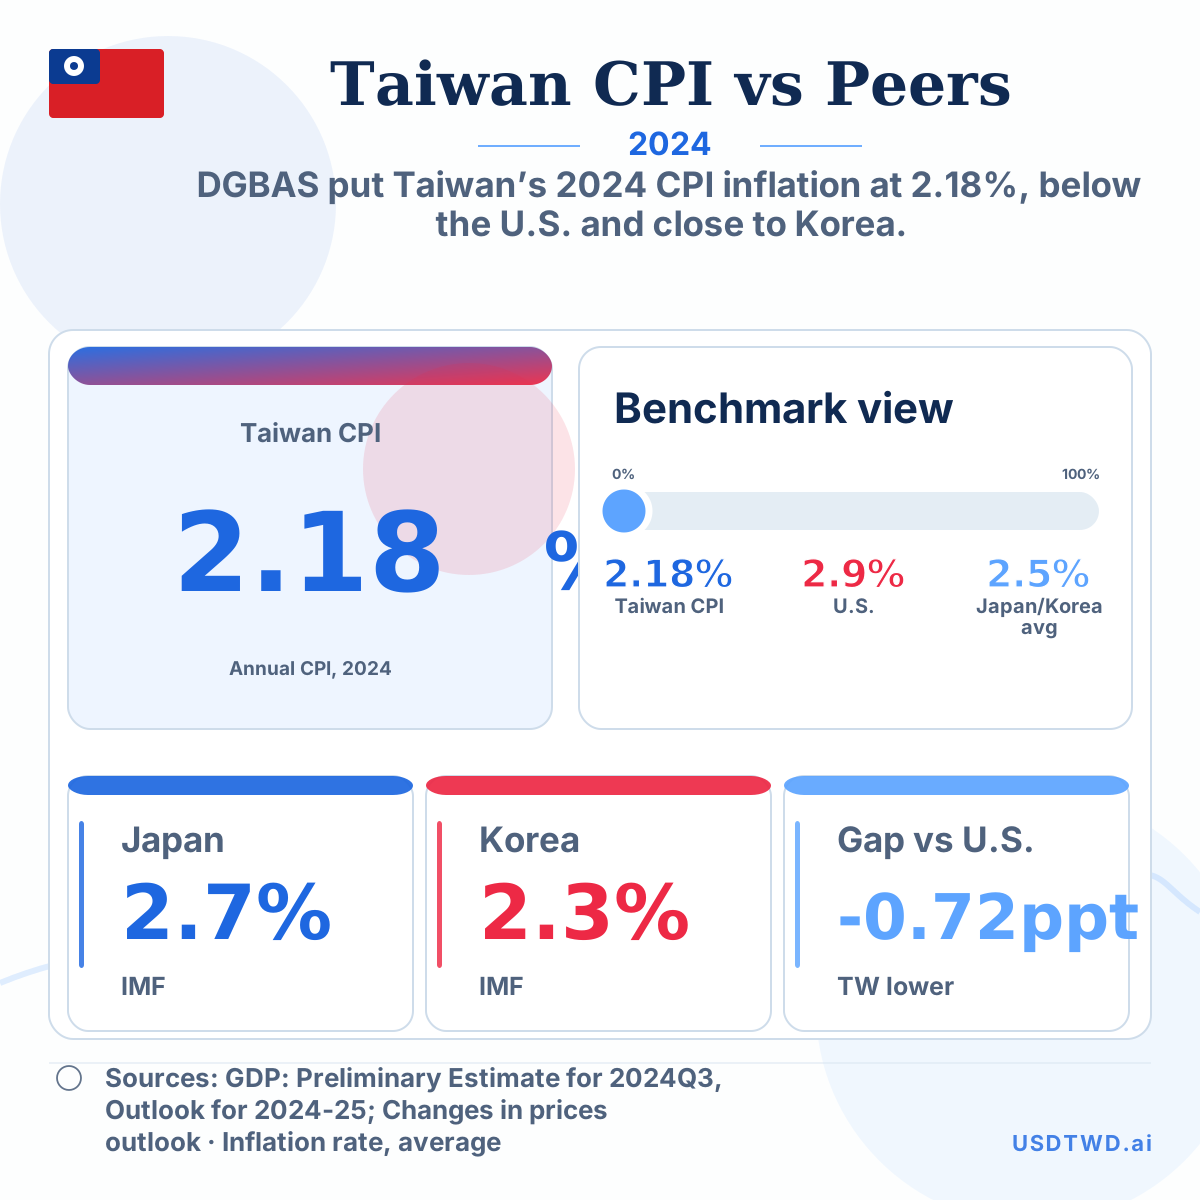
Taiwan CPI inflation versus Japan, Korea and the United States, 2024
DGBAS put Taiwan’s 2024 CPI inflation at 2.18%, below the U.S. and close to Korea.
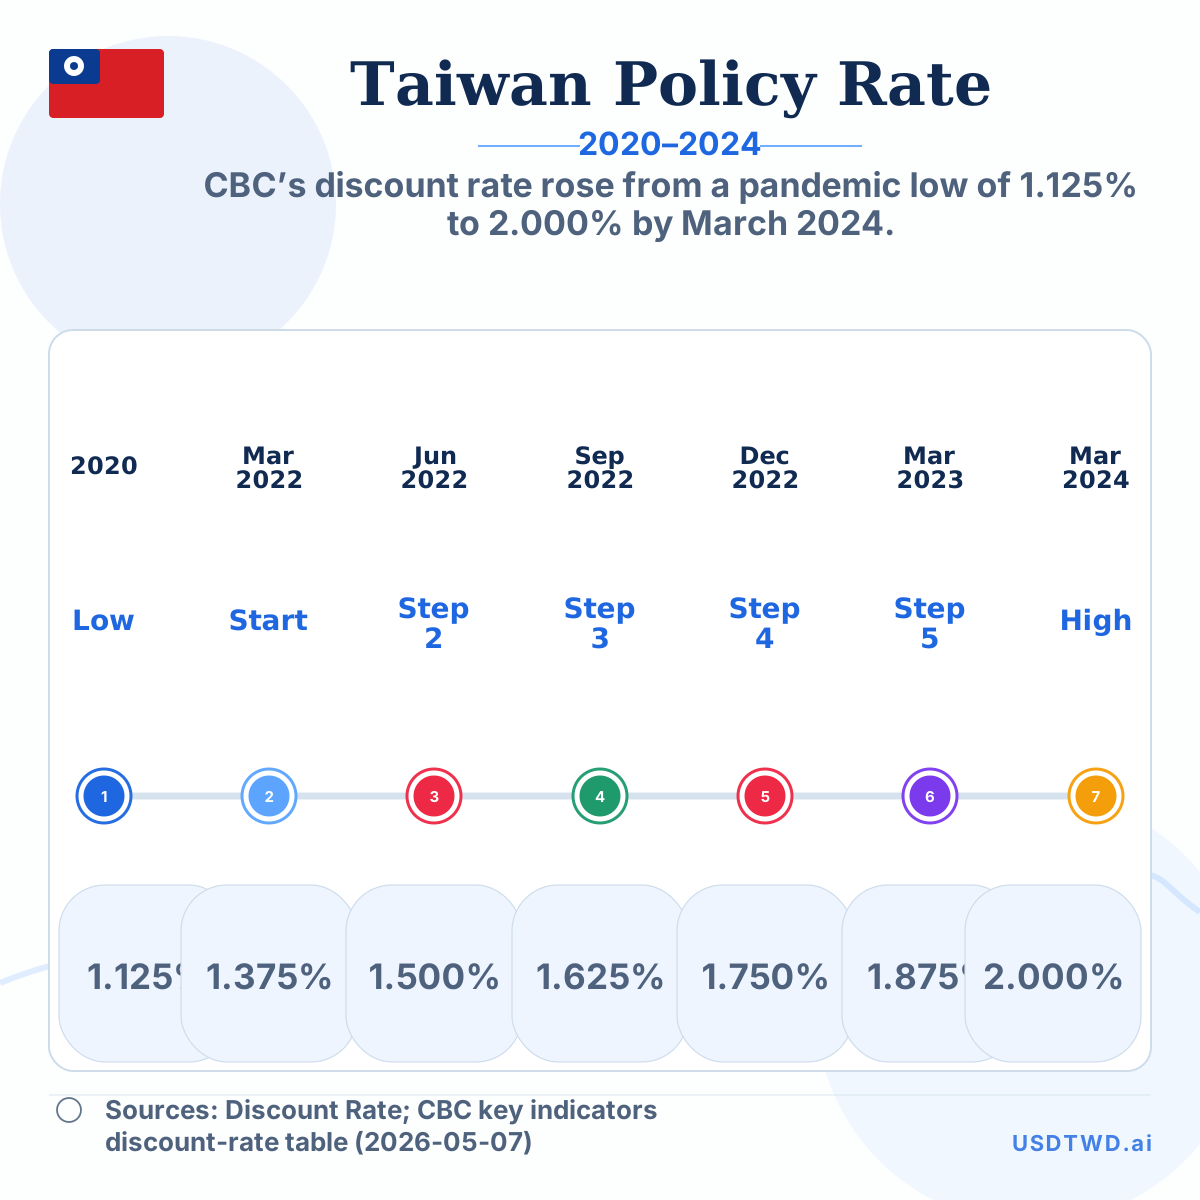
Taiwan central-bank discount-rate cycle, 2020–2024
CBC’s discount rate rose from a pandemic low of 1.125% to 2.000% by March 2024.
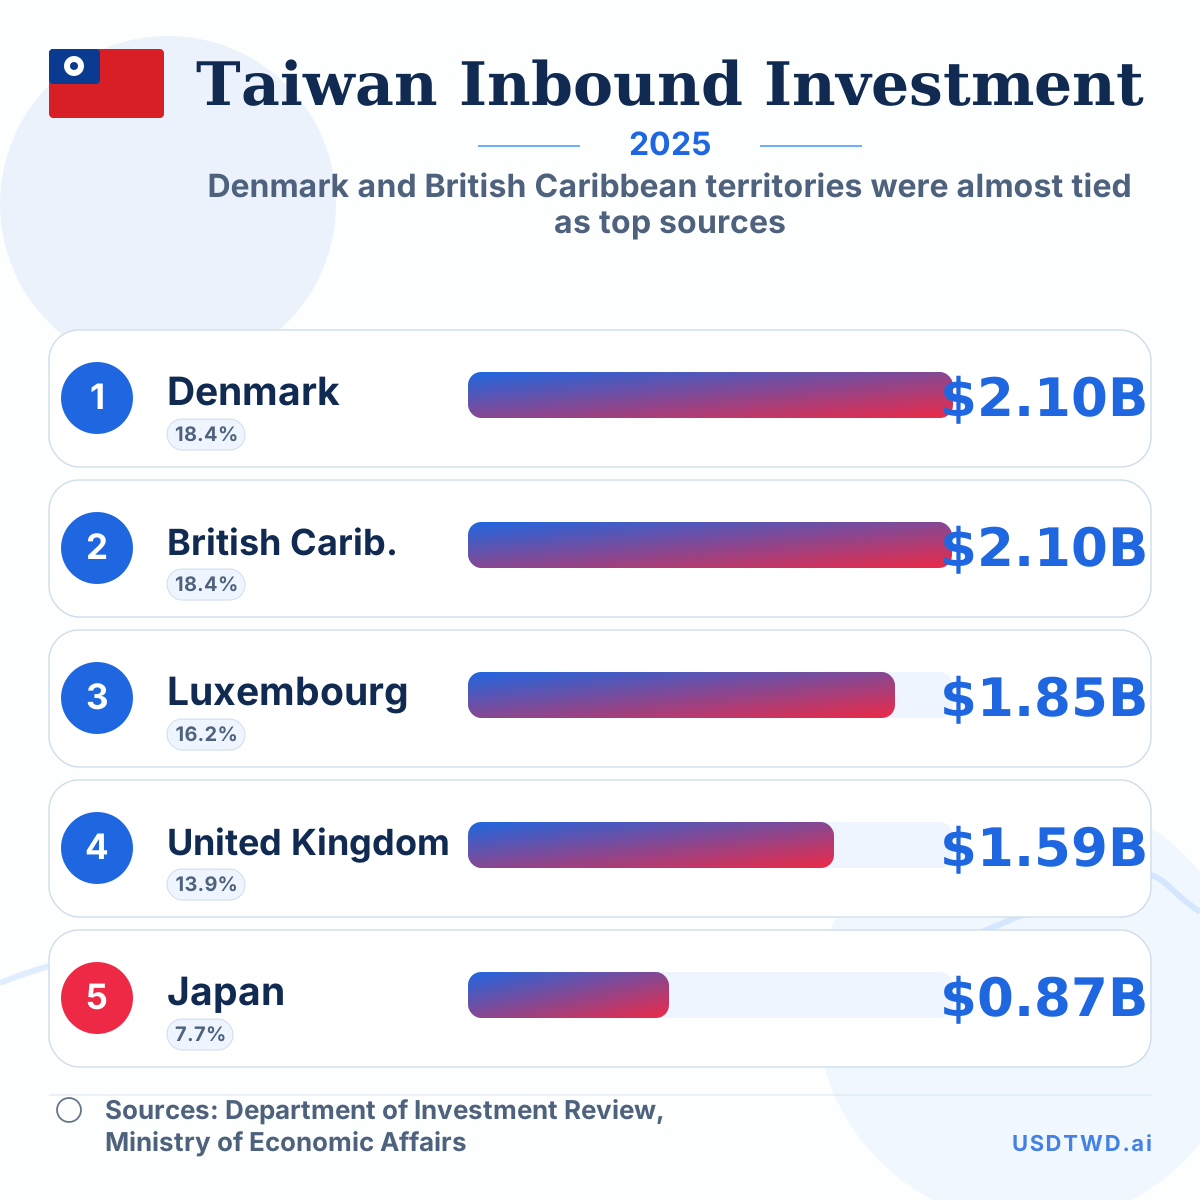
Top Sources of Taiwan Inbound Investment in 2025
Denmark and British Caribbean territories were almost tied as top sources
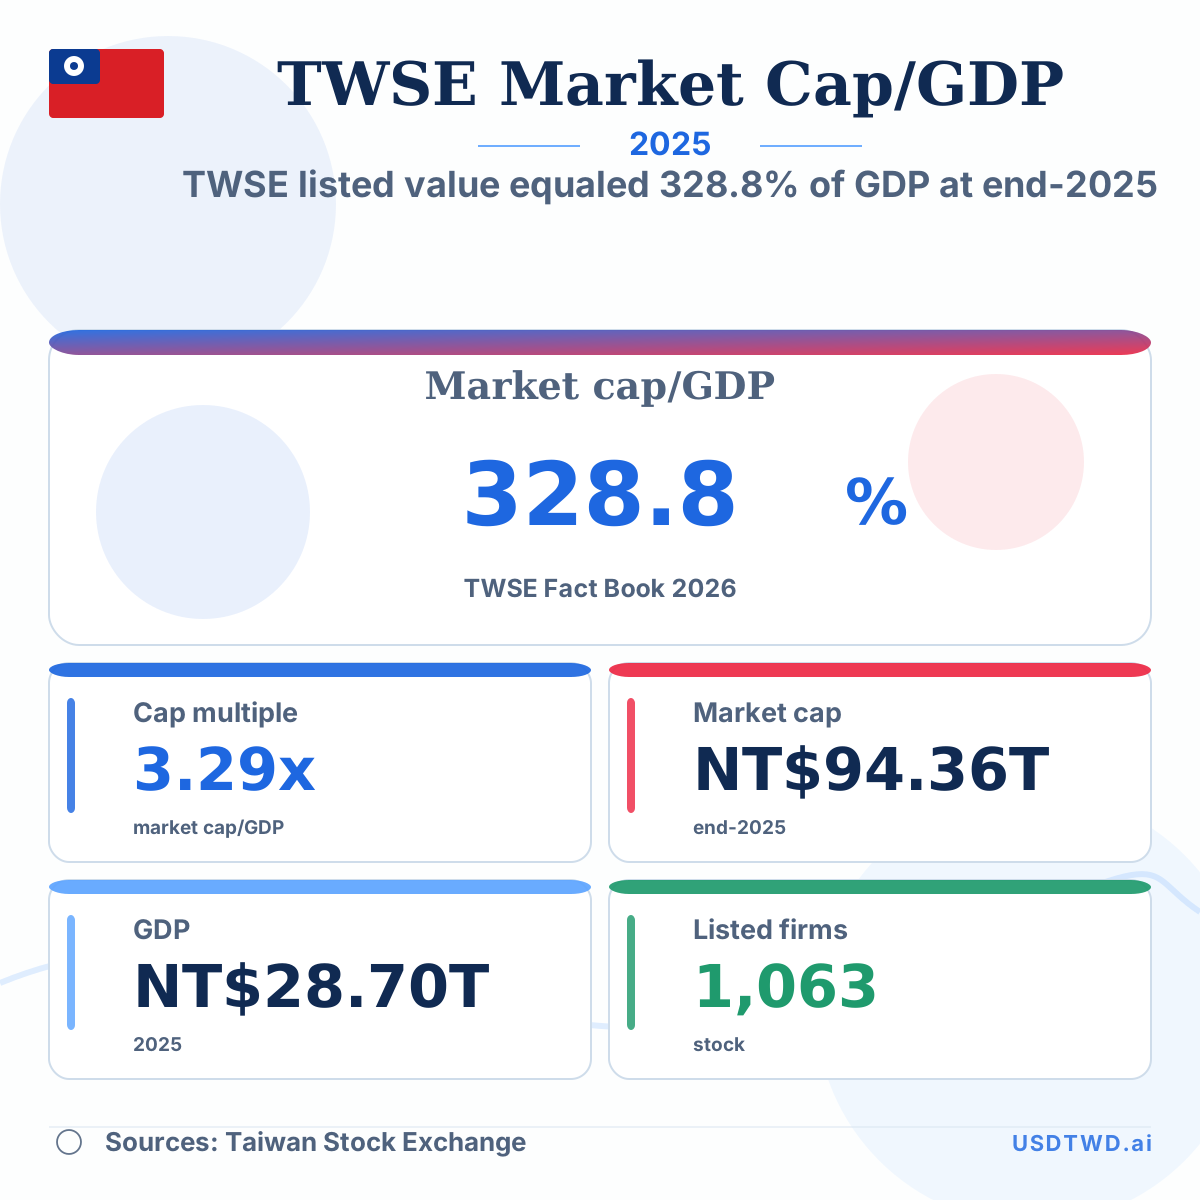
Taiwan Listed Market Cap Was 328.8% of GDP in 2025
TWSE listed value equaled 328.8% of GDP at end-2025
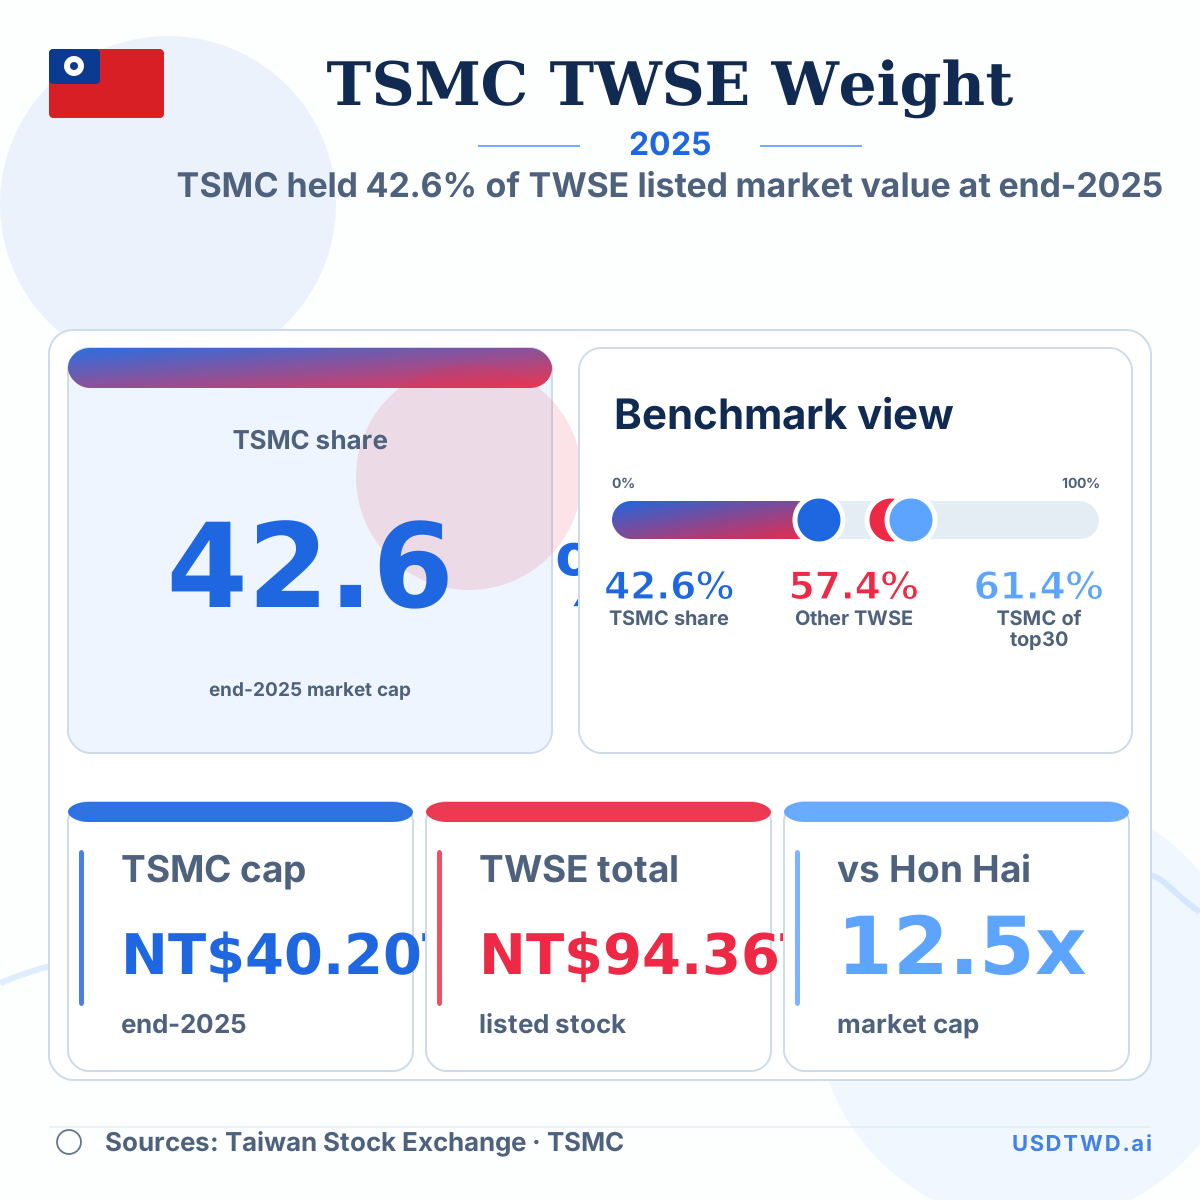
TSMC Was 42.6% of TWSE Listed Market Value in 2025
TSMC held 42.6% of TWSE listed market value at end-2025
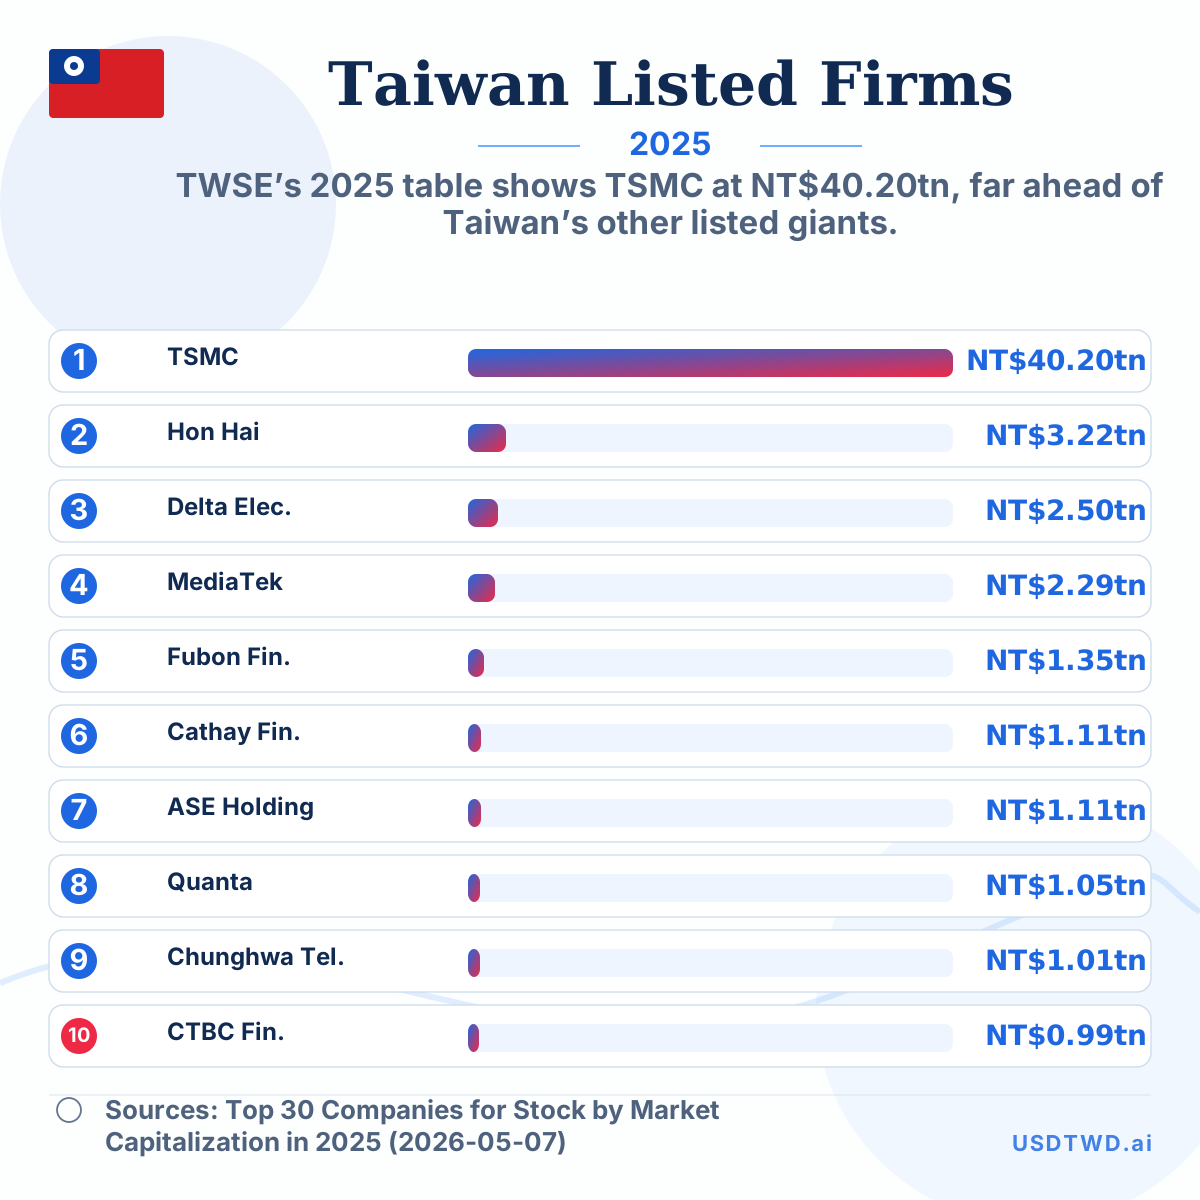
Taiwan’s top listed companies by market capitalization, 2025
TWSE’s 2025 table shows TSMC at NT$40.20tn, far ahead of Taiwan’s other listed giants.
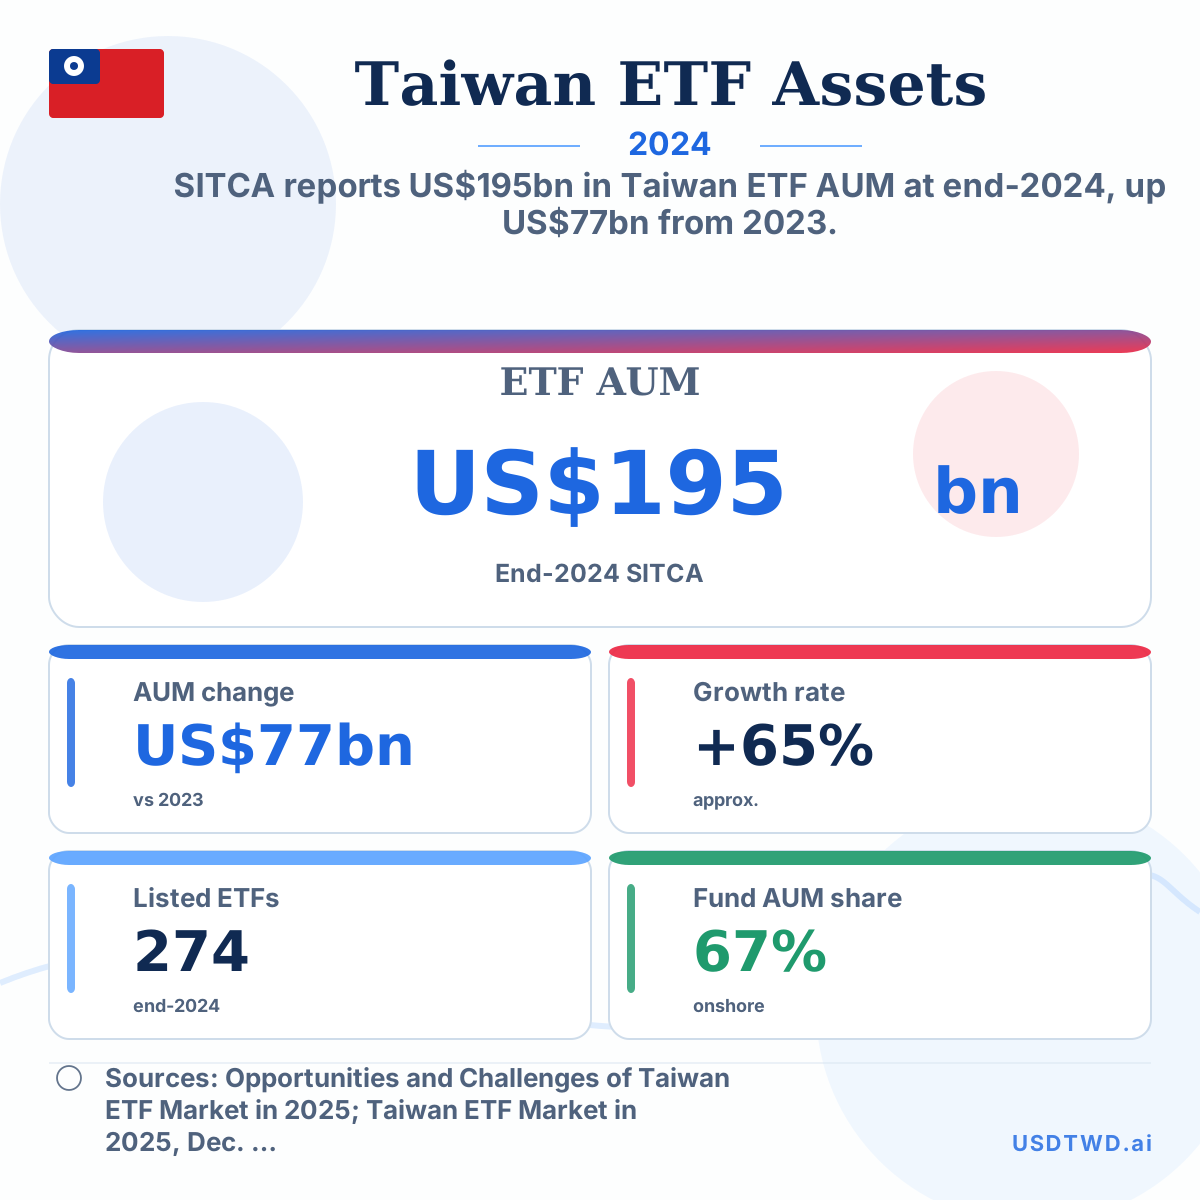
Taiwan ETF assets and listed ETFs, 2024
SITCA reports US$195bn in Taiwan ETF AUM at end-2024, up US$77bn from 2023.
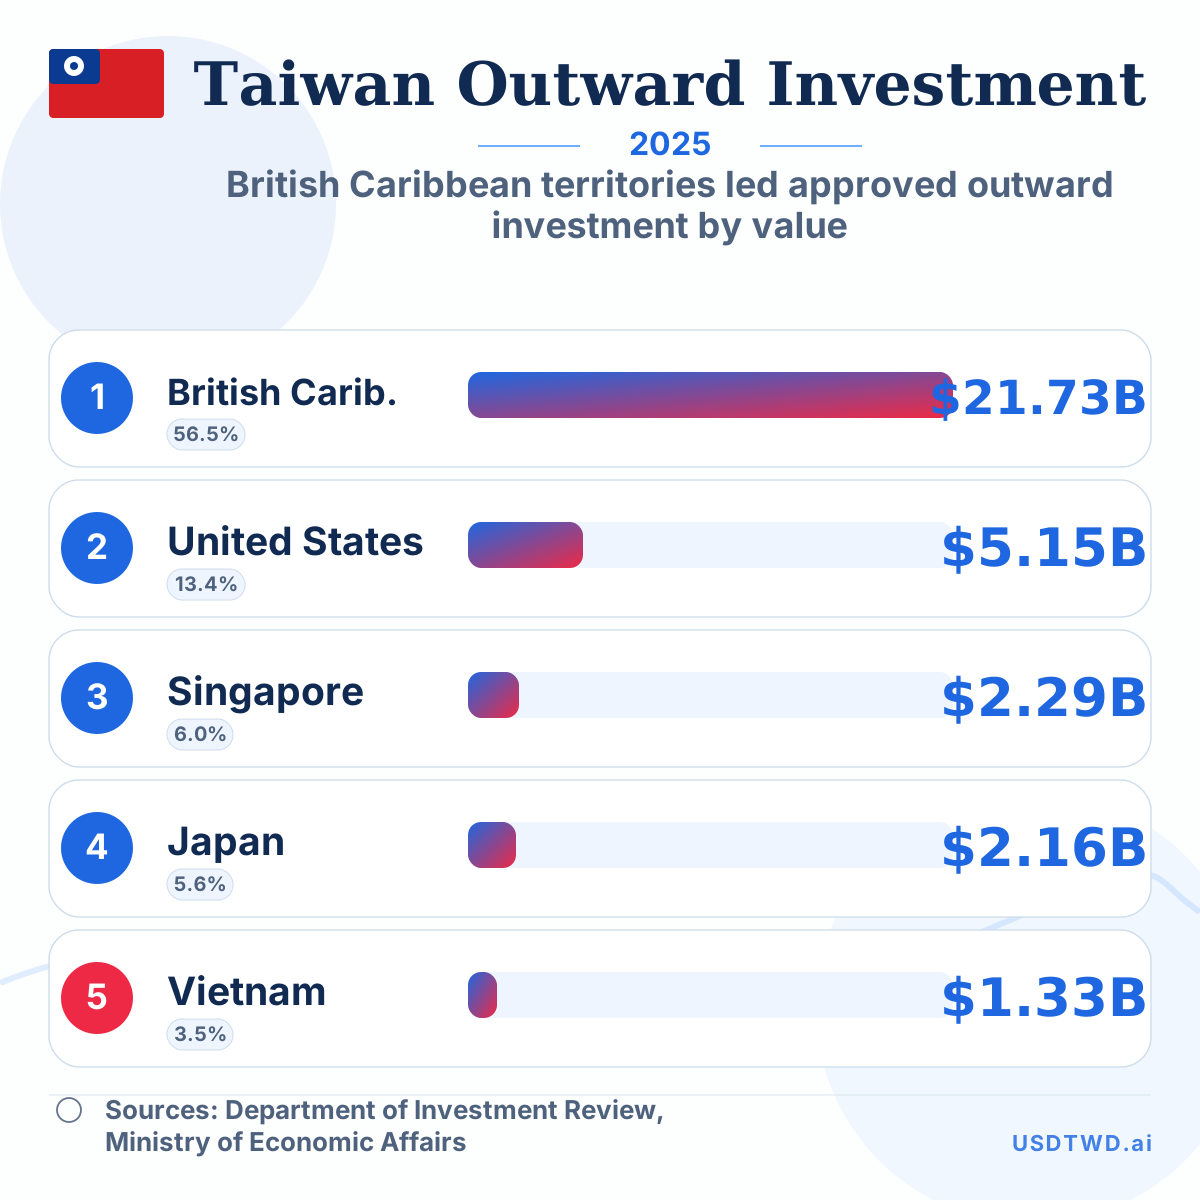
Top Destinations for Taiwan Outward Investment in 2025
British Caribbean territories led approved outward investment by value
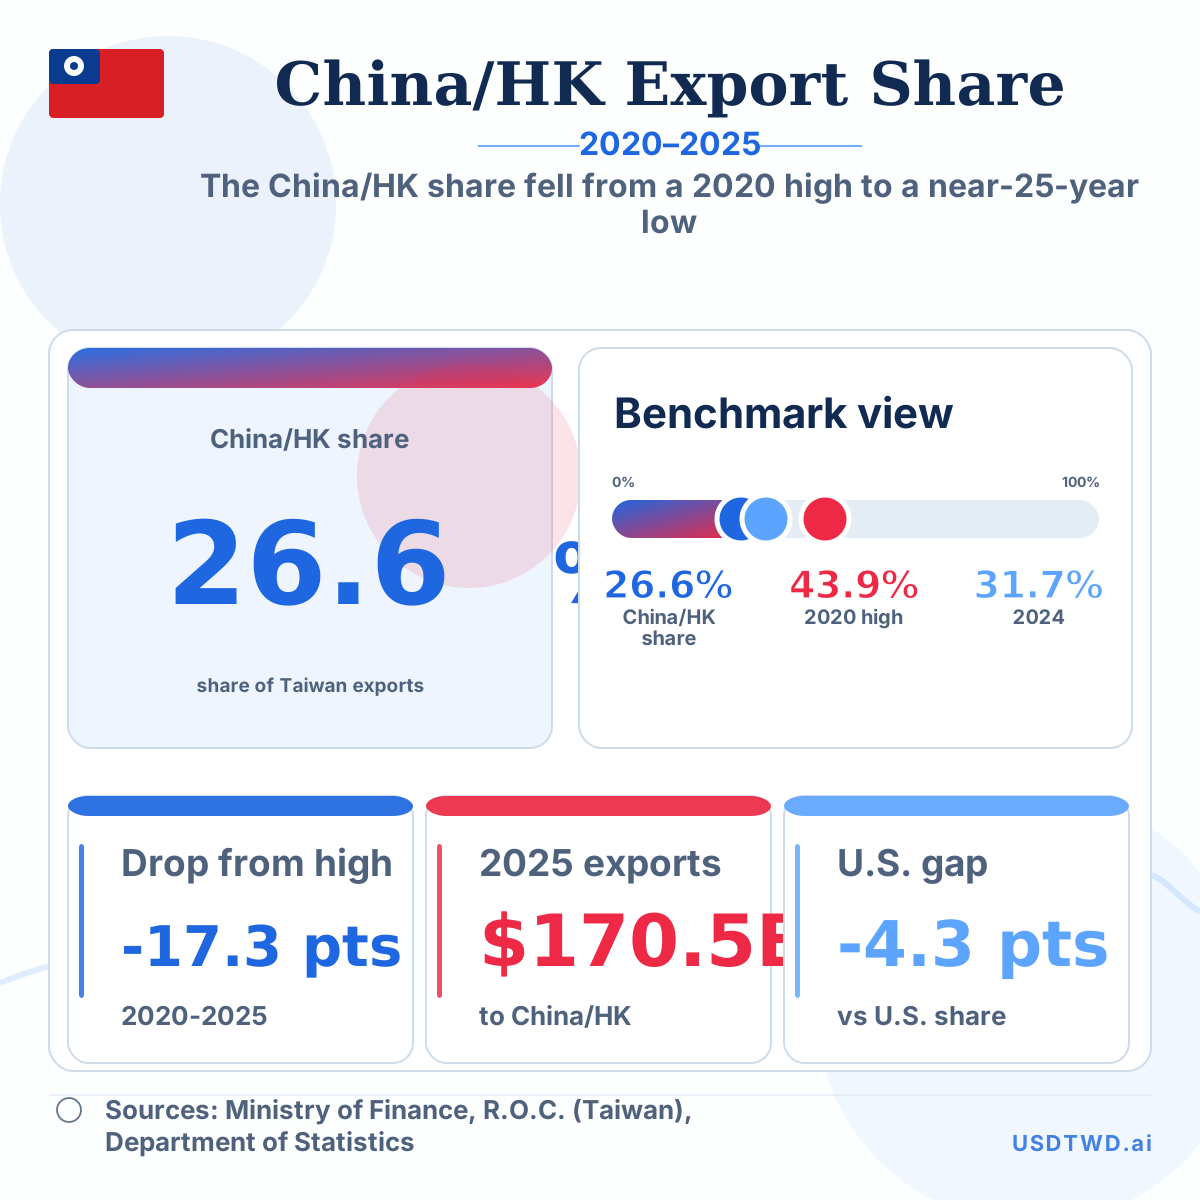
Taiwan China/HK Export Share Fell to 26.6% in 2025
The China/HK share fell from a 2020 high to a near-25-year low
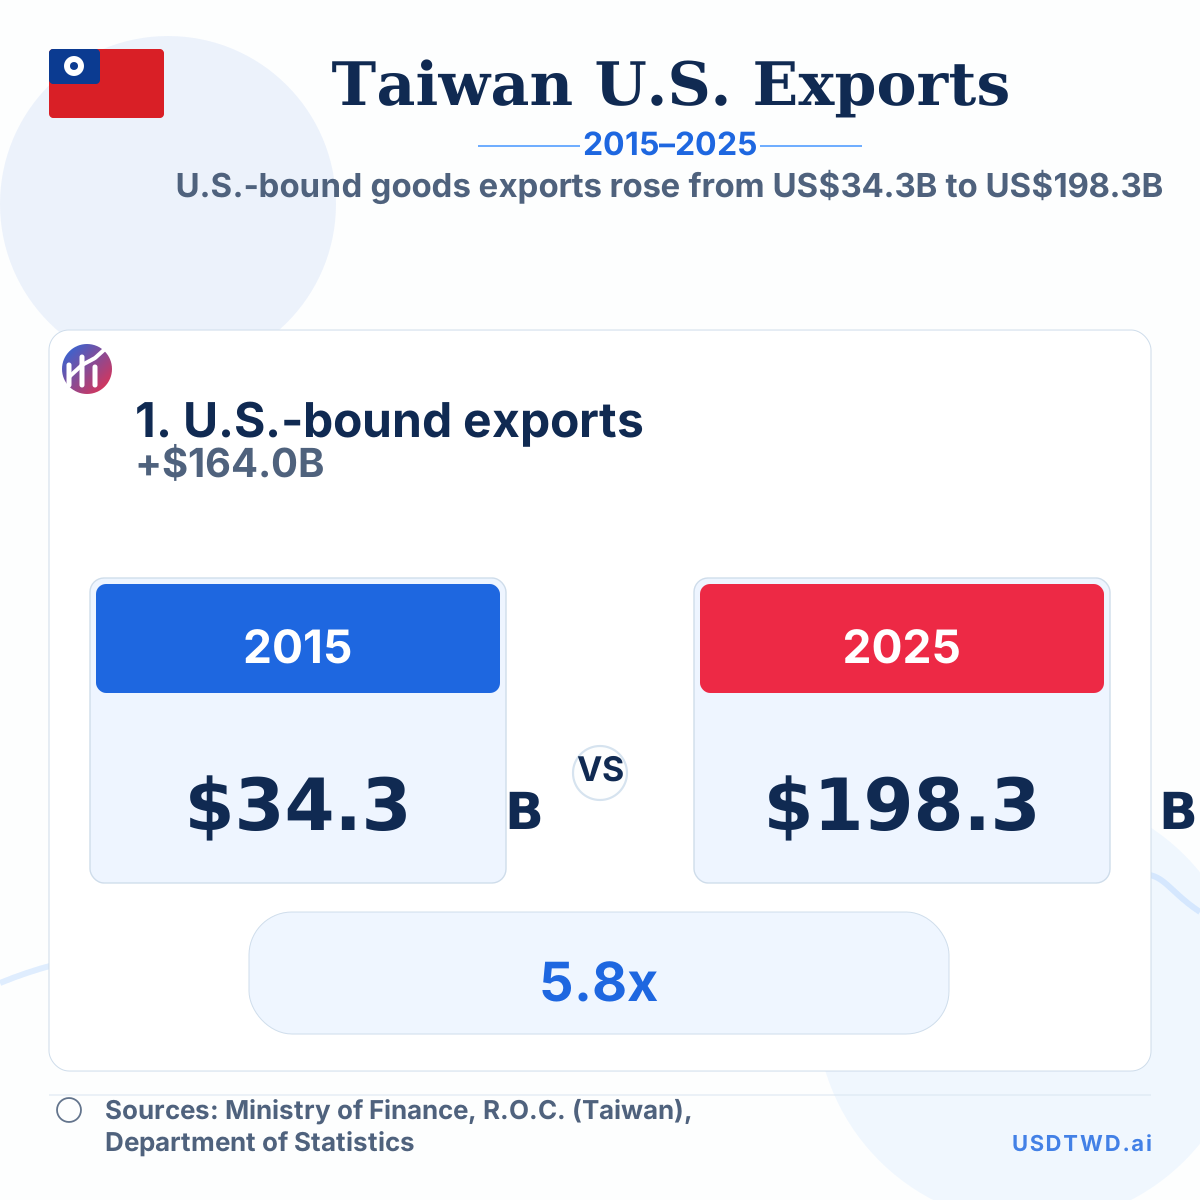
Taiwan U.S.-Bound Exports Rose 5.8x from 2015 to 2025
U.S.-bound goods exports rose from US$34.3B to US$198.3B
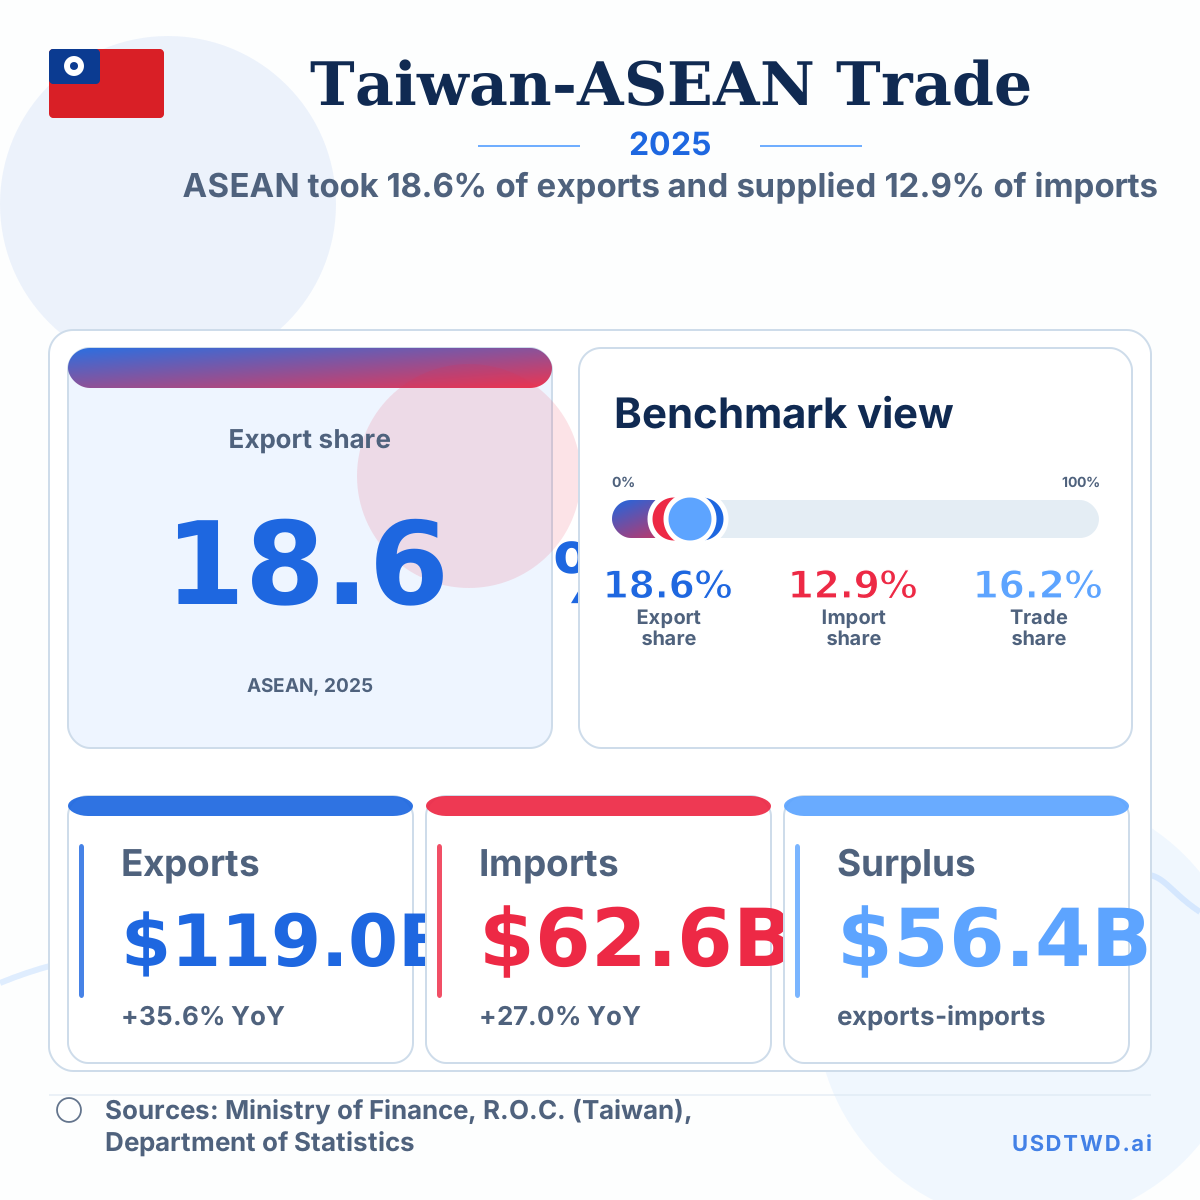
ASEAN Took 18.6% of Taiwan Exports in 2025
ASEAN took 18.6% of exports and supplied 12.9% of imports
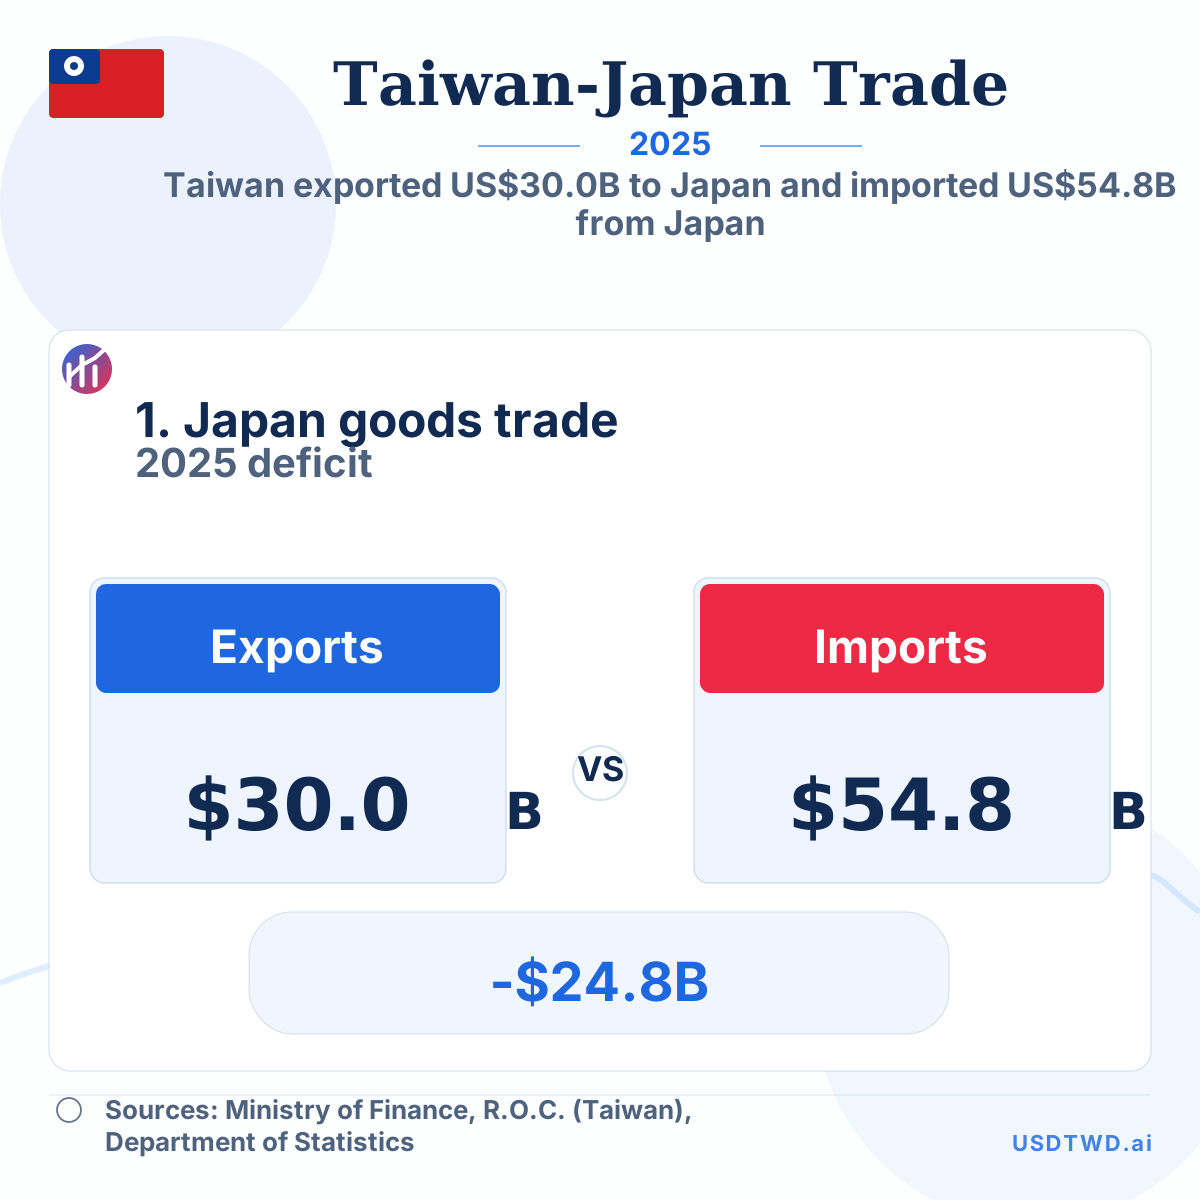
Taiwan Ran a US$24.8B Goods Deficit with Japan in 2025
Taiwan exported US$30.0B to Japan and imported US$54.8B from Japan
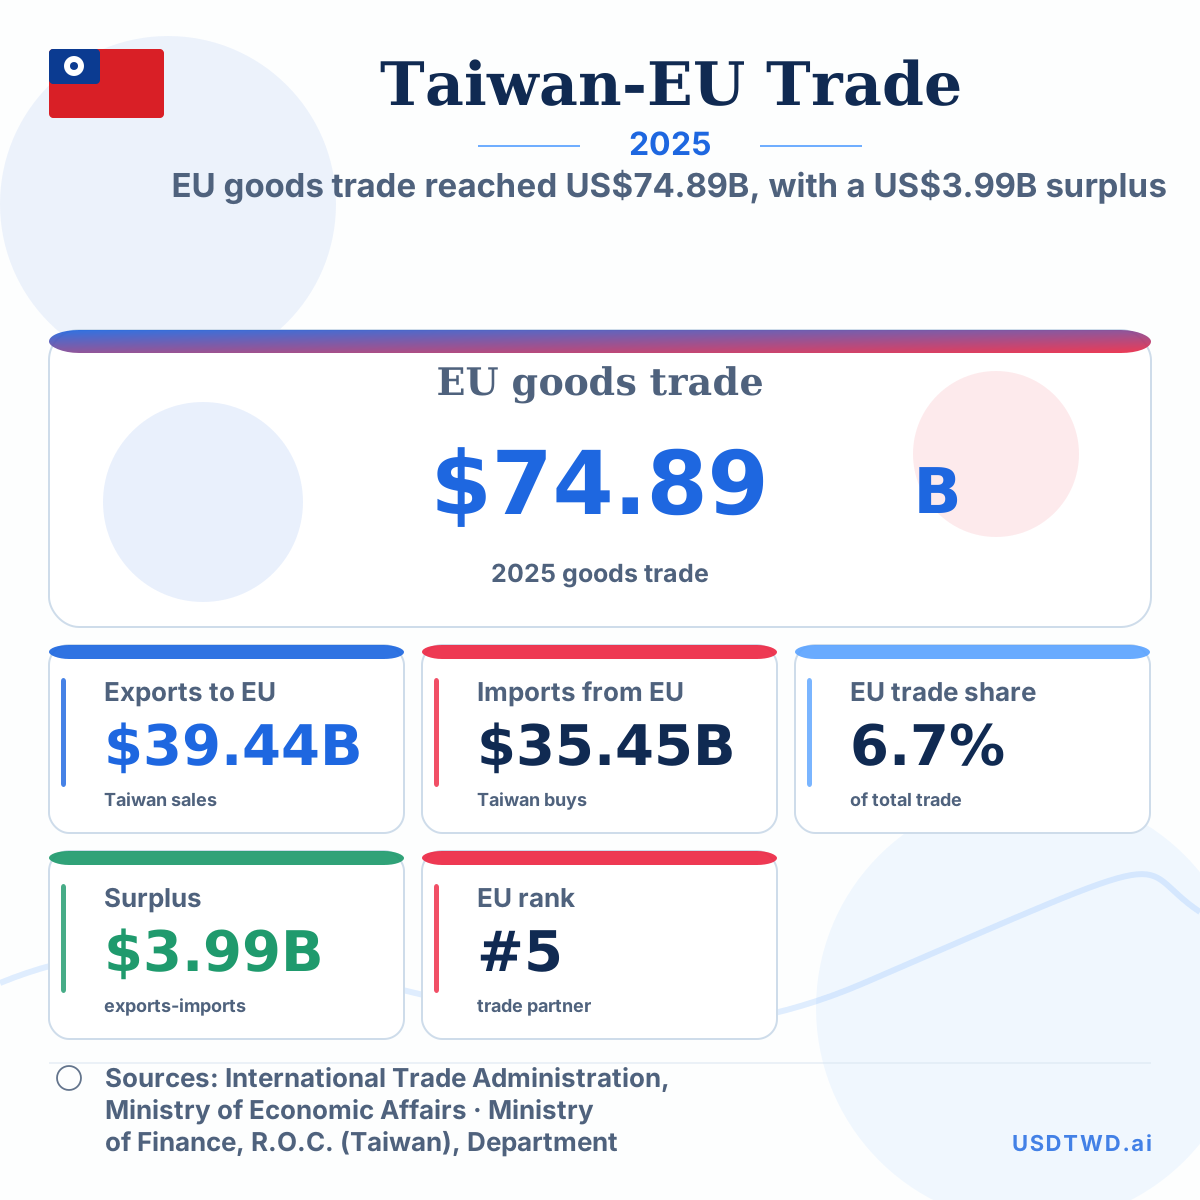
Taiwan-EU Goods Trade Reached US$74.89B in 2025
EU goods trade reached US$74.89B, with a US$3.99B surplus