
Stat Graphics Library
Browse source-labelled FX, economy, market, demographic, social, technology, culture, health and government graphics by category, source and reusable visual format.
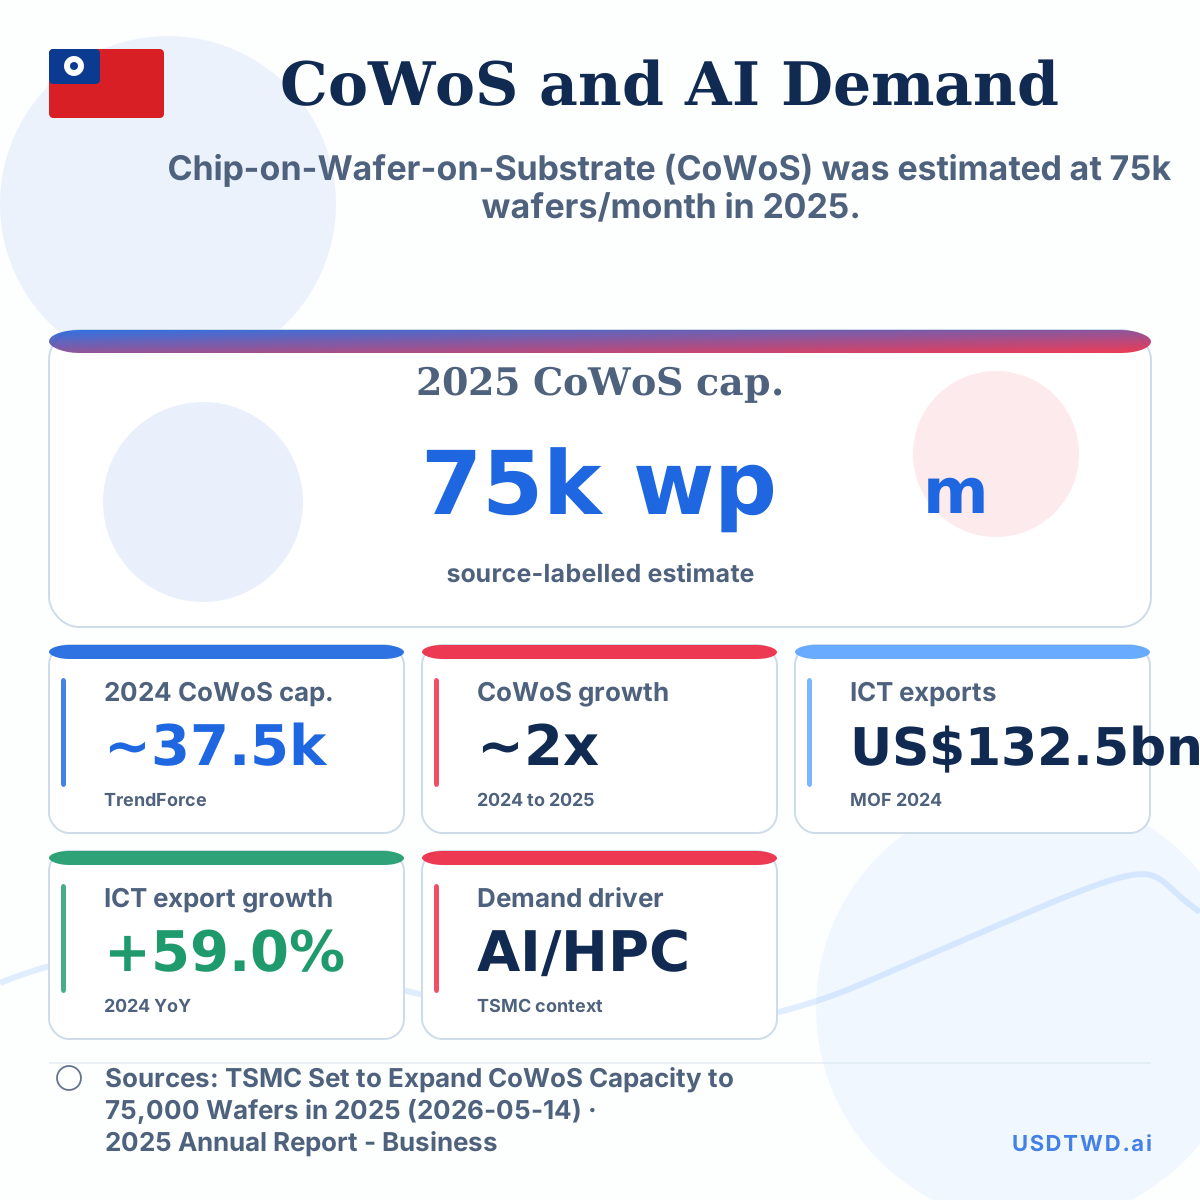
TSMC CoWoS Capacity Growth vs Taiwan AI Export Demand
Chip-on-Wafer-on-Substrate (CoWoS) was estimated at 75k wafers/month in 2025.
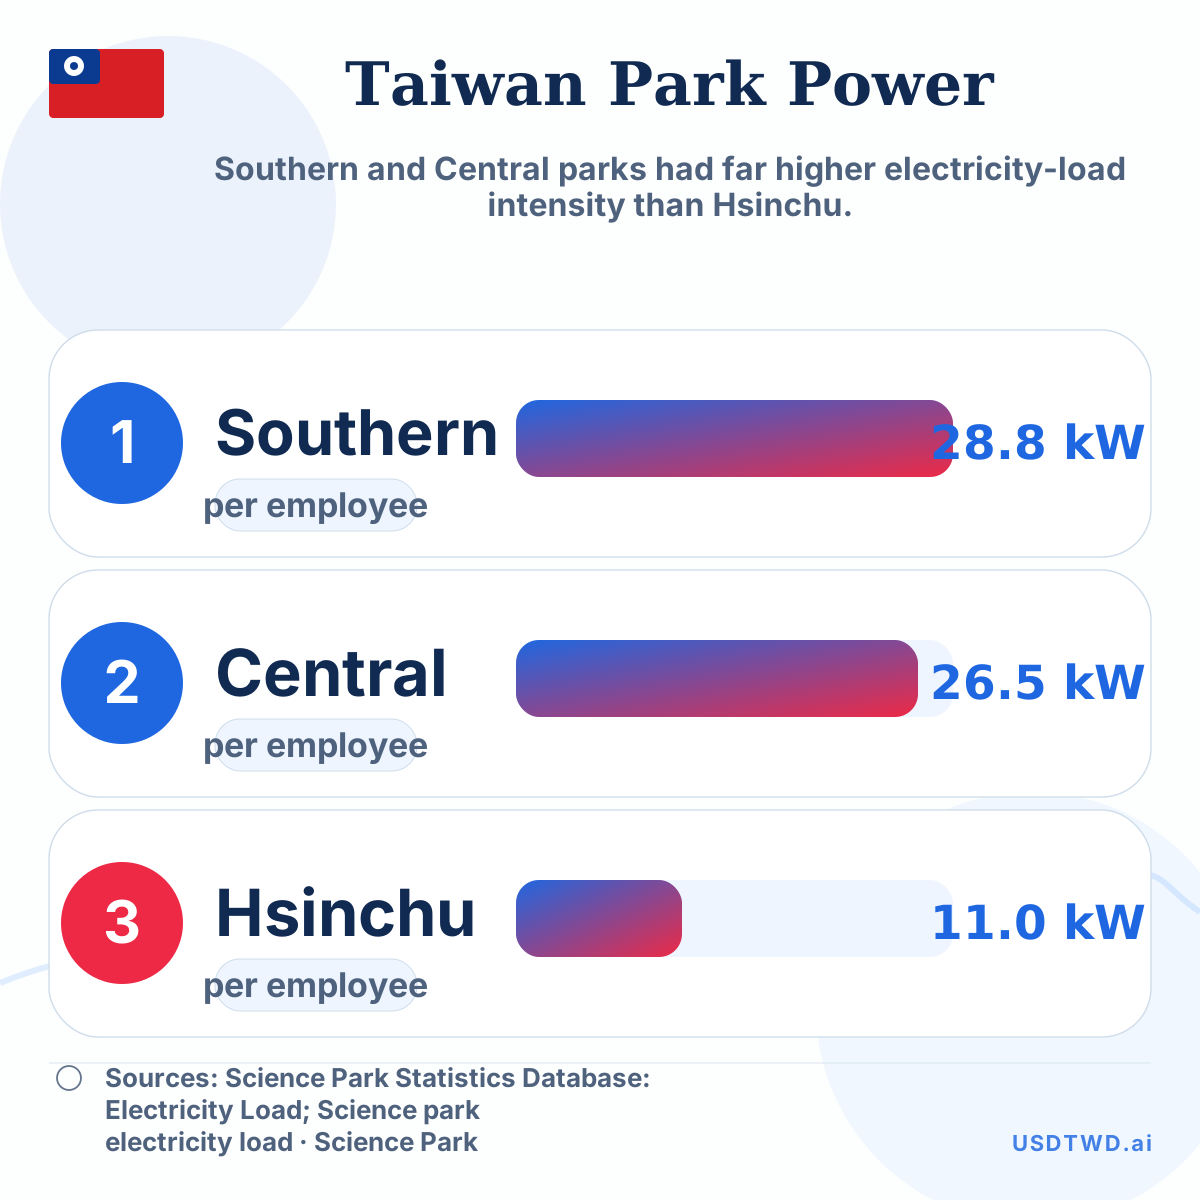
Taiwan Science Park Electricity Load per Employee
Southern and Central parks had far higher electricity-load intensity than Hsinchu.
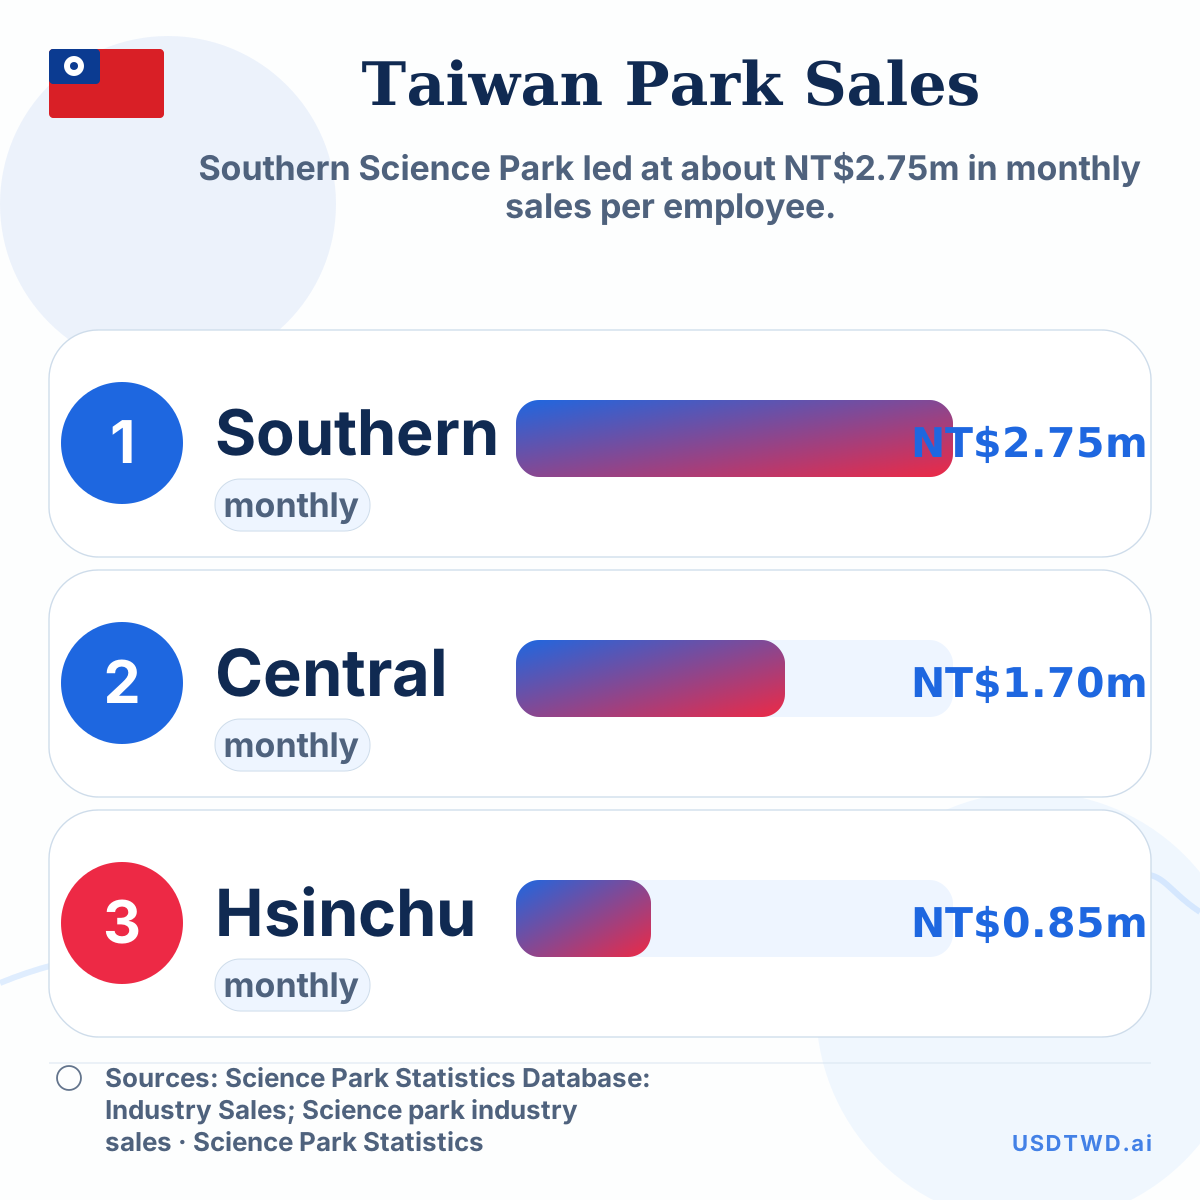
Taiwan Science Park Sales per Employee
Southern Science Park led at about NT$2.75m in monthly sales per employee.
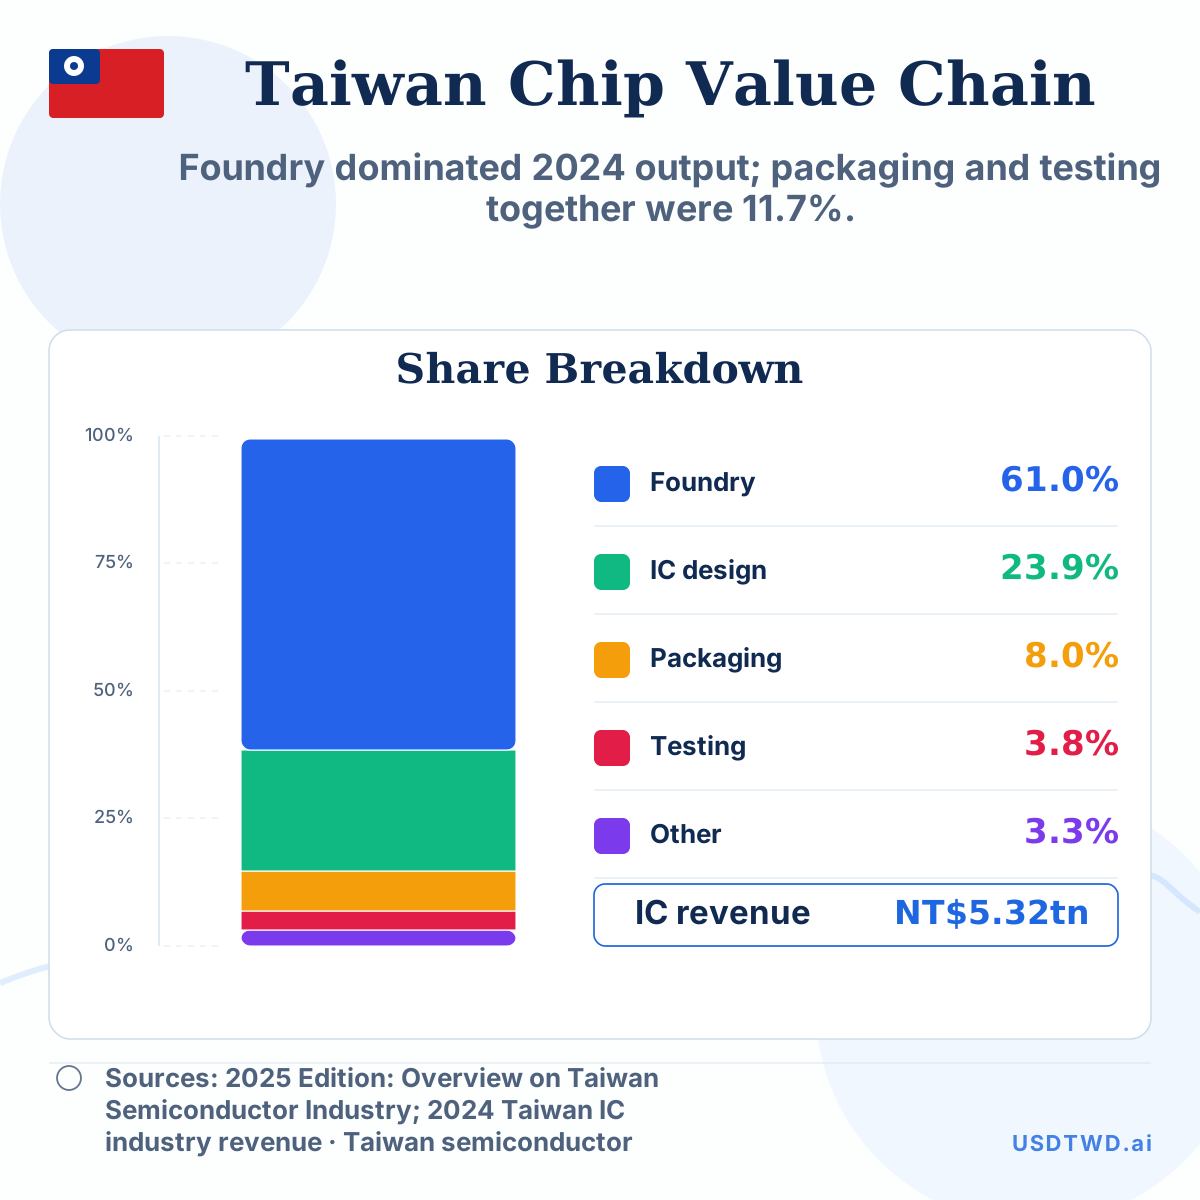
Taiwan Semiconductor Value Chain: Foundry, Design and Backend
Foundry dominated 2024 output; packaging and testing together were 11.7%.
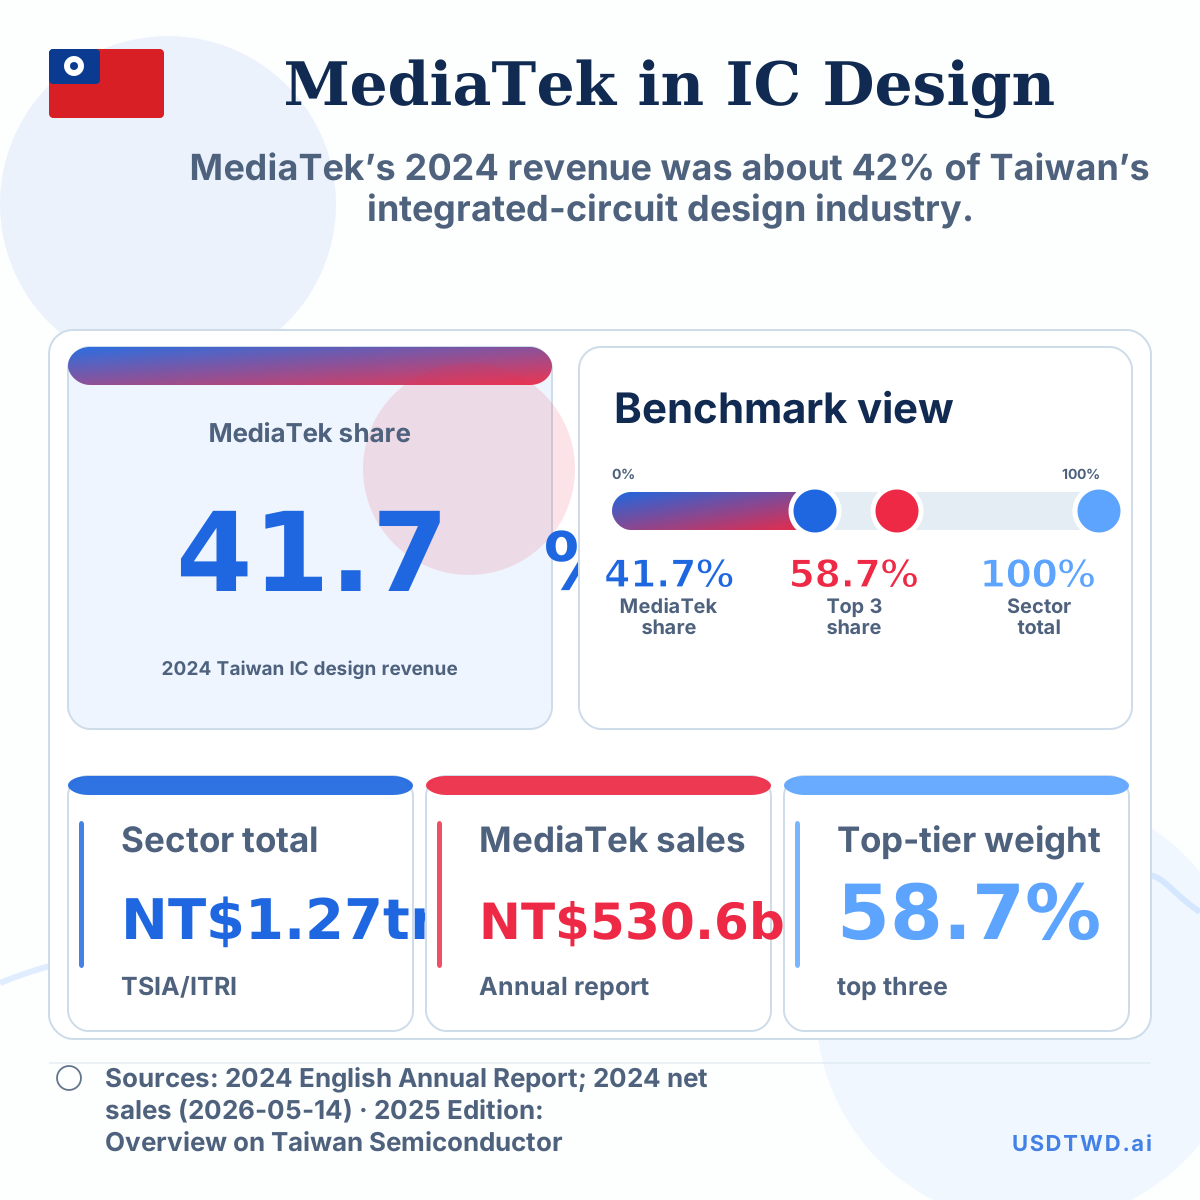
MediaTek Revenue vs Taiwan Integrated-Circuit Design Sector
MediaTek’s 2024 revenue was about 42% of Taiwan’s integrated-circuit design industry.
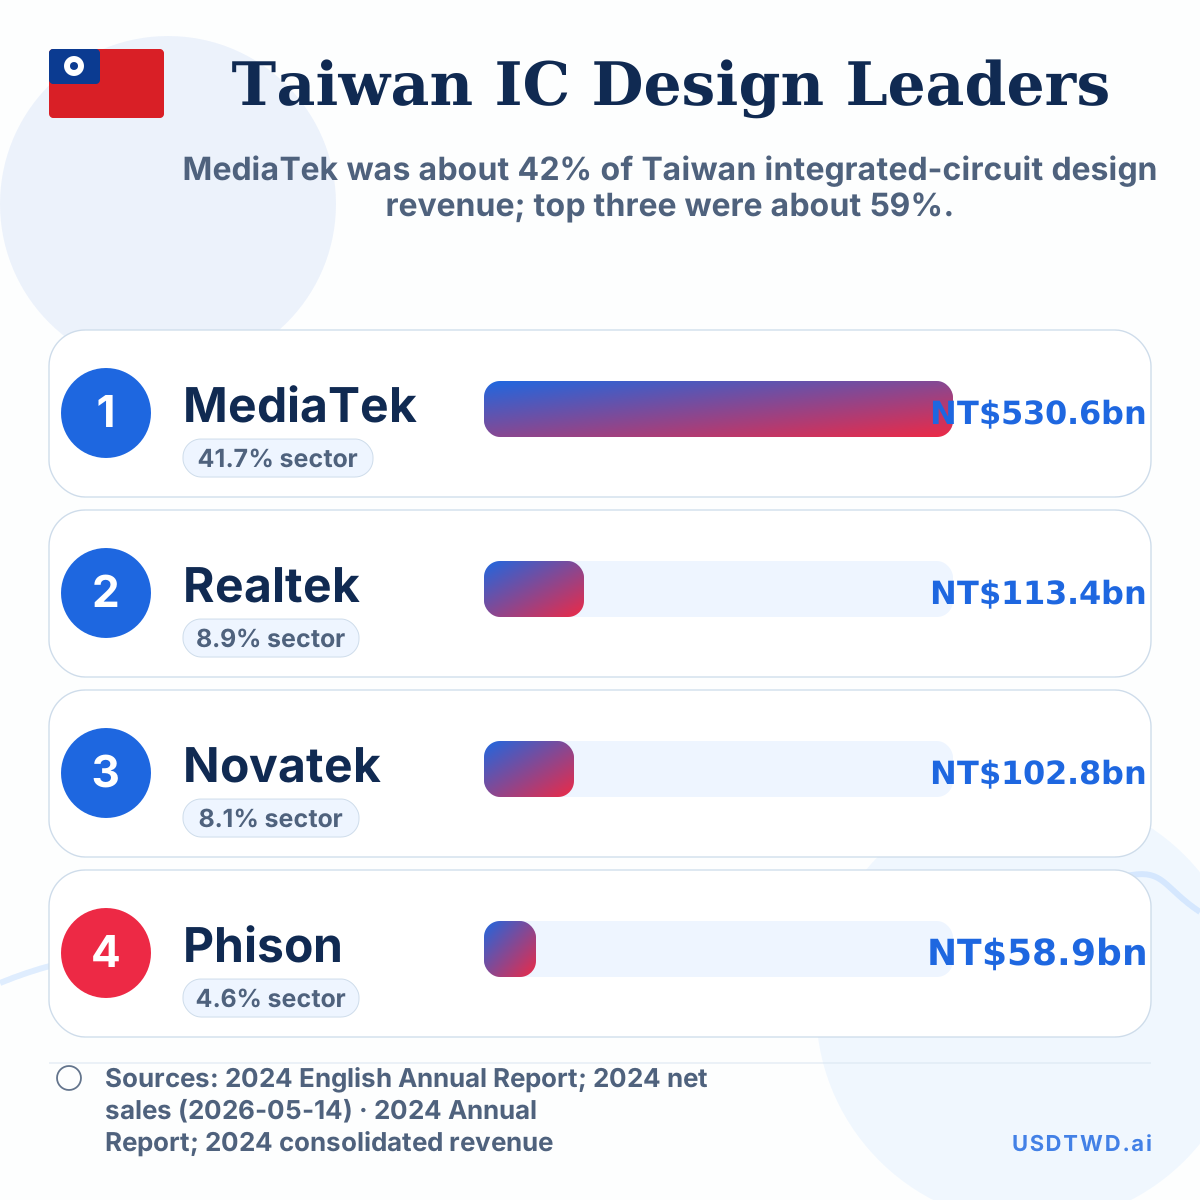
Taiwan Integrated-Circuit Design Revenue Concentration, 2024
MediaTek was about 42% of Taiwan integrated-circuit design revenue; top three were about 59%.
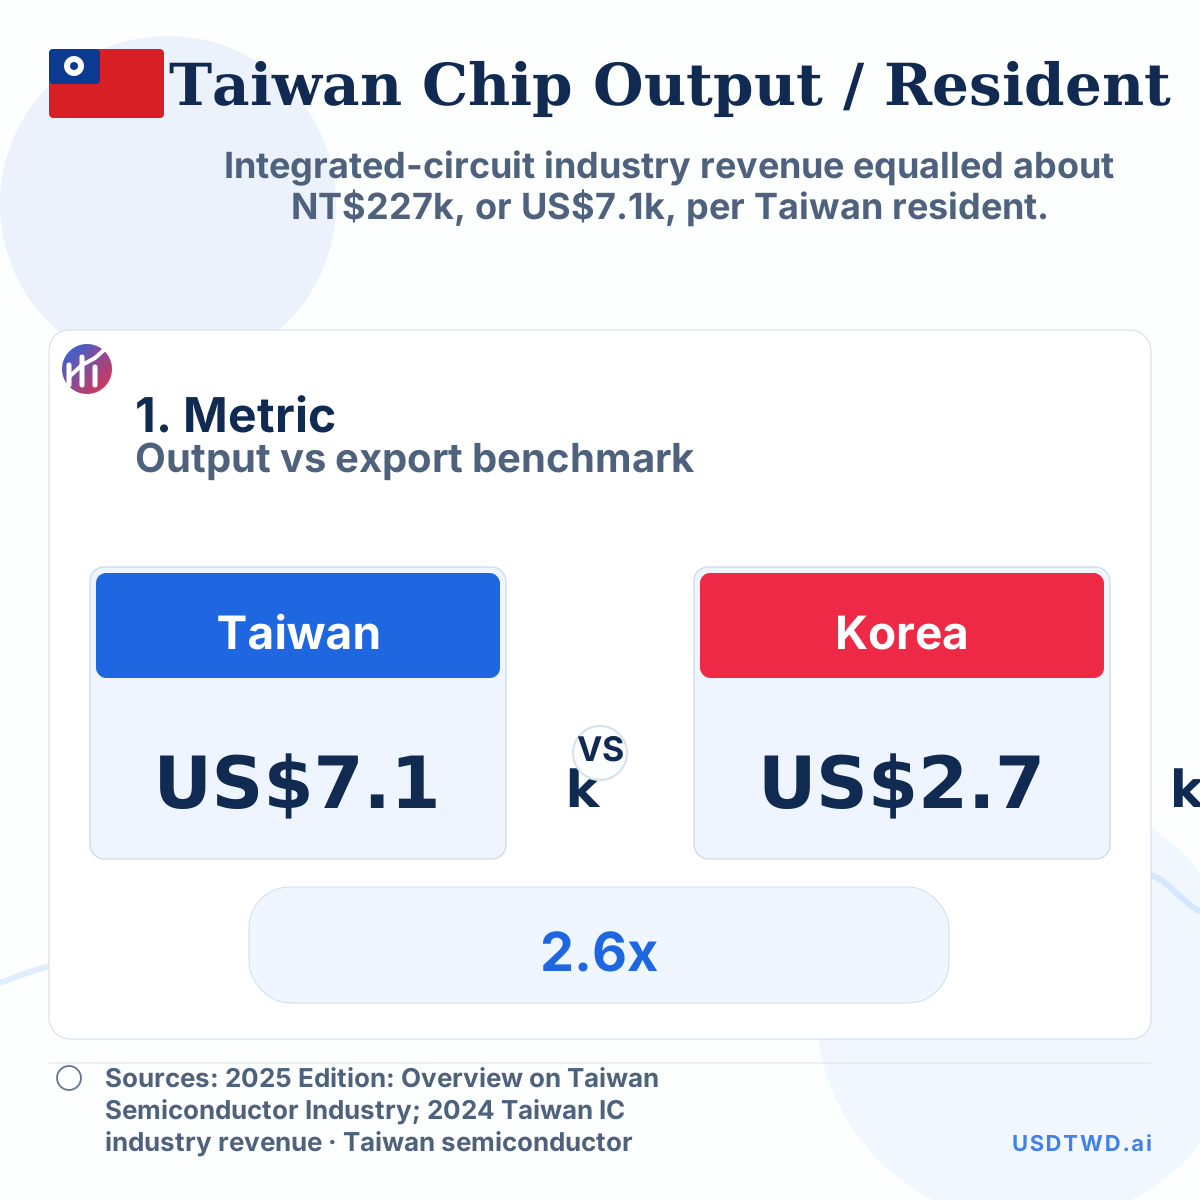
Taiwan Semiconductor Output per Resident vs Korea Export Intensity
Integrated-circuit industry revenue equalled about NT$227k, or US$7.1k, per Taiwan resident.
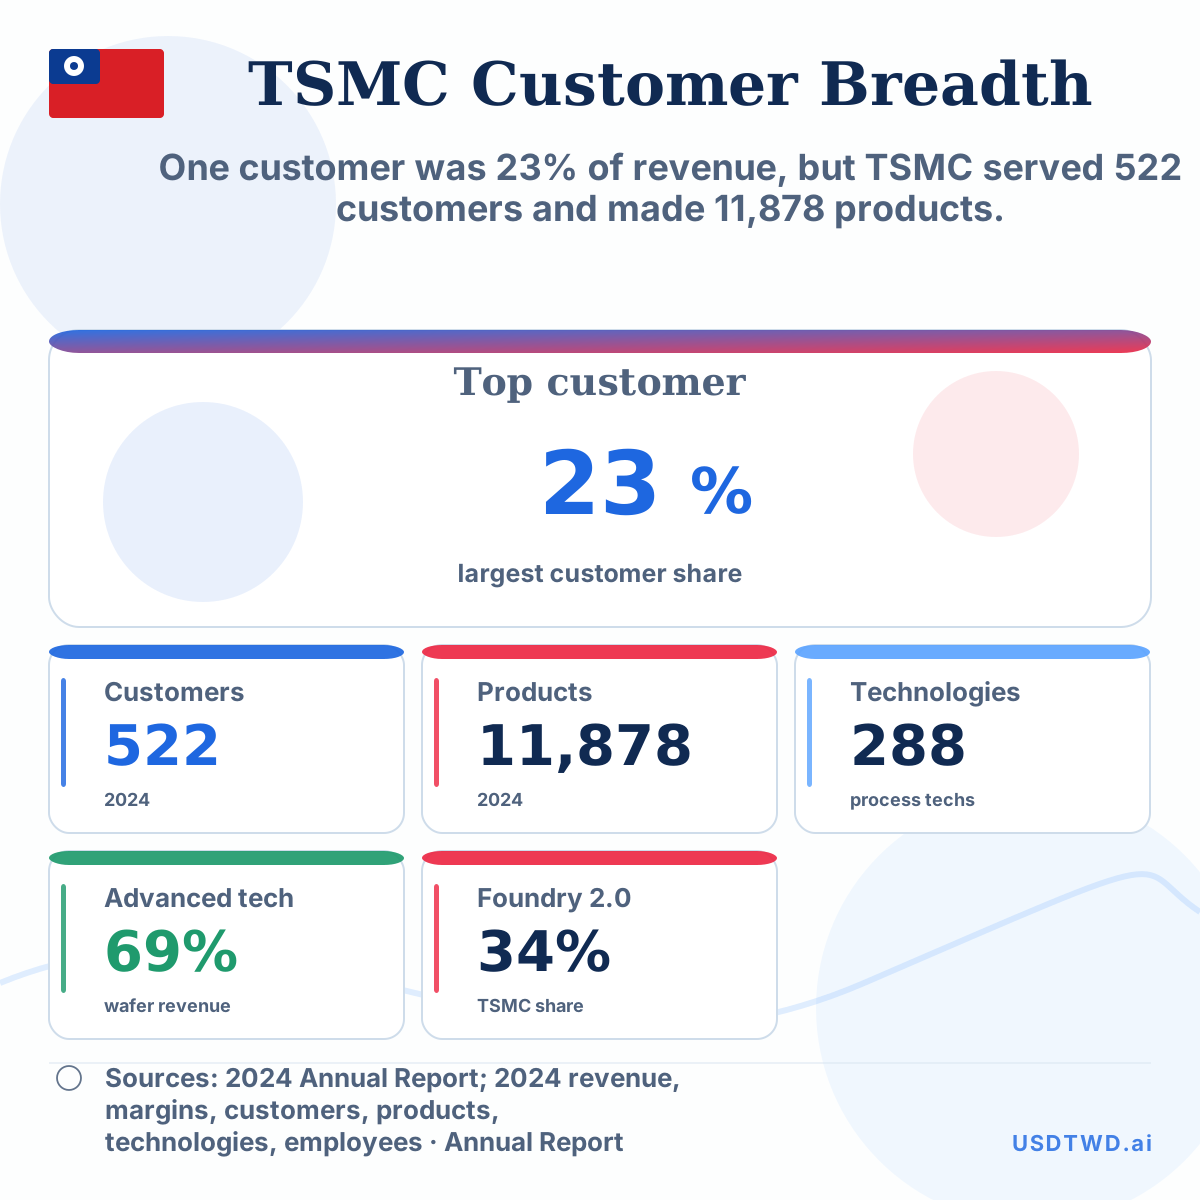
TSMC Top Customer Share vs Customer and Product Breadth
One customer was 23% of revenue, but TSMC served 522 customers and made 11,878 products.
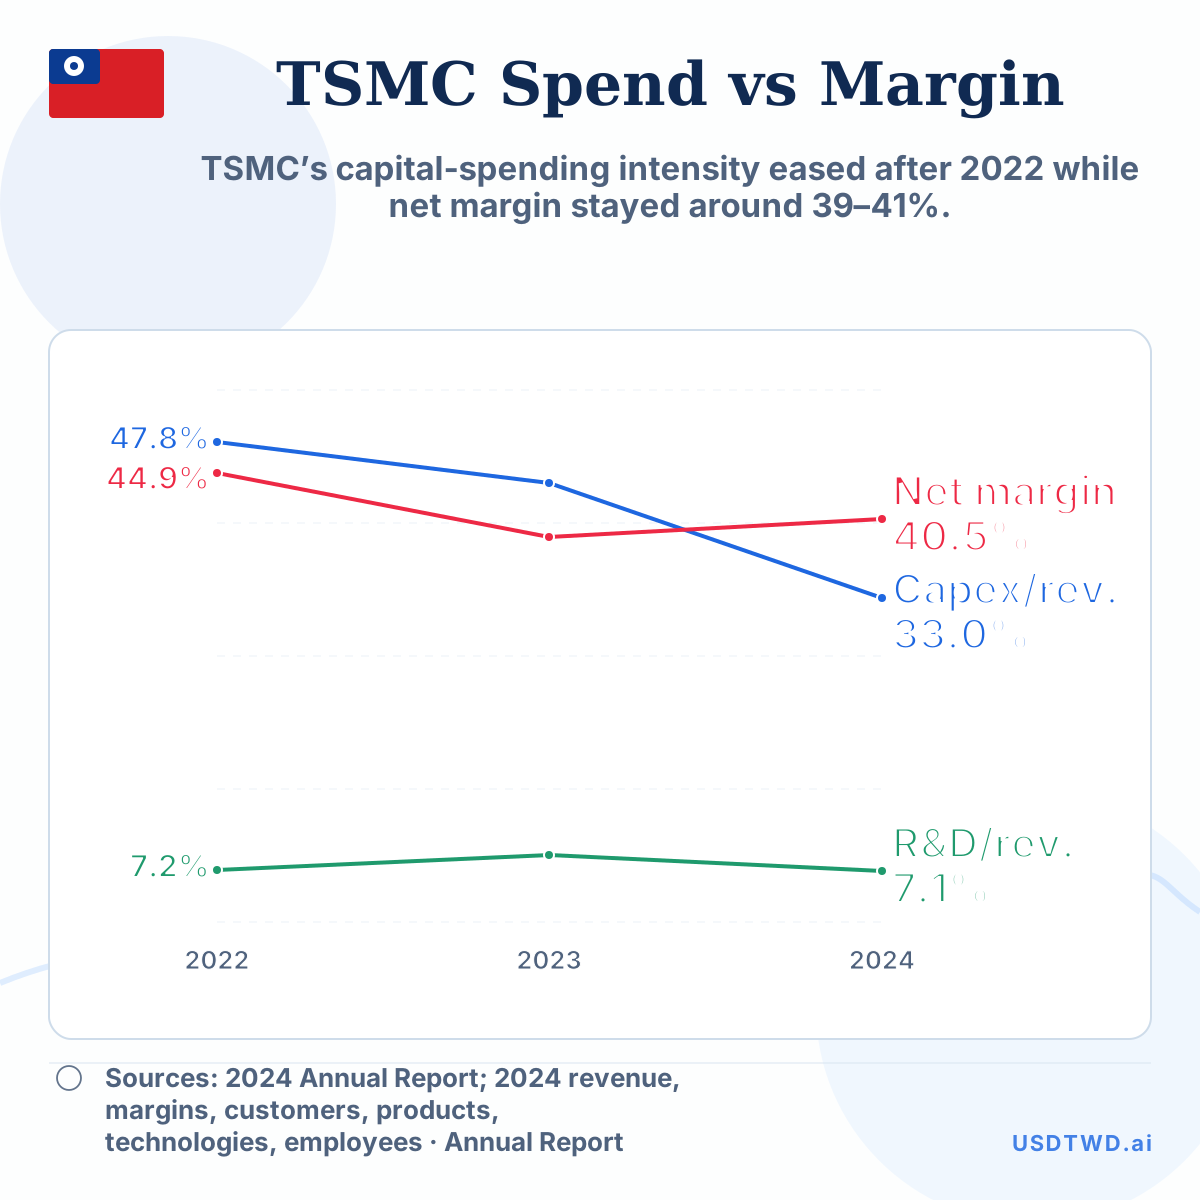
TSMC Research and Development, Capital Spending and Net Margin
TSMC’s capital-spending intensity eased after 2022 while net margin stayed around 39–41%.
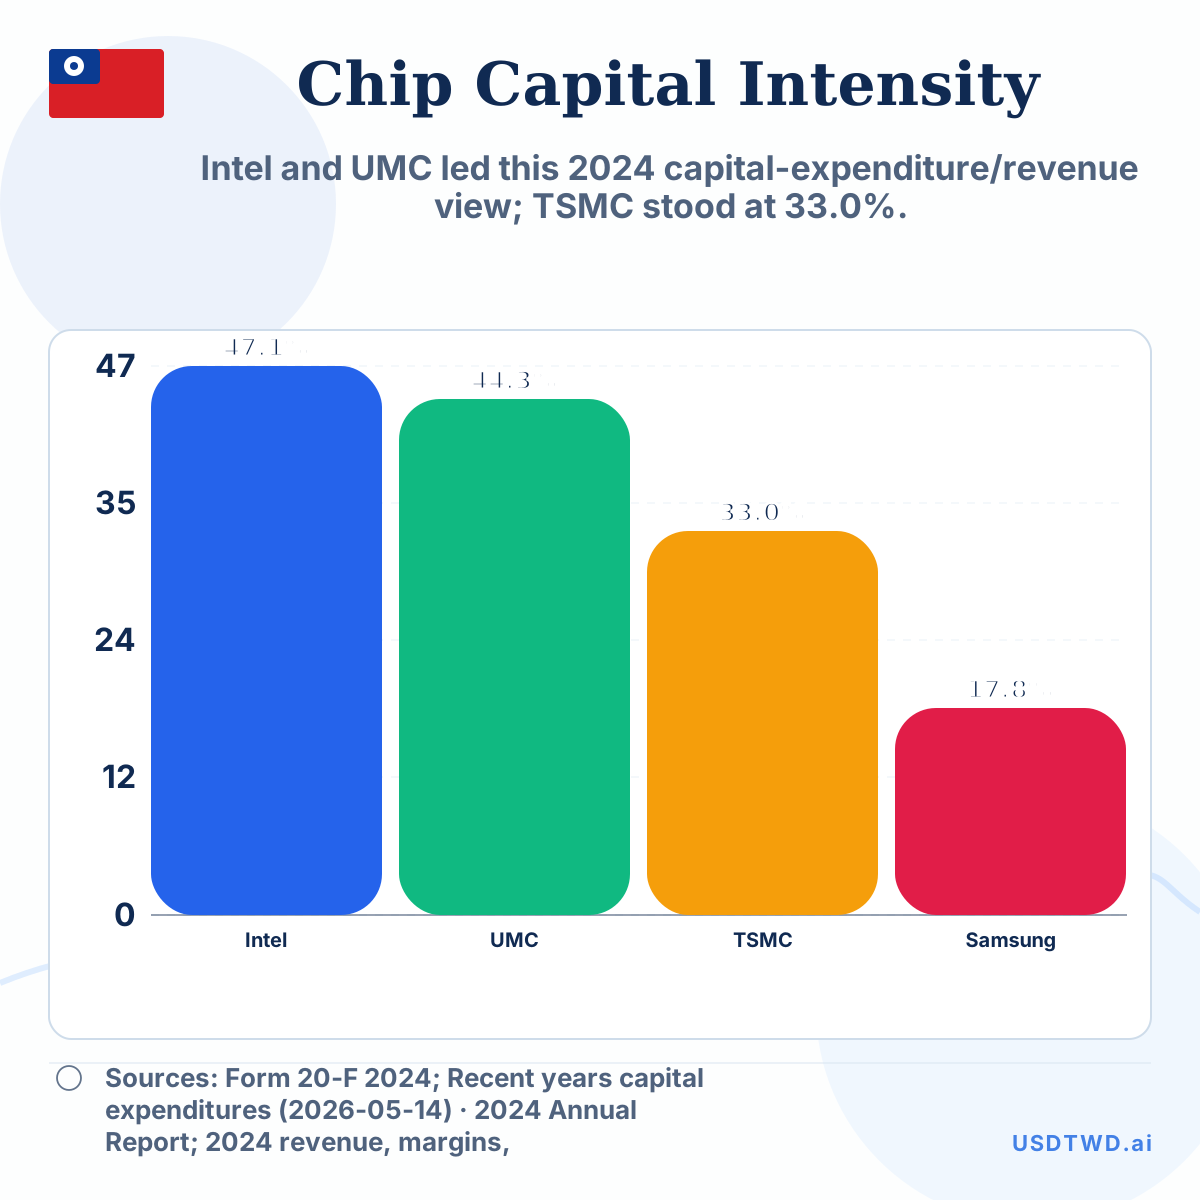
TSMC Capital-Expenditure Intensity vs Intel, Samsung and UMC
Intel and UMC led this 2024 capital-expenditure/revenue view; TSMC stood at 33.0%.
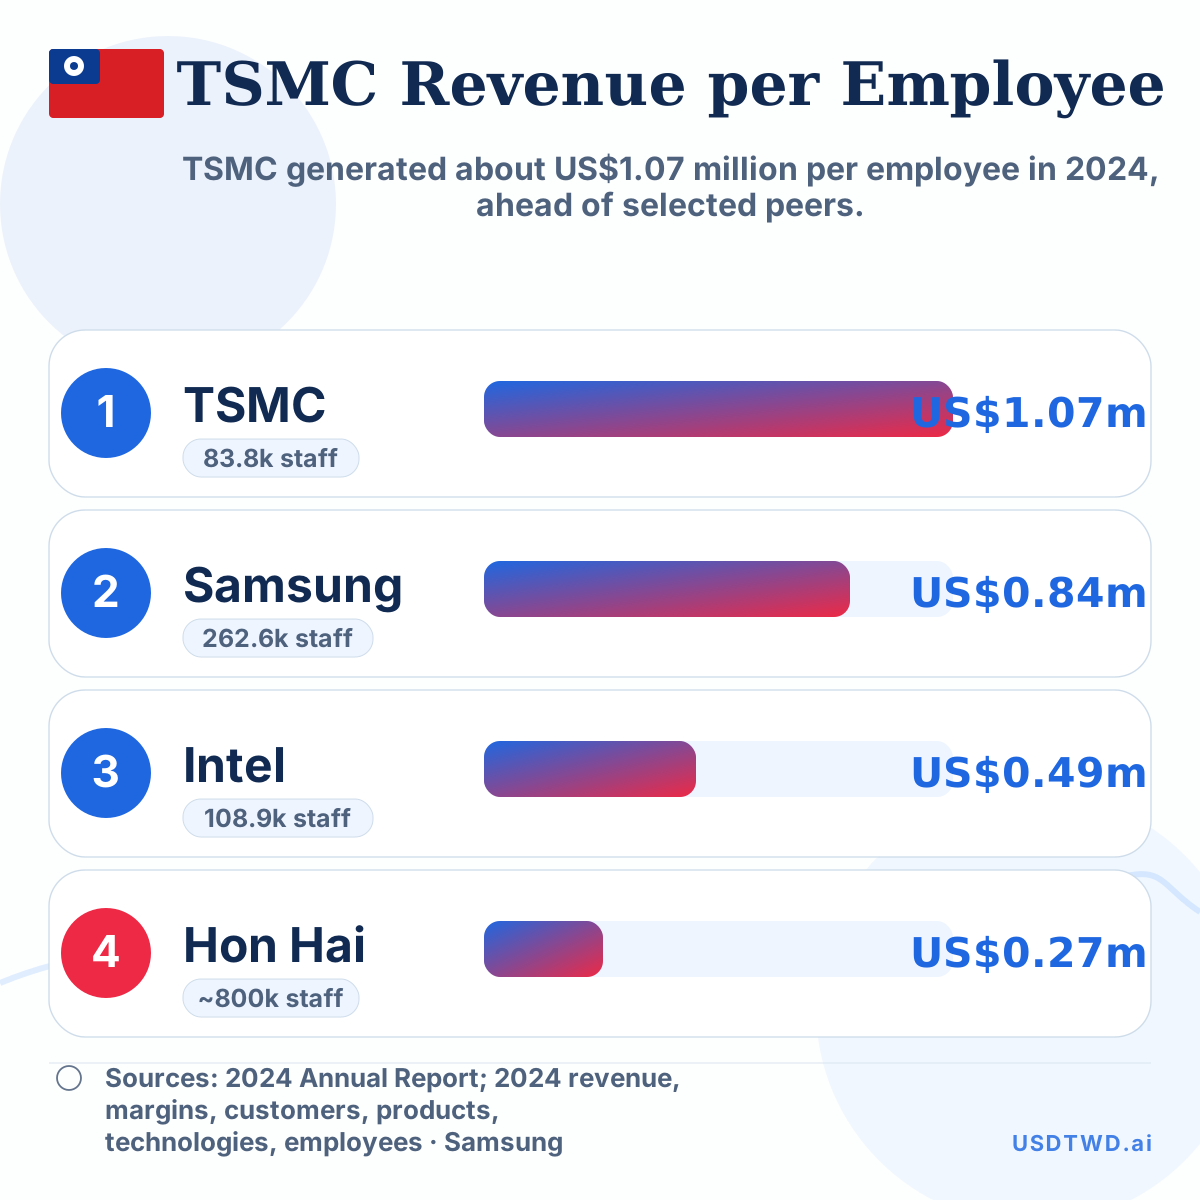
TSMC Revenue per Employee Versus Samsung, Intel and Hon Hai
TSMC generated about US$1.07 million per employee in 2024, ahead of selected peers.
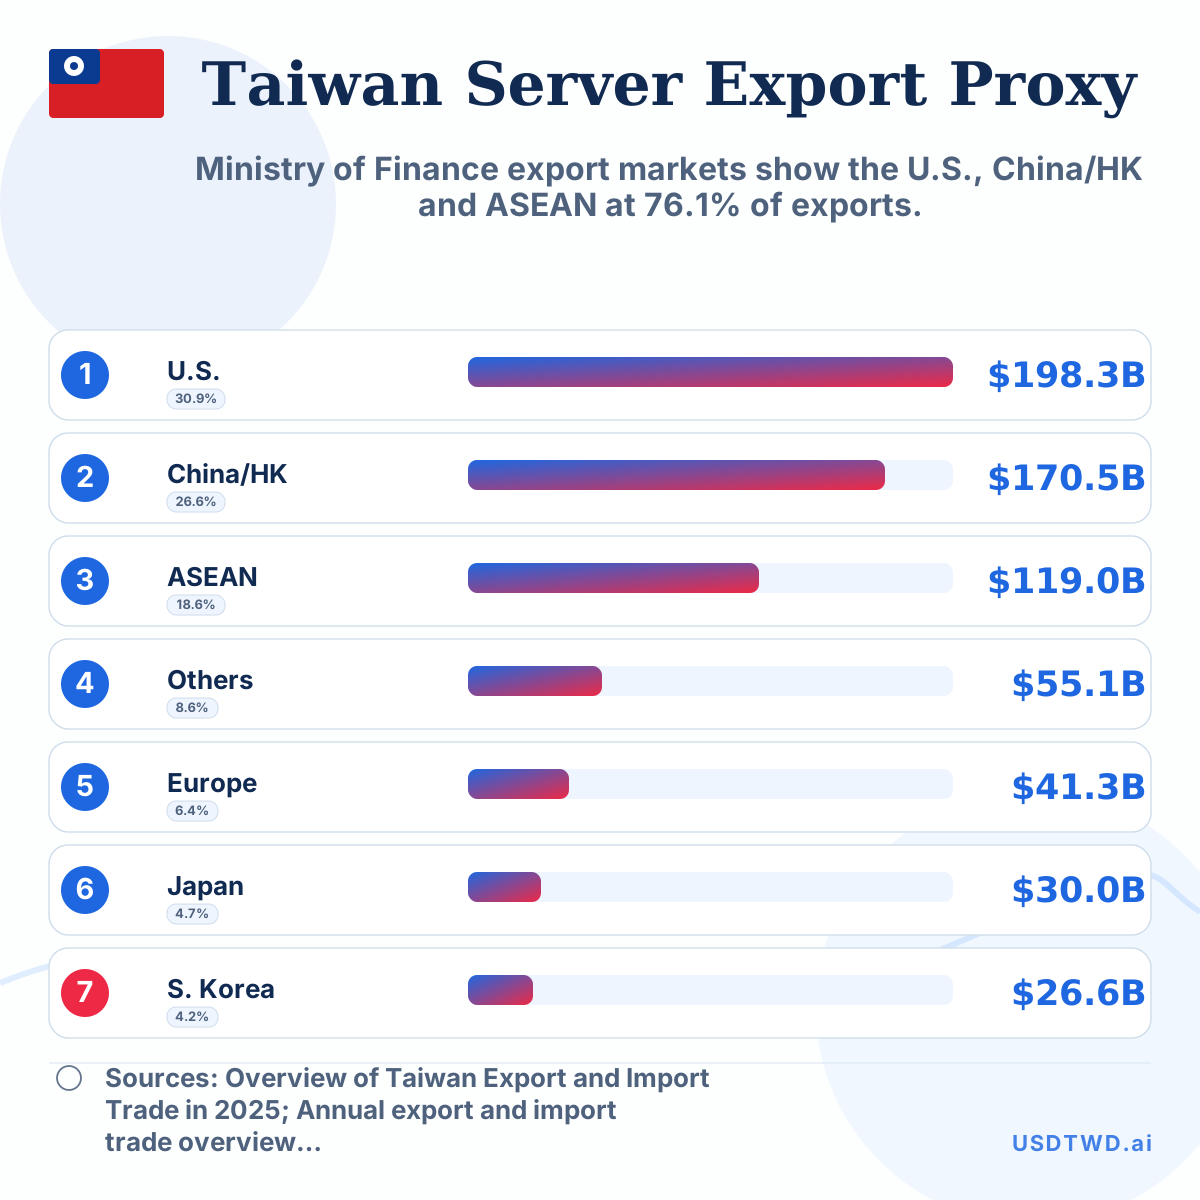
Taiwan Server-Export Destination Proxy, 2025
Ministry of Finance export markets show the U.S., China/HK and ASEAN at 76.1% of exports.
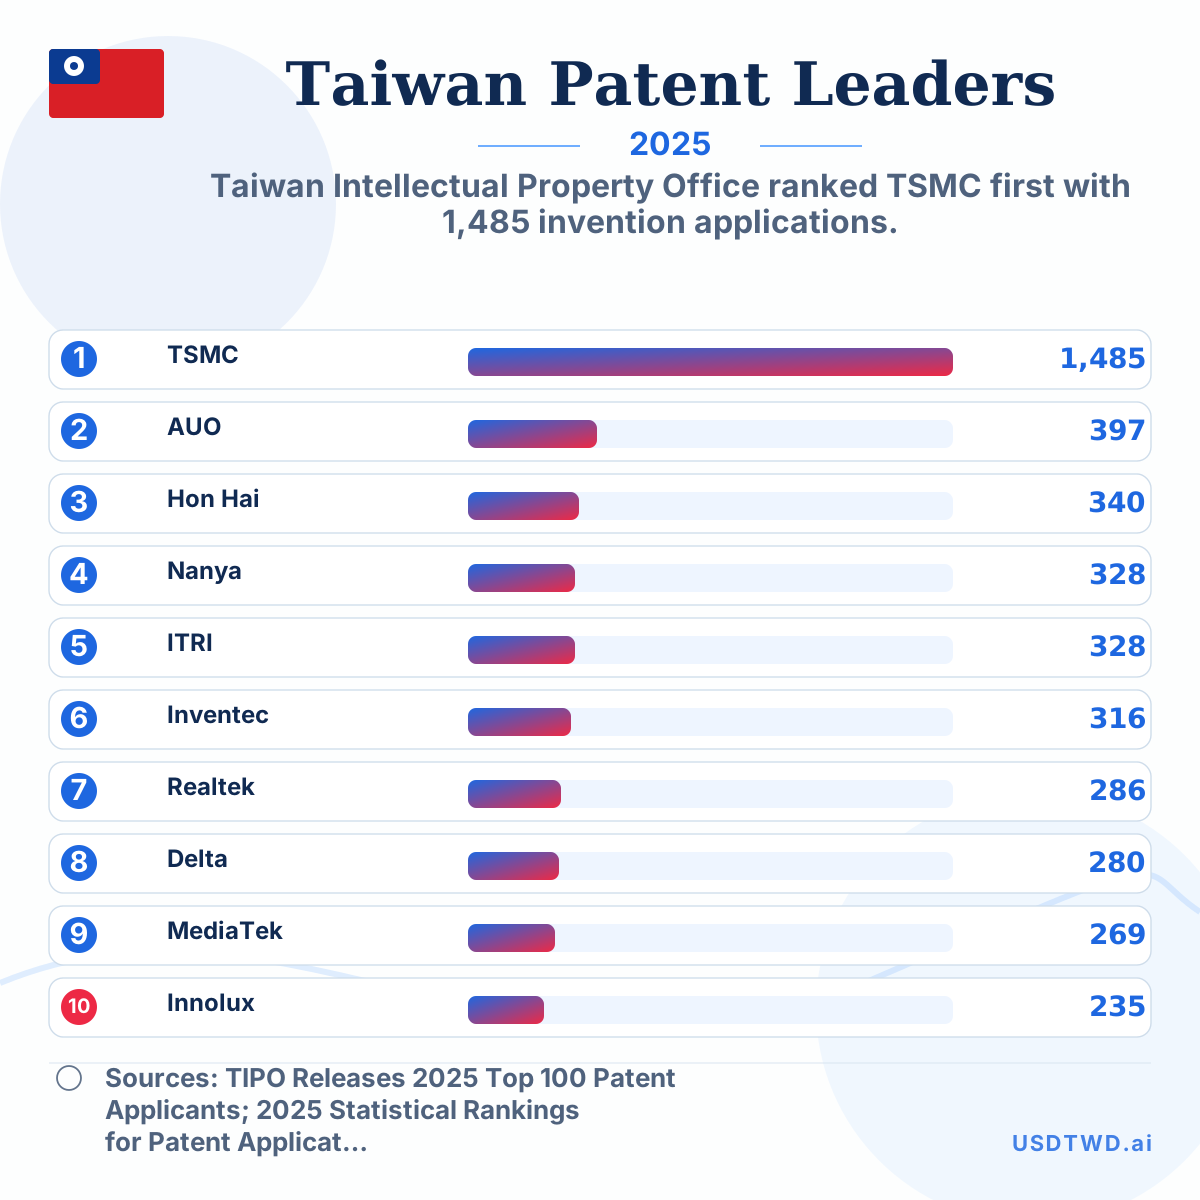
Taiwan Domestic Invention Patent Leaders, 2025
Taiwan Intellectual Property Office ranked TSMC first with 1,485 invention applications.
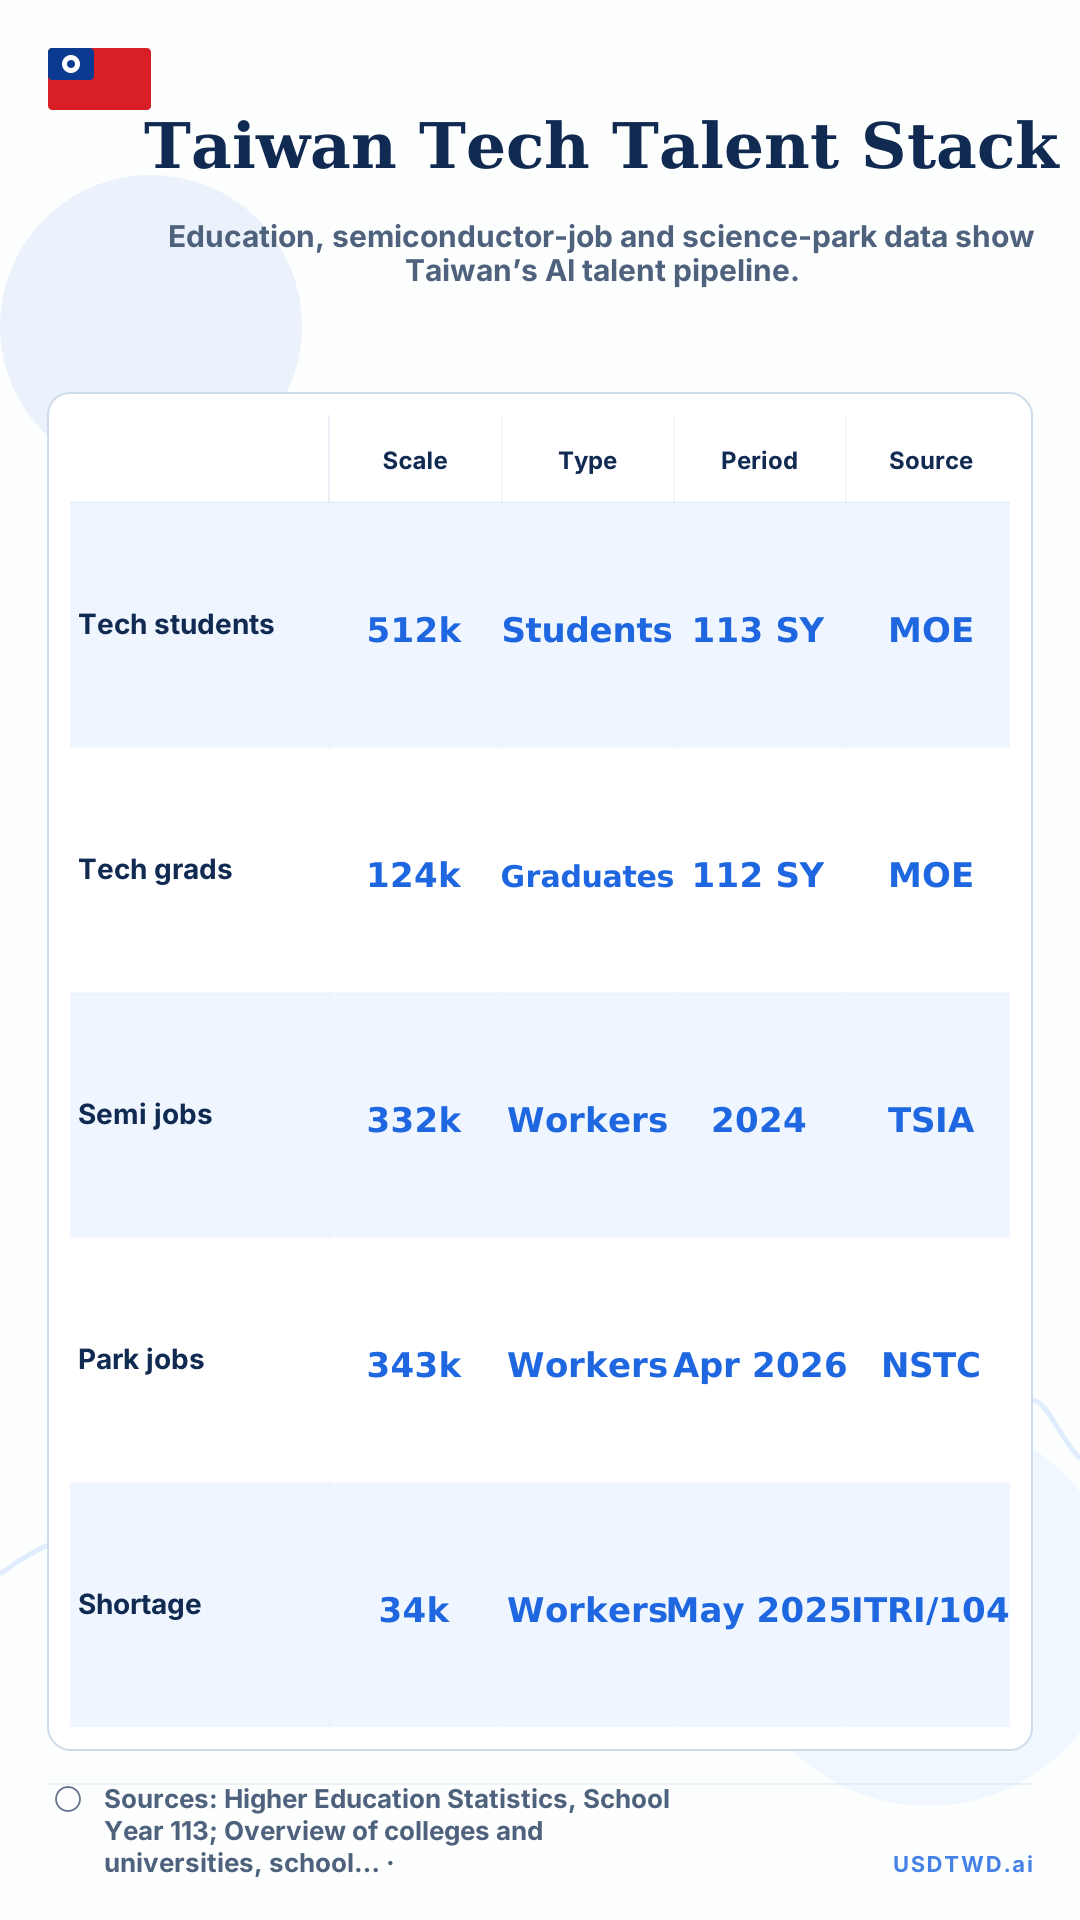
Taiwan AI Talent Pipeline: Students, Jobs and Shortage
Education, semiconductor-job and science-park data show Taiwan’s AI talent pipeline.
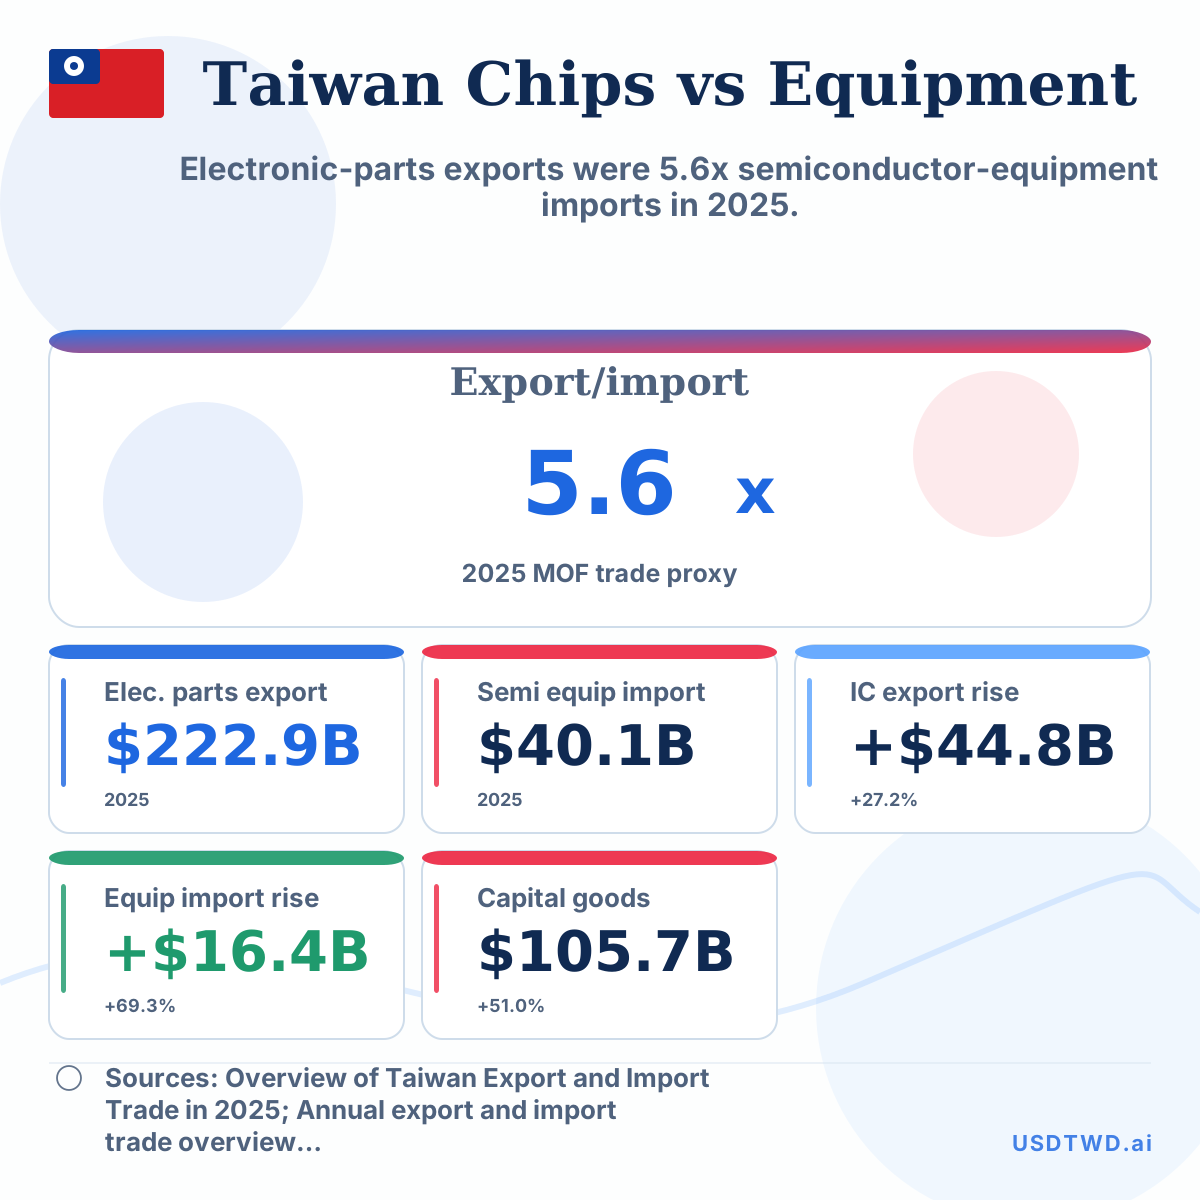
Taiwan Chip Exports Versus Semiconductor Equipment Imports, 2025
Electronic-parts exports were 5.6x semiconductor-equipment imports in 2025.
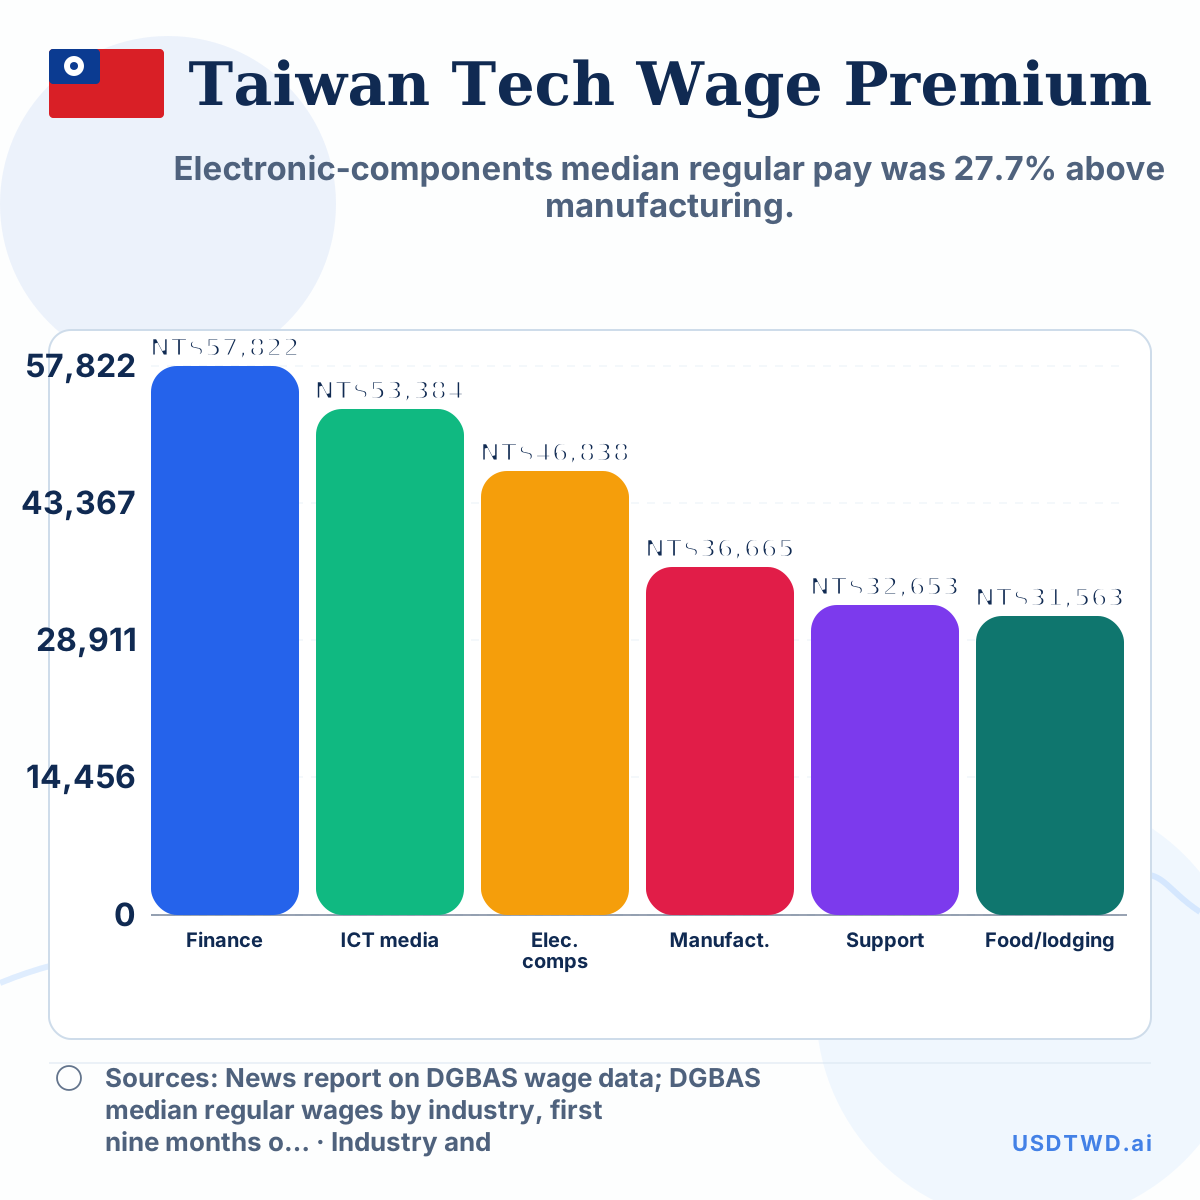
Taiwan Electronics Manufacturing Wage Premium, 2025
Electronic-components median regular pay was 27.7% above manufacturing.
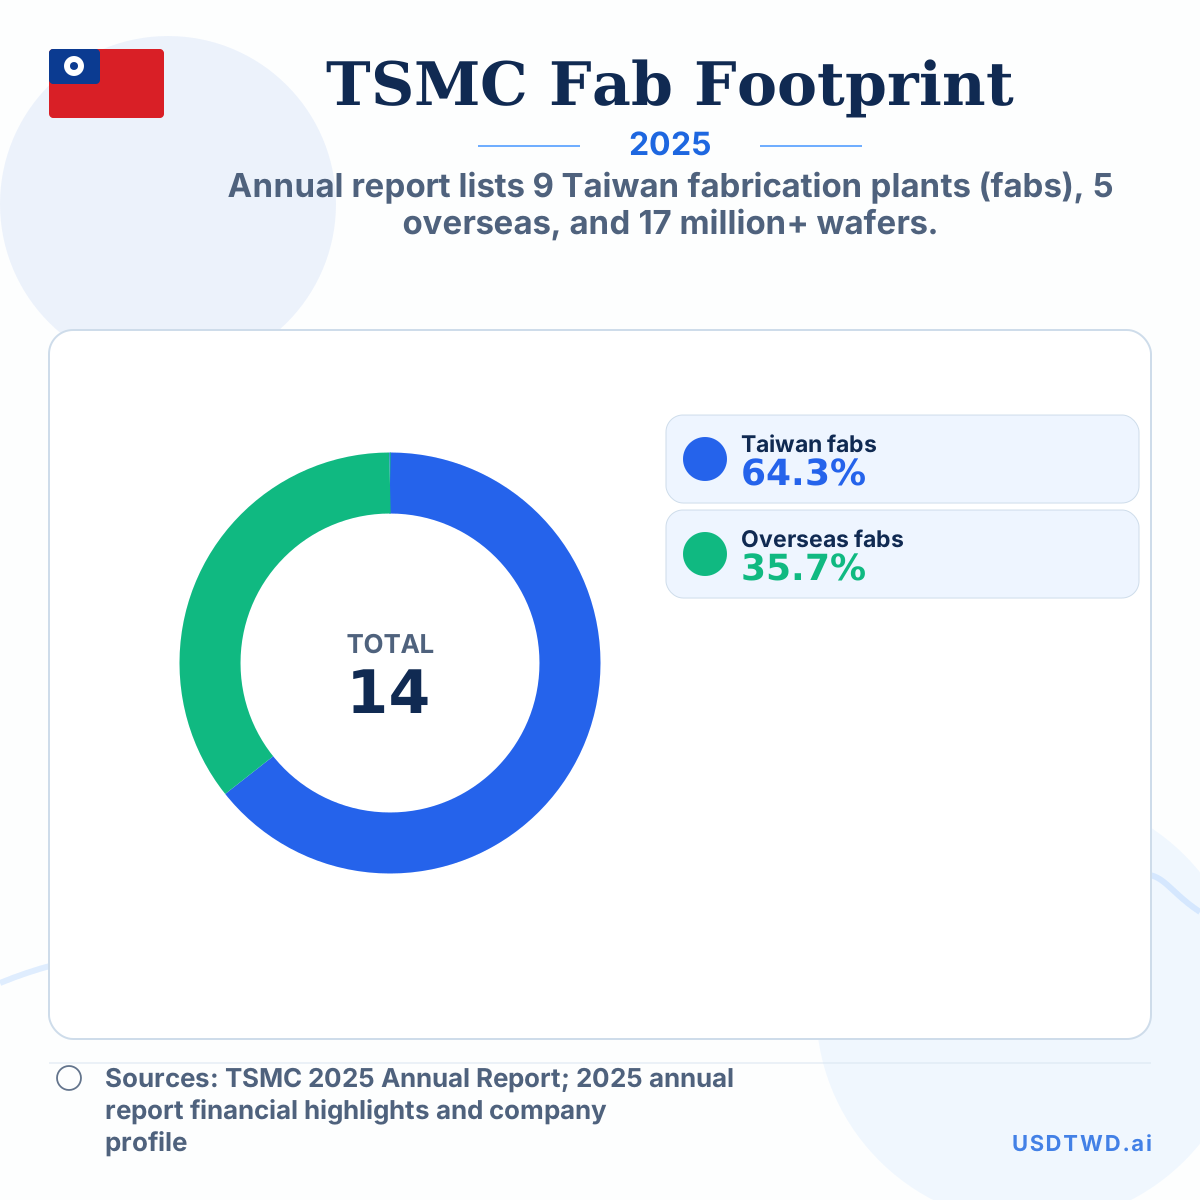
TSMC Taiwan and Overseas Fab Footprint, 2025
Annual report lists 9 Taiwan fabrication plants (fabs), 5 overseas, and 17 million+ wafers.
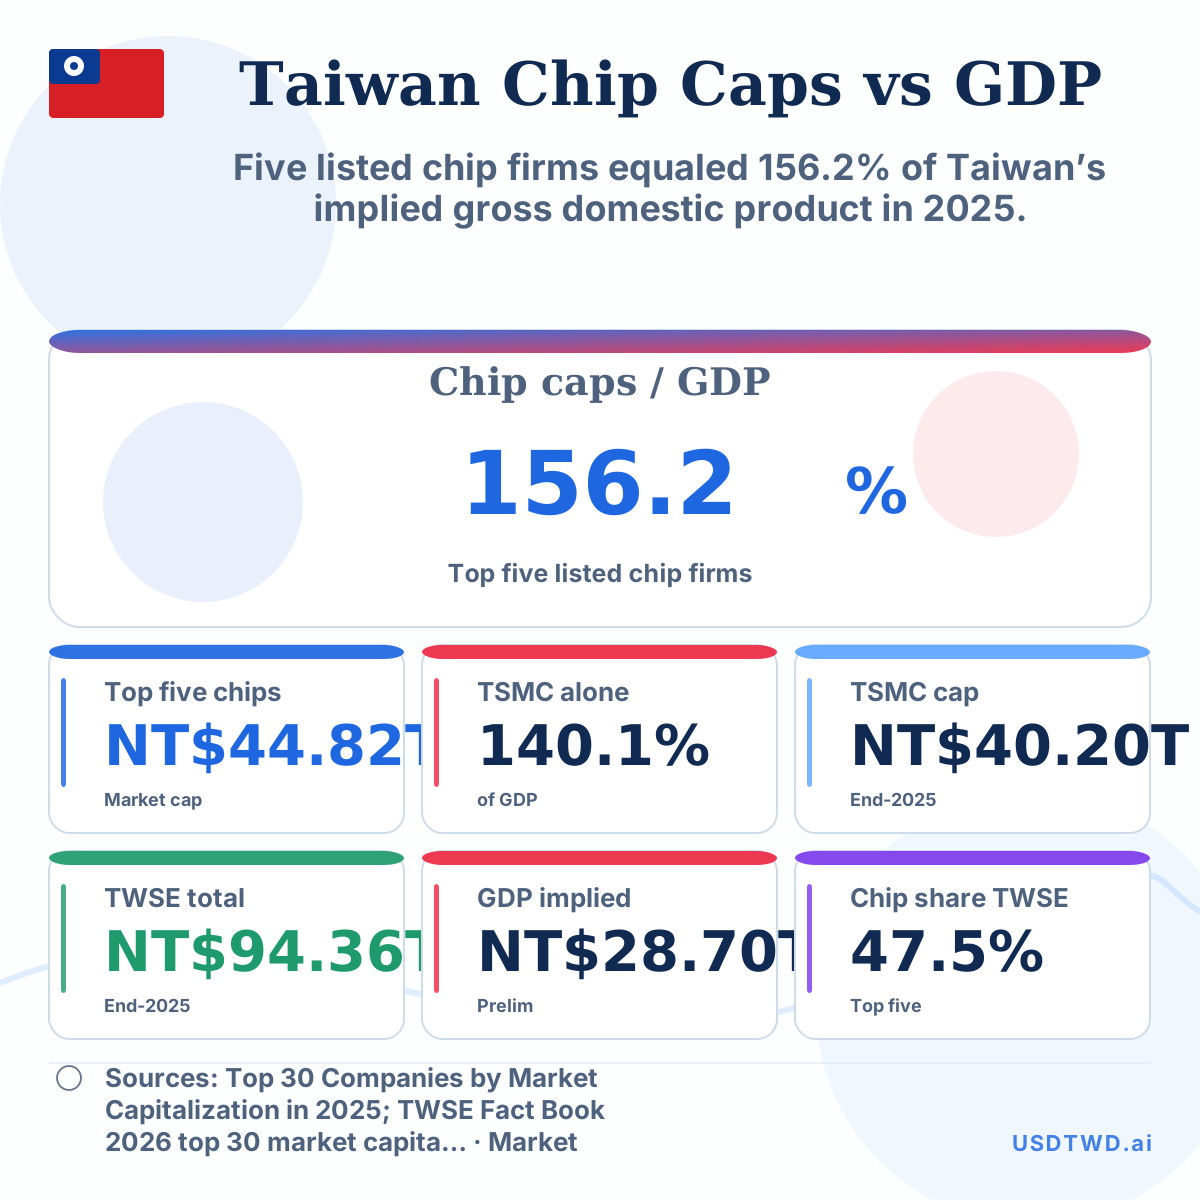
Taiwan Chip-Firm Market Cap Versus Gross Domestic Product, 2025
Five listed chip firms equaled 156.2% of Taiwan’s implied gross domestic product in 2025.
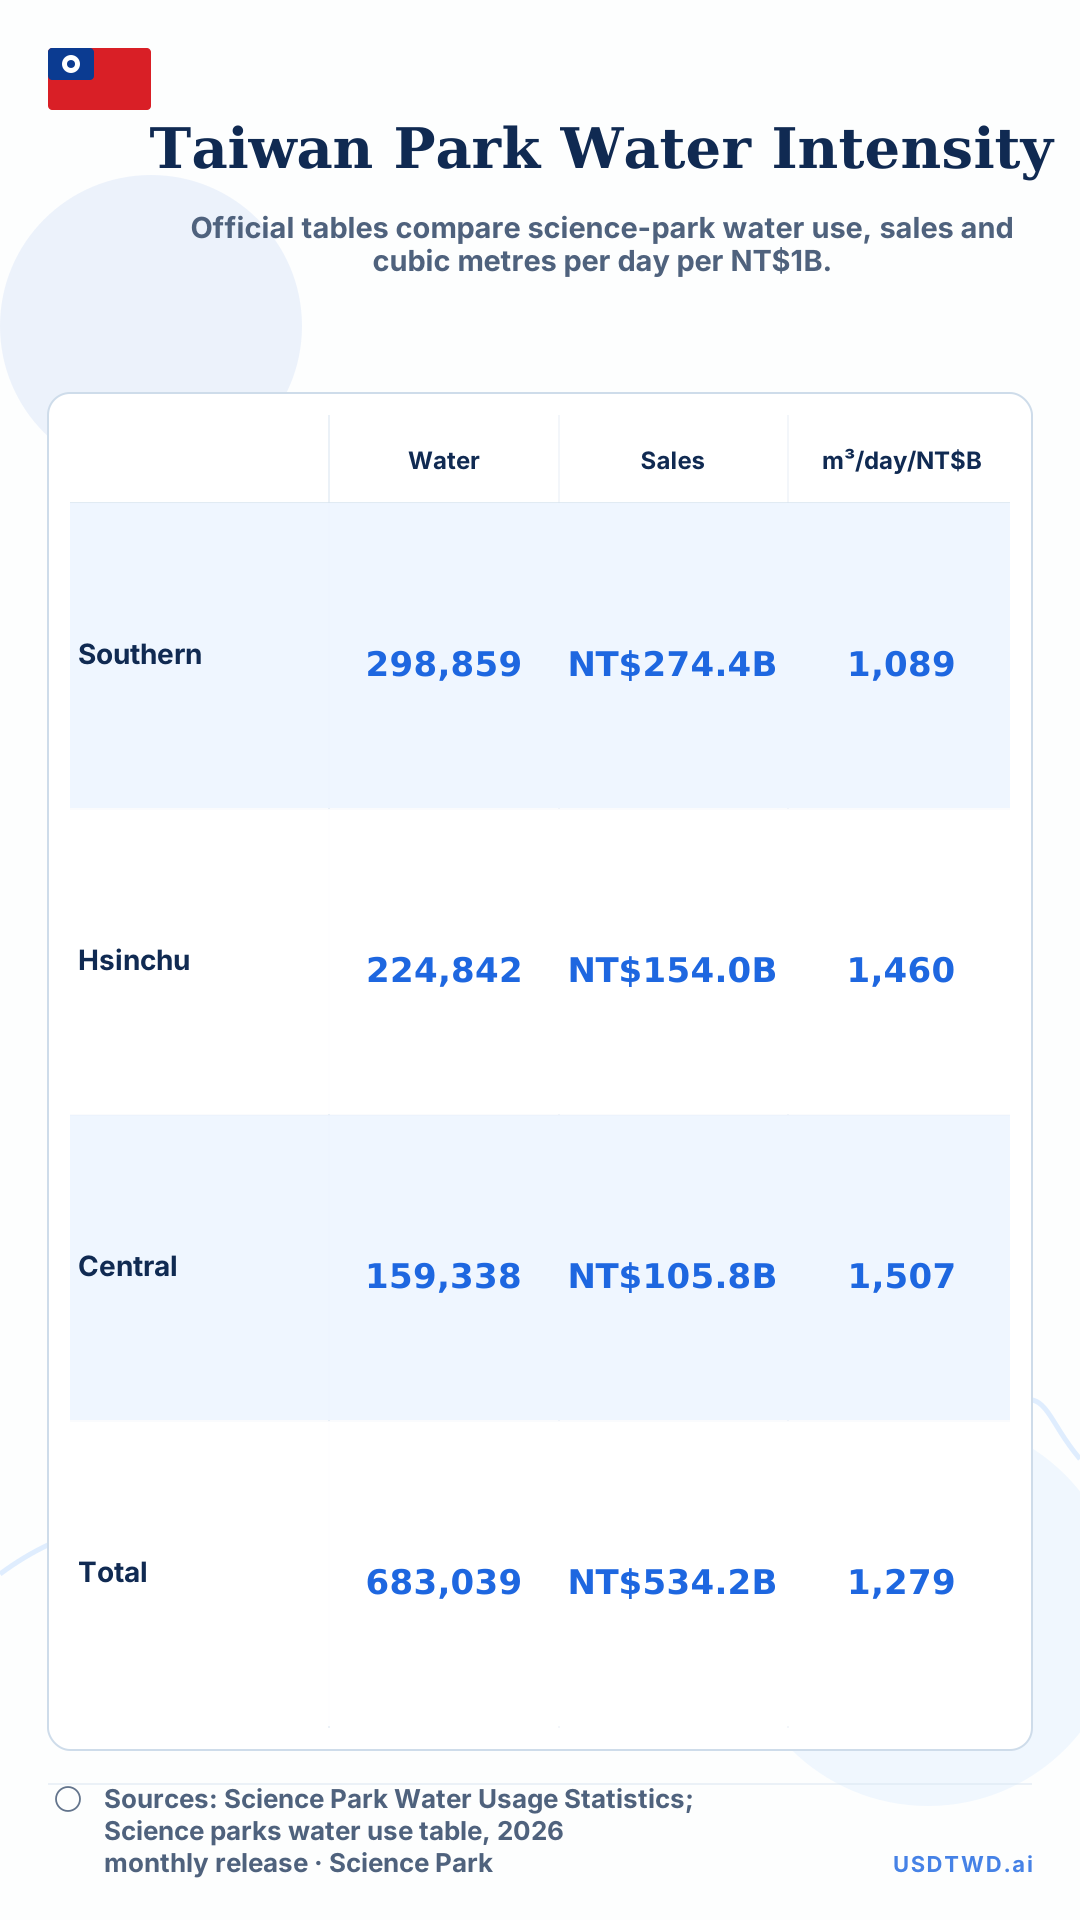
Taiwan Science Park Water Use per Revenue Dollar
Official tables compare science-park water use, sales and cubic metres per day per NT$1B.
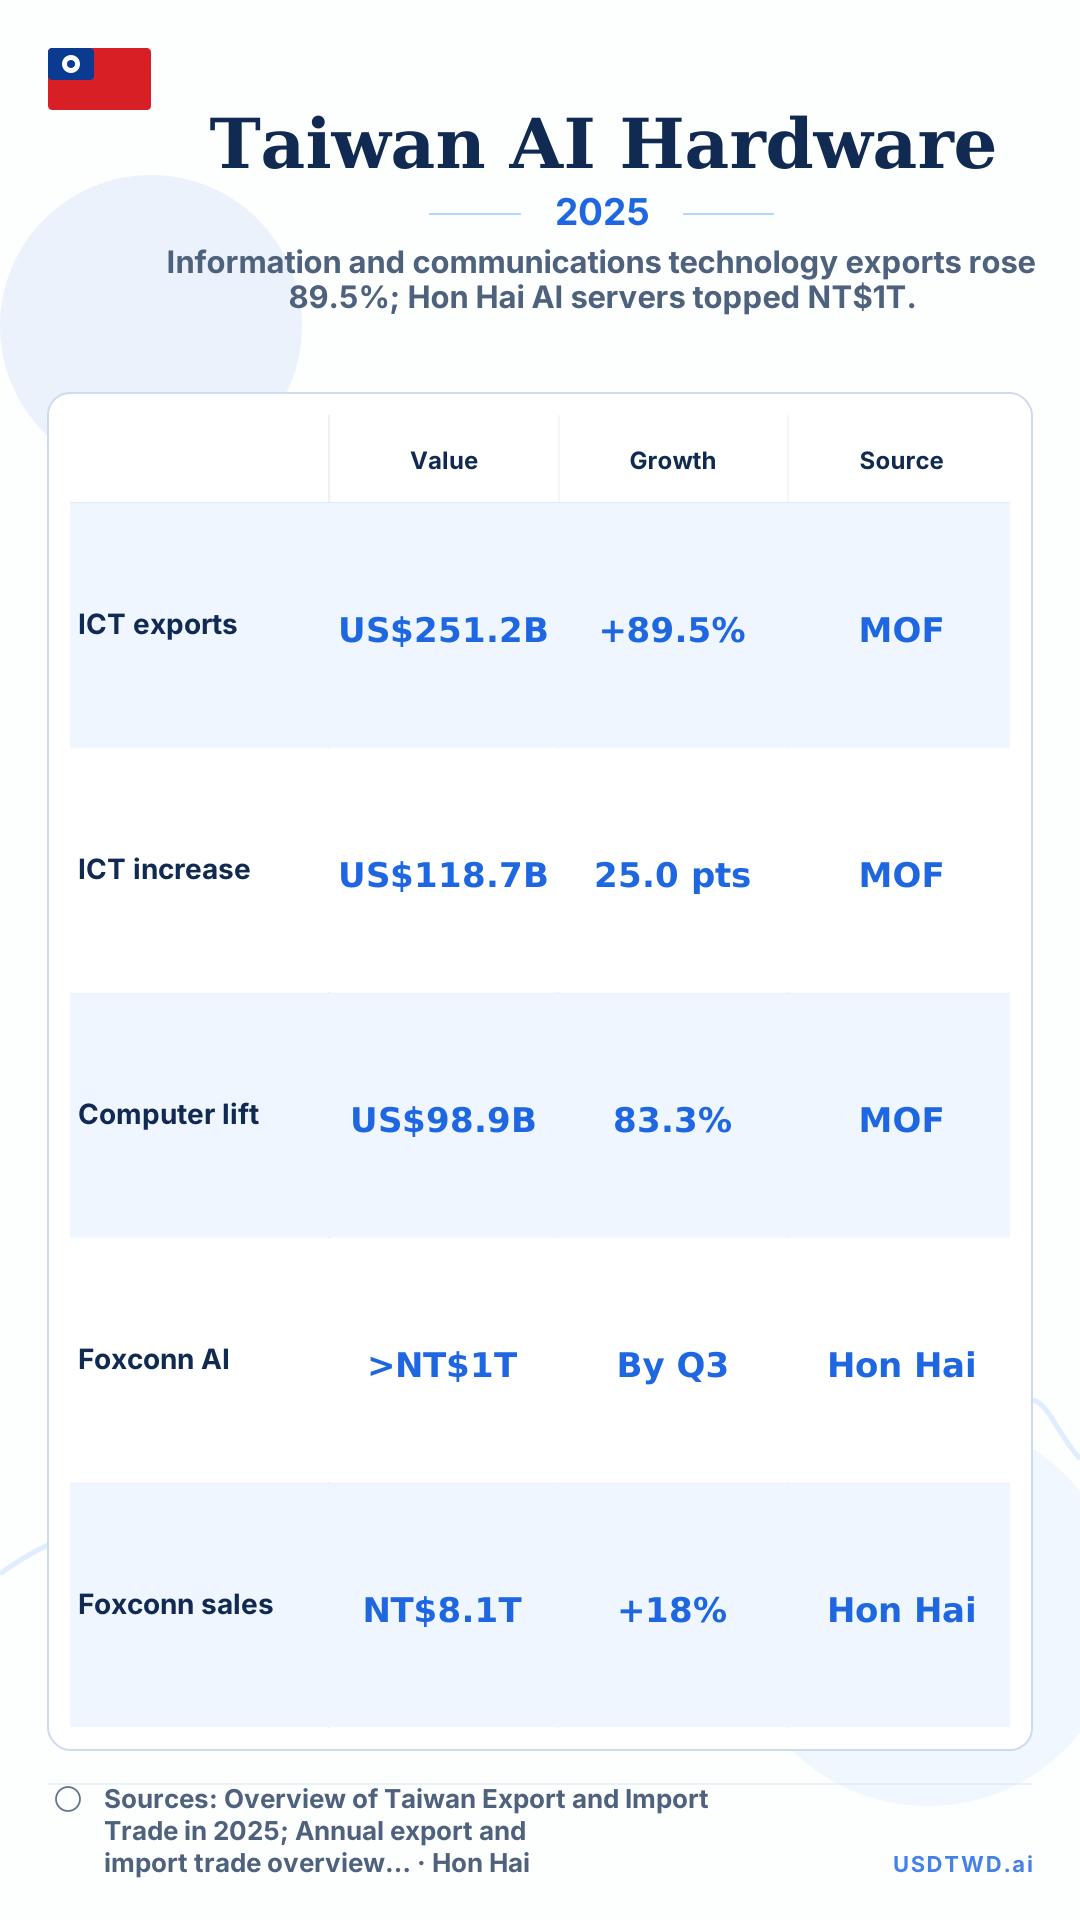
Taiwan AI Hardware Exports Versus Hon Hai Revenue, 2025
Information and communications technology exports rose 89.5%; Hon Hai AI servers topped NT$1T.
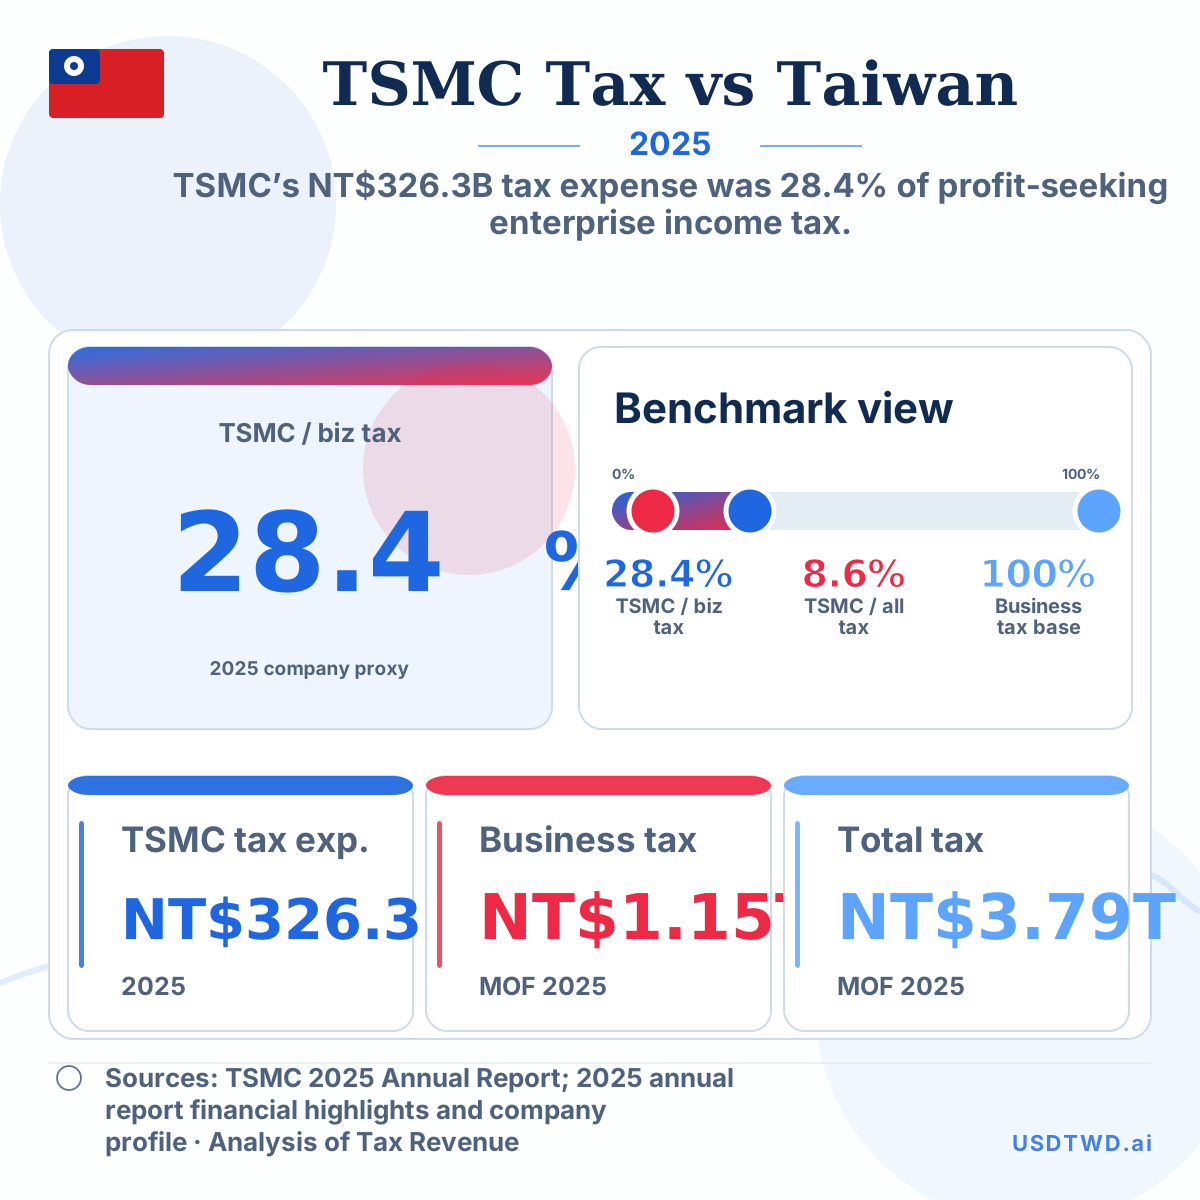
TSMC Income Tax Expense Versus Taiwan Tax Revenue, 2025
TSMC’s NT$326.3B tax expense was 28.4% of profit-seeking enterprise income tax.
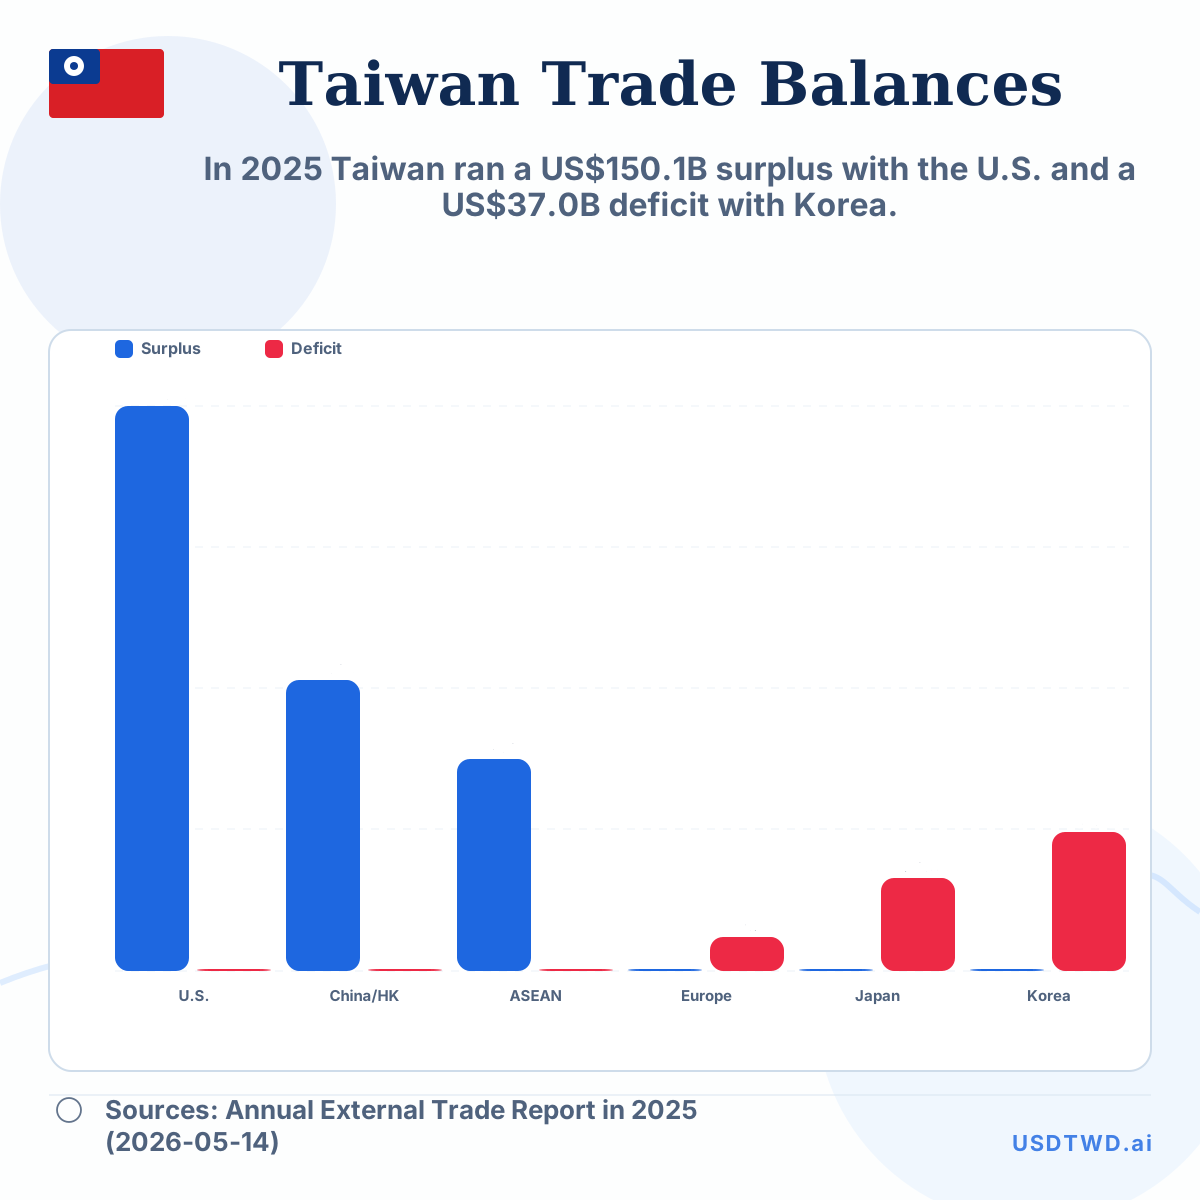
Taiwan top-country trade-balance map without map
In 2025 Taiwan ran a US$150.1B surplus with the U.S. and a US$37.0B deficit with Korea.
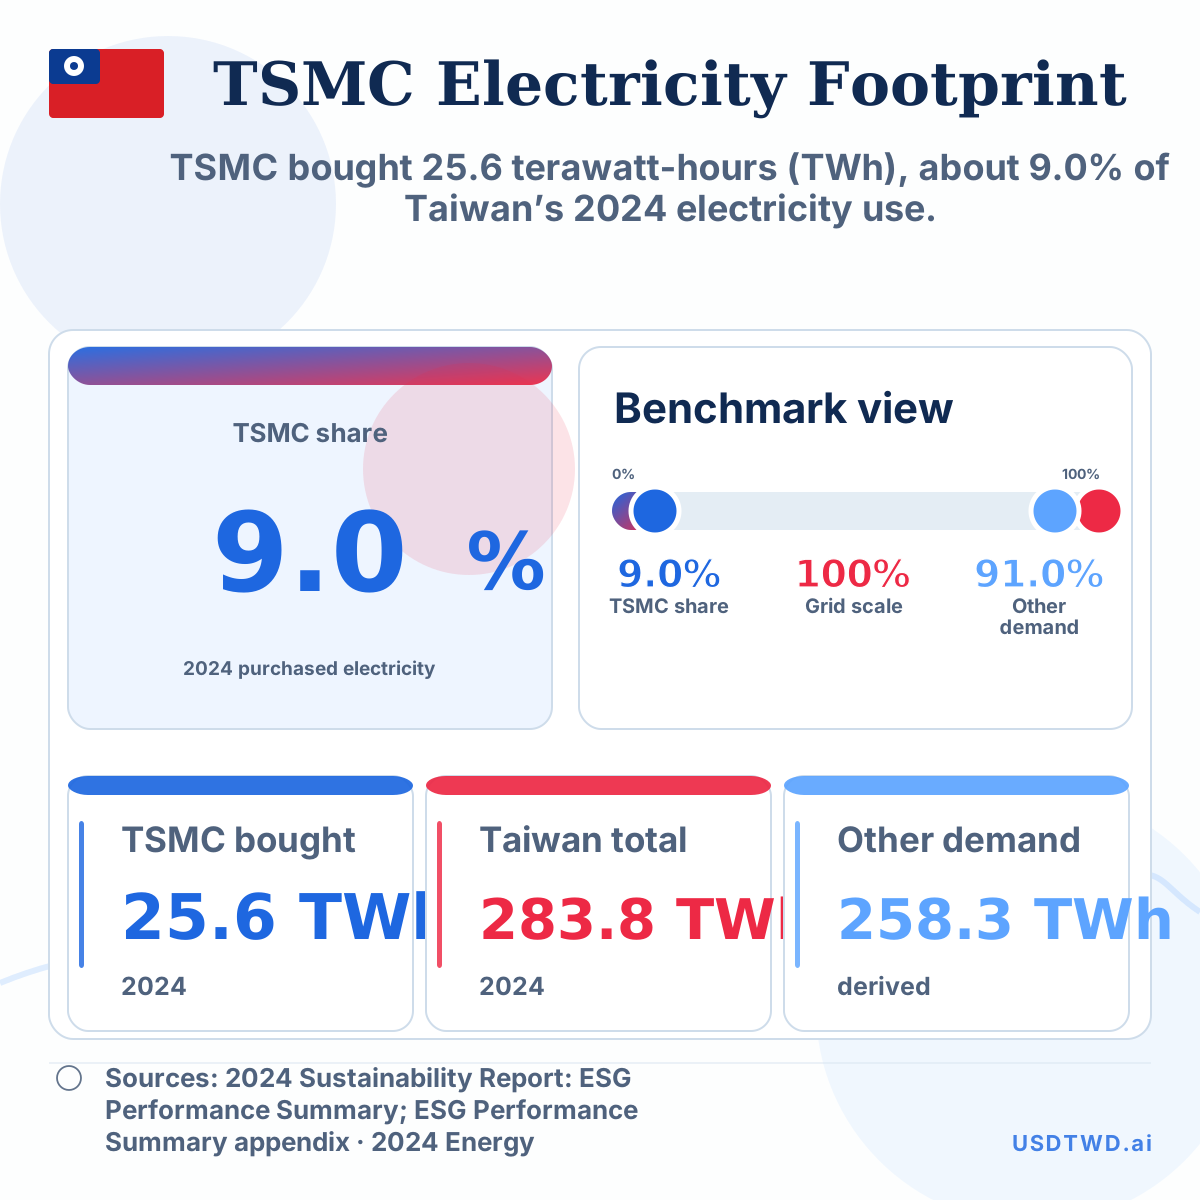
TSMC electricity use versus Taiwan demand
TSMC bought 25.6 terawatt-hours (TWh), about 9.0% of Taiwan’s 2024 electricity use.
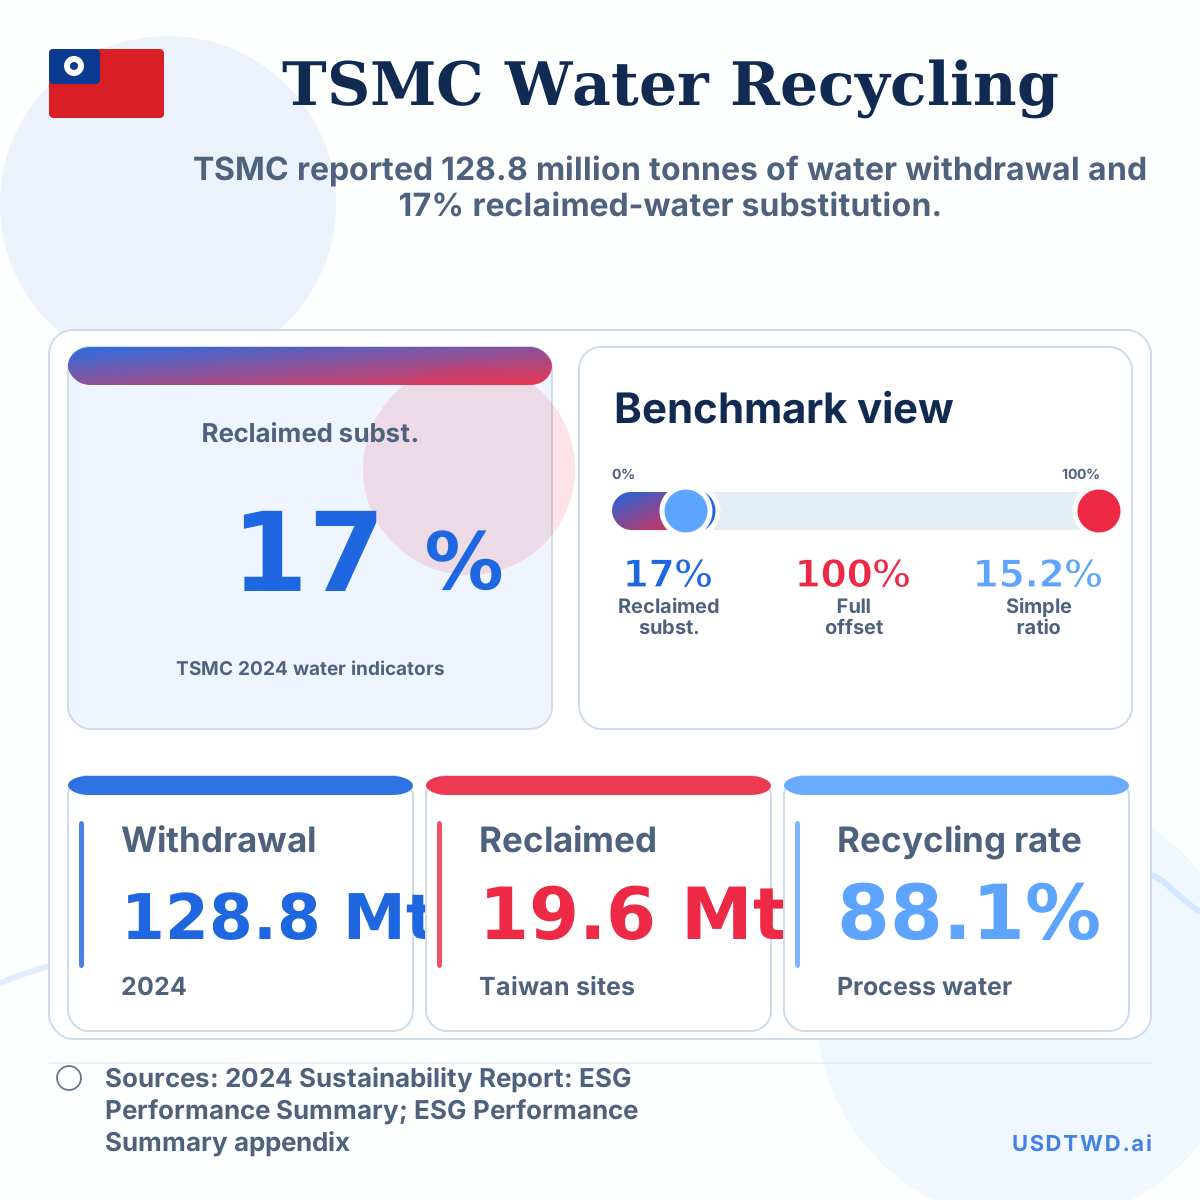
TSMC water recycling versus water withdrawal
TSMC reported 128.8 million tonnes of water withdrawal and 17% reclaimed-water substitution.
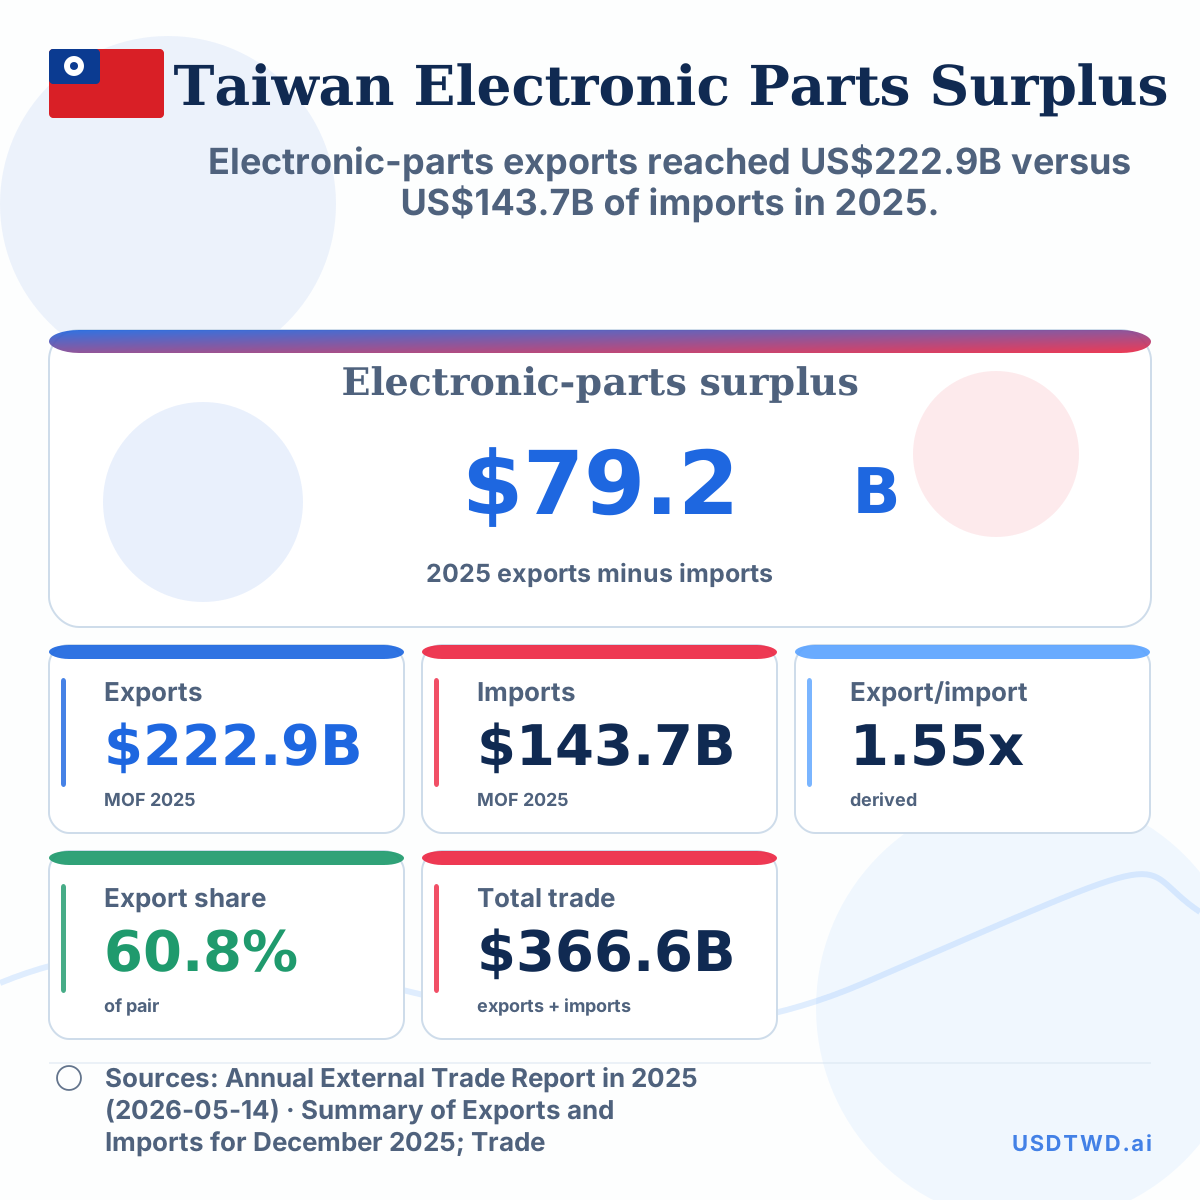
Taiwan electronic-parts export surplus
Electronic-parts exports reached US$222.9B versus US$143.7B of imports in 2025.
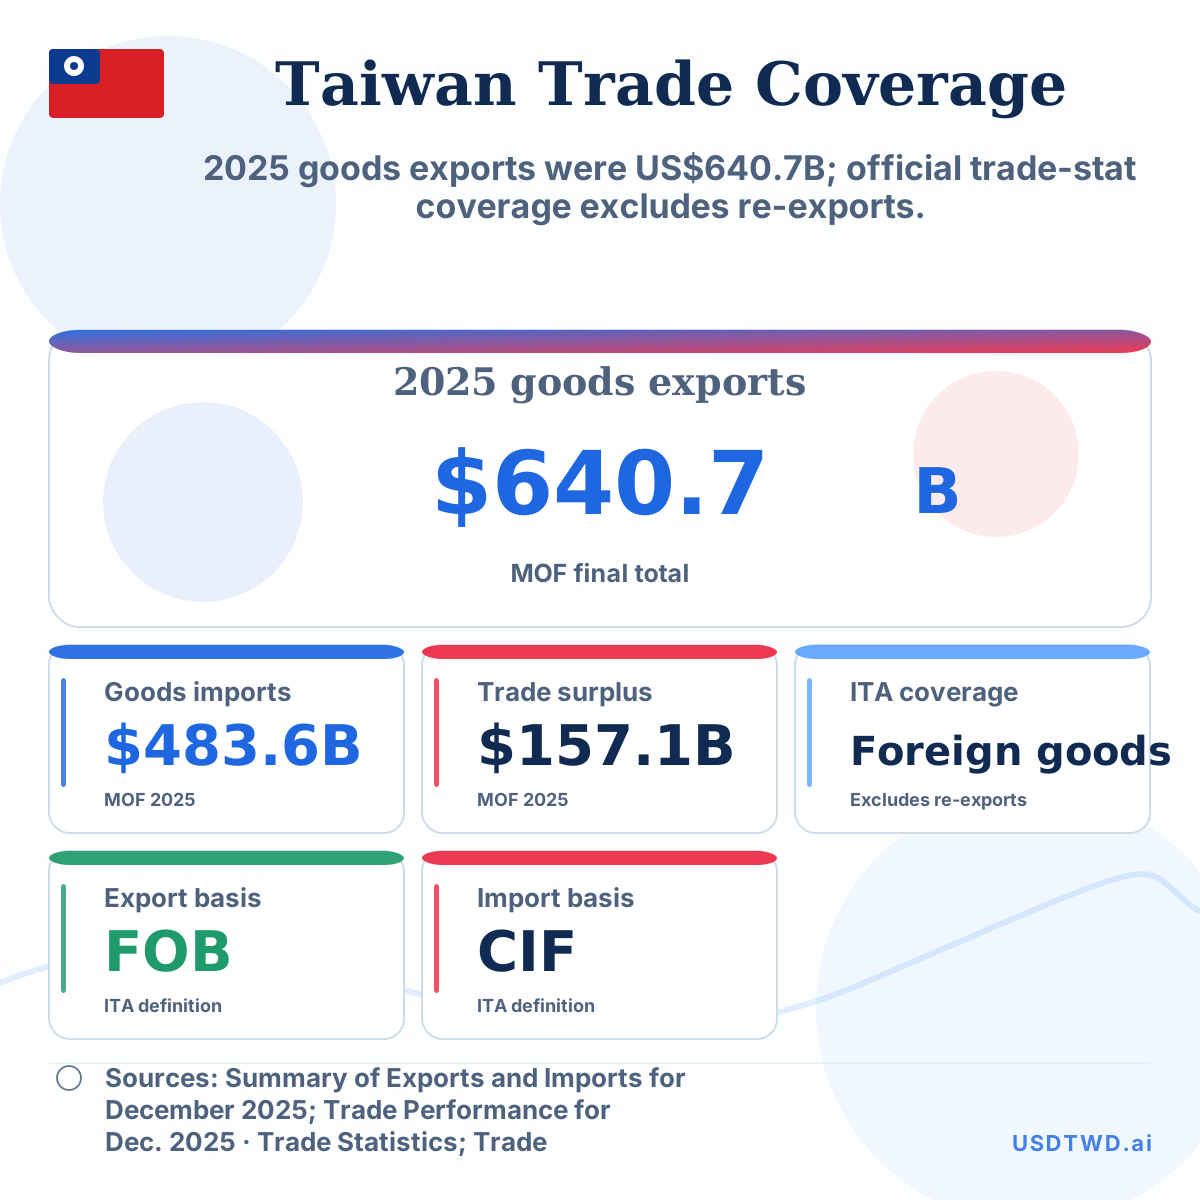
Taiwan re-export versus domestic-export value
2025 goods exports were US$640.7B; official trade-stat coverage excludes re-exports.
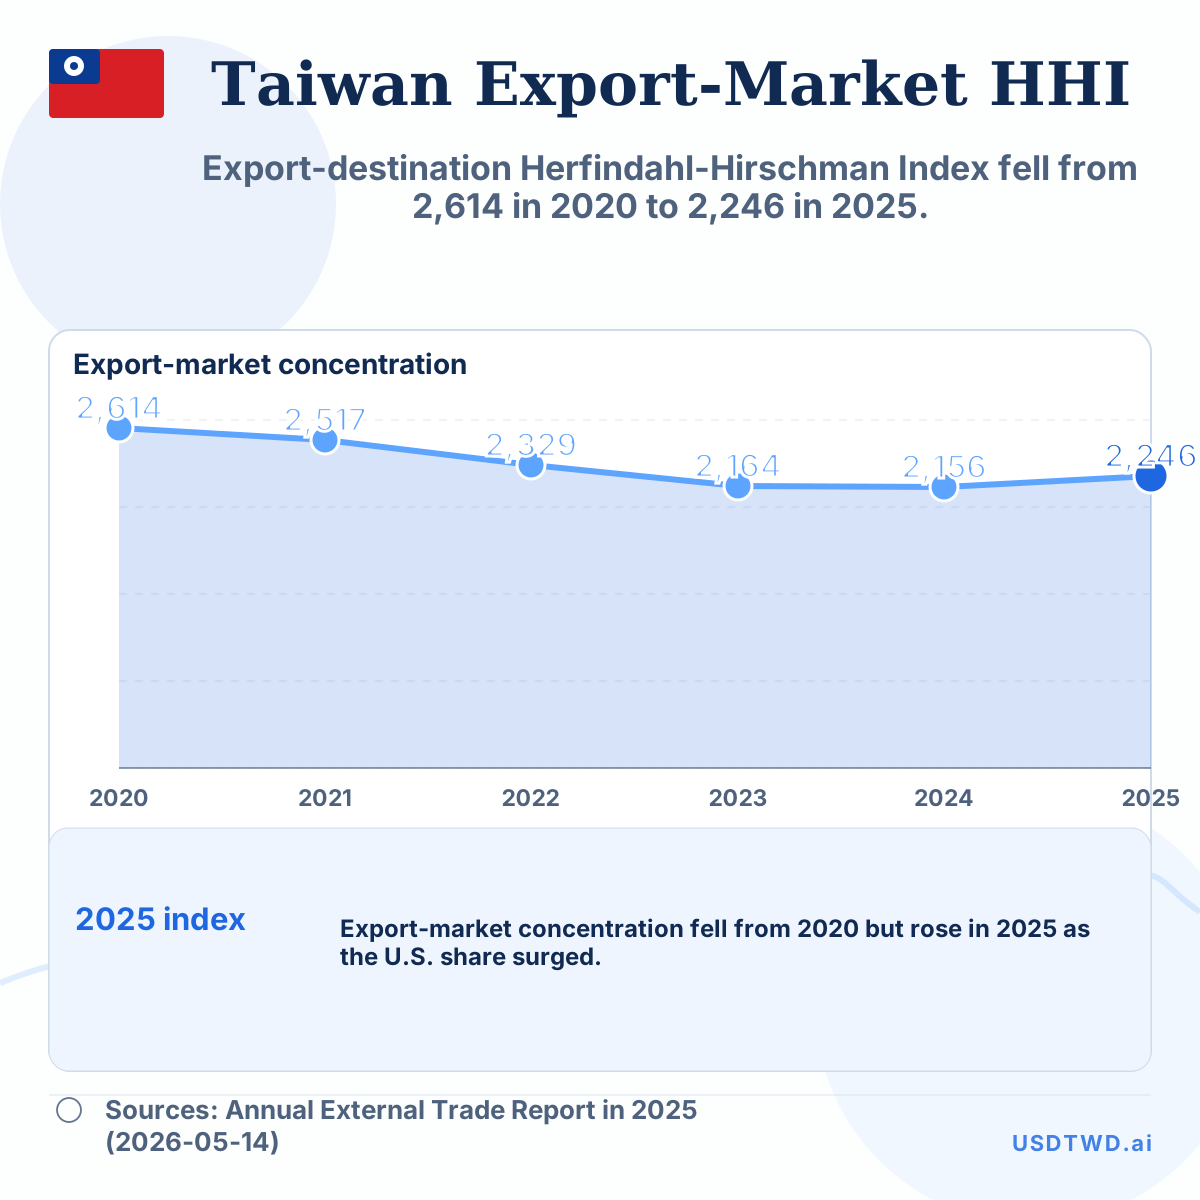
Taiwan export-market HHI over time
Export-destination Herfindahl-Hirschman Index fell from 2,614 in 2020 to 2,246 in 2025.
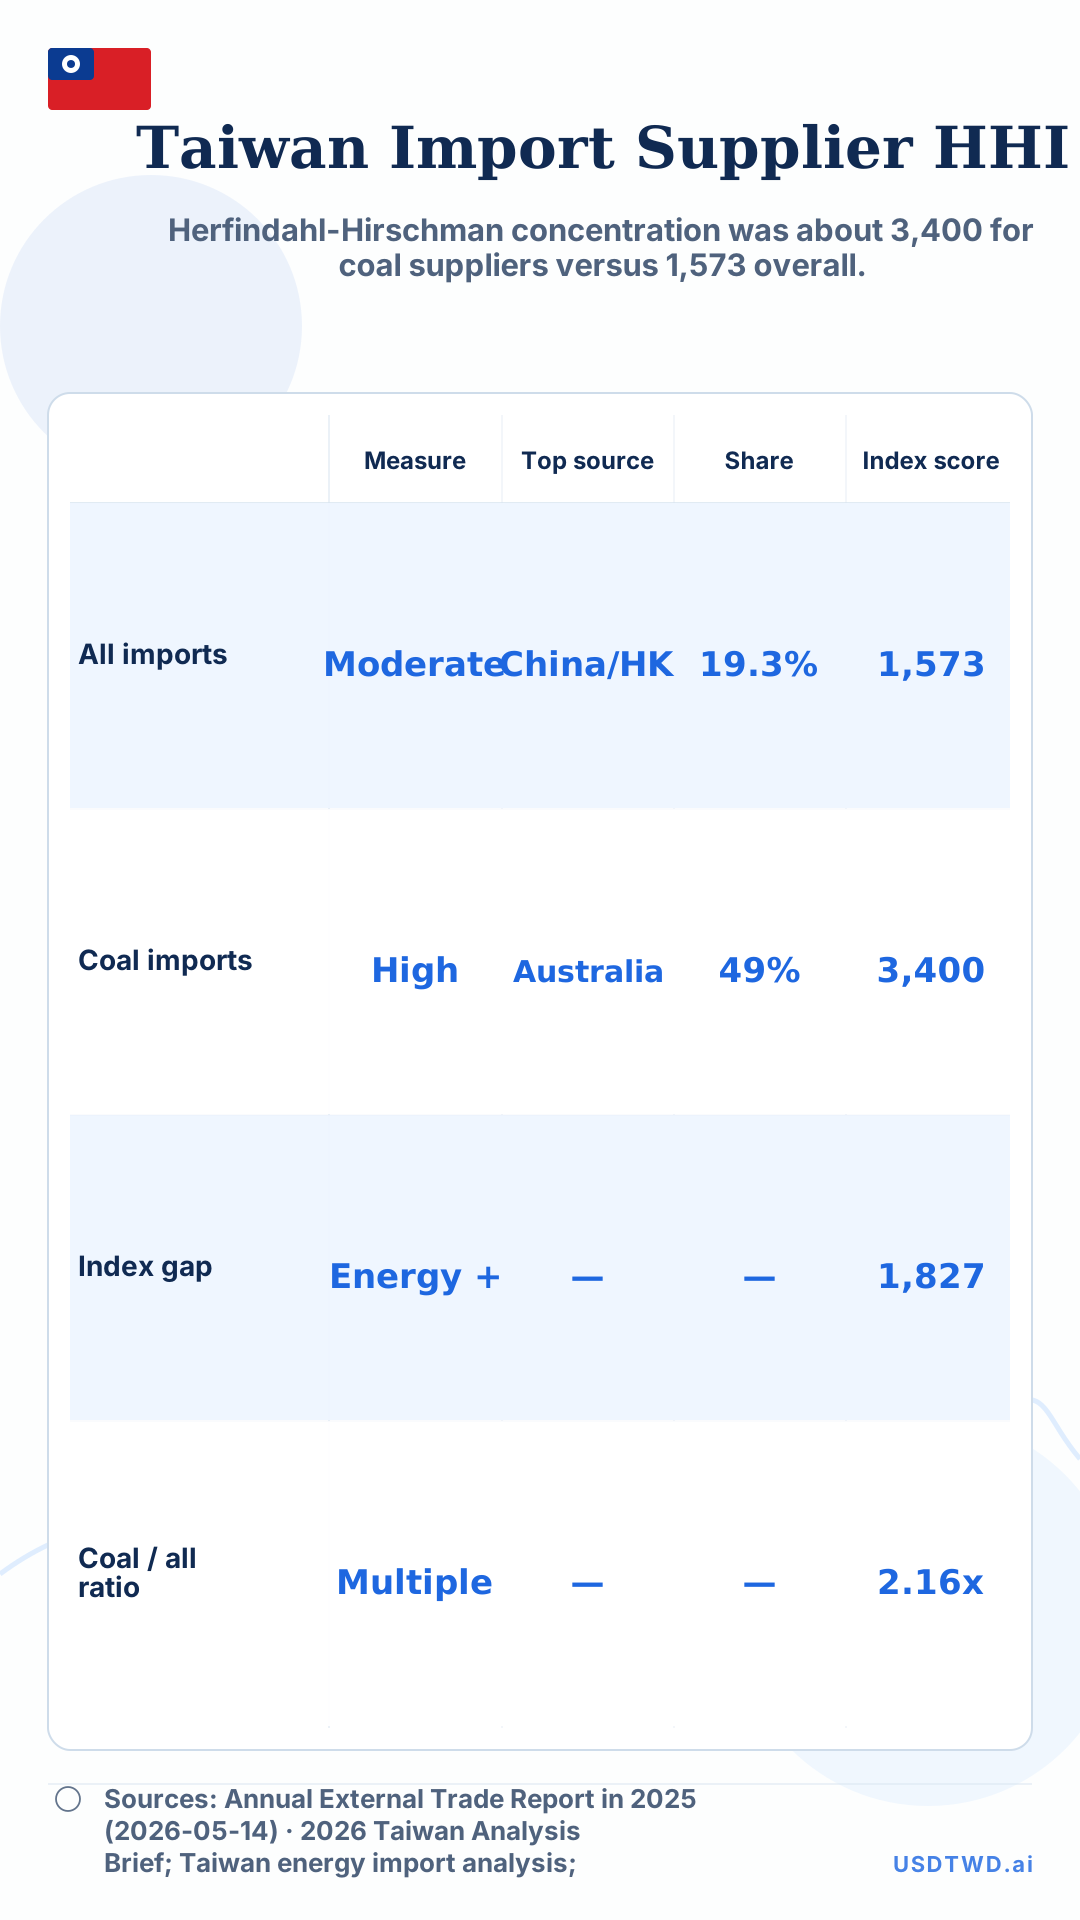
Taiwan import supplier HHI
Herfindahl-Hirschman concentration was about 3,400 for coal suppliers versus 1,573 overall.
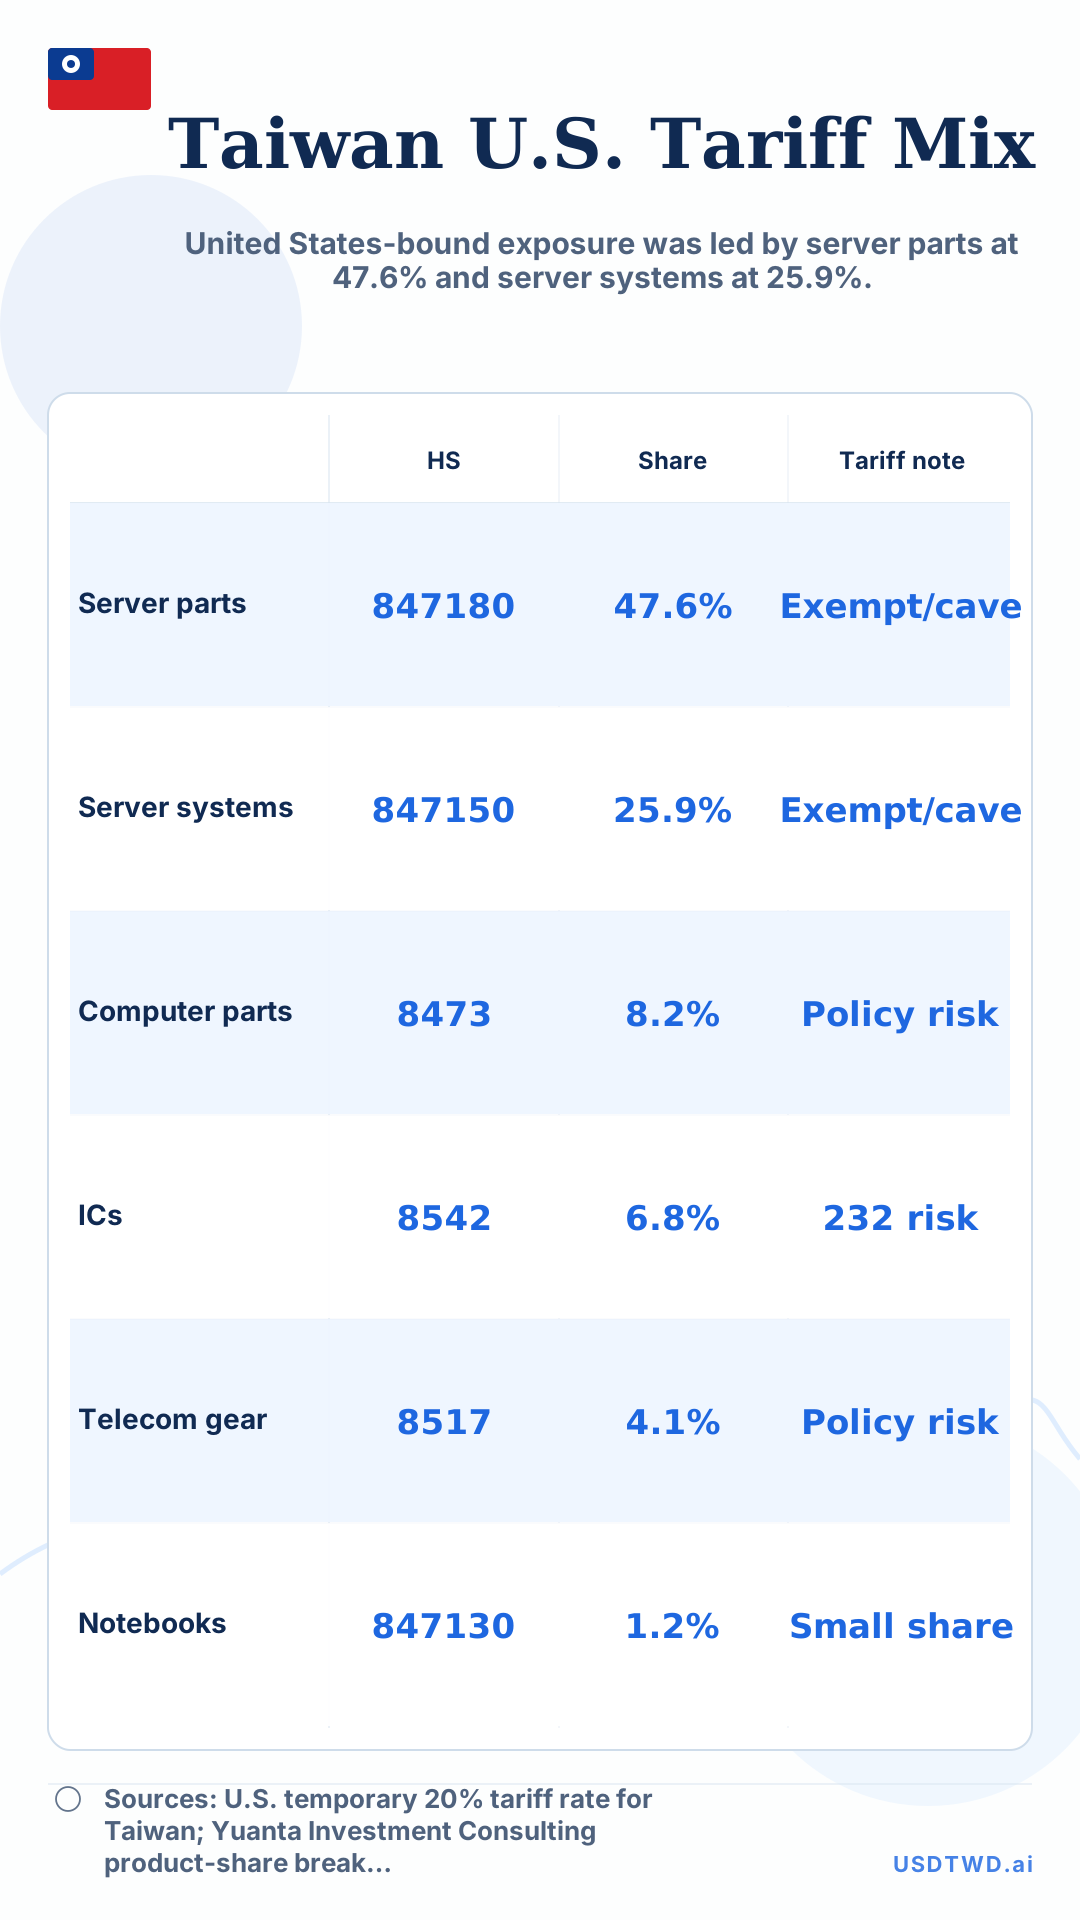
Taiwan tariff-sensitive exports to the U.S.
United States-bound exposure was led by server parts at 47.6% and server systems at 25.9%.
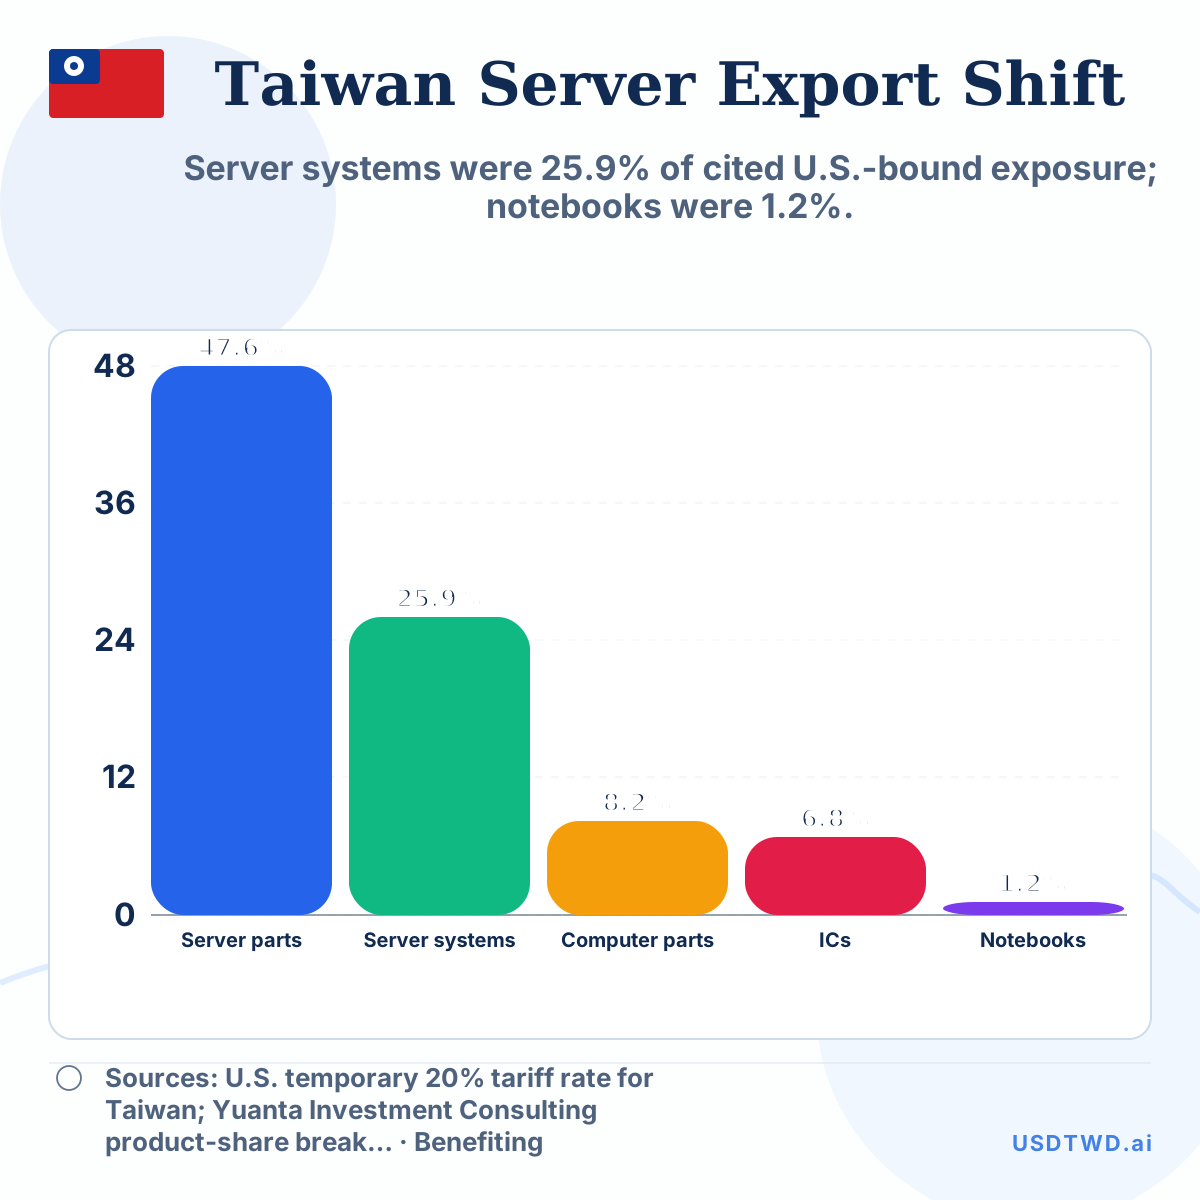
Taiwan server exports versus notebook exports
Server systems were 25.9% of cited U.S.-bound exposure; notebooks were 1.2%.