Sources
Source 1: 2024 Annual Report
Publisher: Taiwan Semiconductor Manufacturing Company
Dataset/table: 2024 revenue, margins, customers, products, technologies, employees
Units: NT$; US$; percent; people
Date checked: 2026-05-14
Evidence: TSMC reports 2024 revenue, margins, customer/product breadth and employee scale.
Note: TSMC reports 2024 revenue, margins, customer/product breadth and employee scale.
Source 2: Annual Report 2024 PDF
Publisher: Taiwan Semiconductor Manufacturing Company
Dataset/table: 2024 financial and operating data
Units: NT$; US$; percent
Date checked: 2026-05-14
Evidence: The PDF annual report gives detailed 2024 financial and business disclosures.
Note: The PDF annual report gives detailed 2024 financial and business disclosures.
Source 3: 2023 Annual Report Website
Publisher: Taiwan Semiconductor Manufacturing Company
Dataset/table: 2023 revenue, net income and margins
Units: US$; percent
Date checked: 2026-05-14
Evidence: TSMC reports 2023 revenue, net income and net margin, with 2022 comparison values.
Note: TSMC reports 2023 revenue, net income and net margin, with 2022 comparison values.
Source 4: 2022 Annual Report Website
Publisher: Taiwan Semiconductor Manufacturing Company
Dataset/table: 2022 financial and R&D context
Units: US$; percent
Date checked: 2026-05-14
Evidence: TSMC reports 2022 performance and R&D investment context.
Note: TSMC reports 2022 performance and R&D investment context.
Source 5: Form 20-F 2024
Publisher: Taiwan Semiconductor Manufacturing Company
Dataset/table: Recent years capital expenditures
Units: NT$ million; US$ million
Date checked: 2026-05-14
Evidence: TSMC reports capital expenditures for 2022, 2023 and 2024.
Note: TSMC reports capital expenditures for 2022, 2023 and 2024.

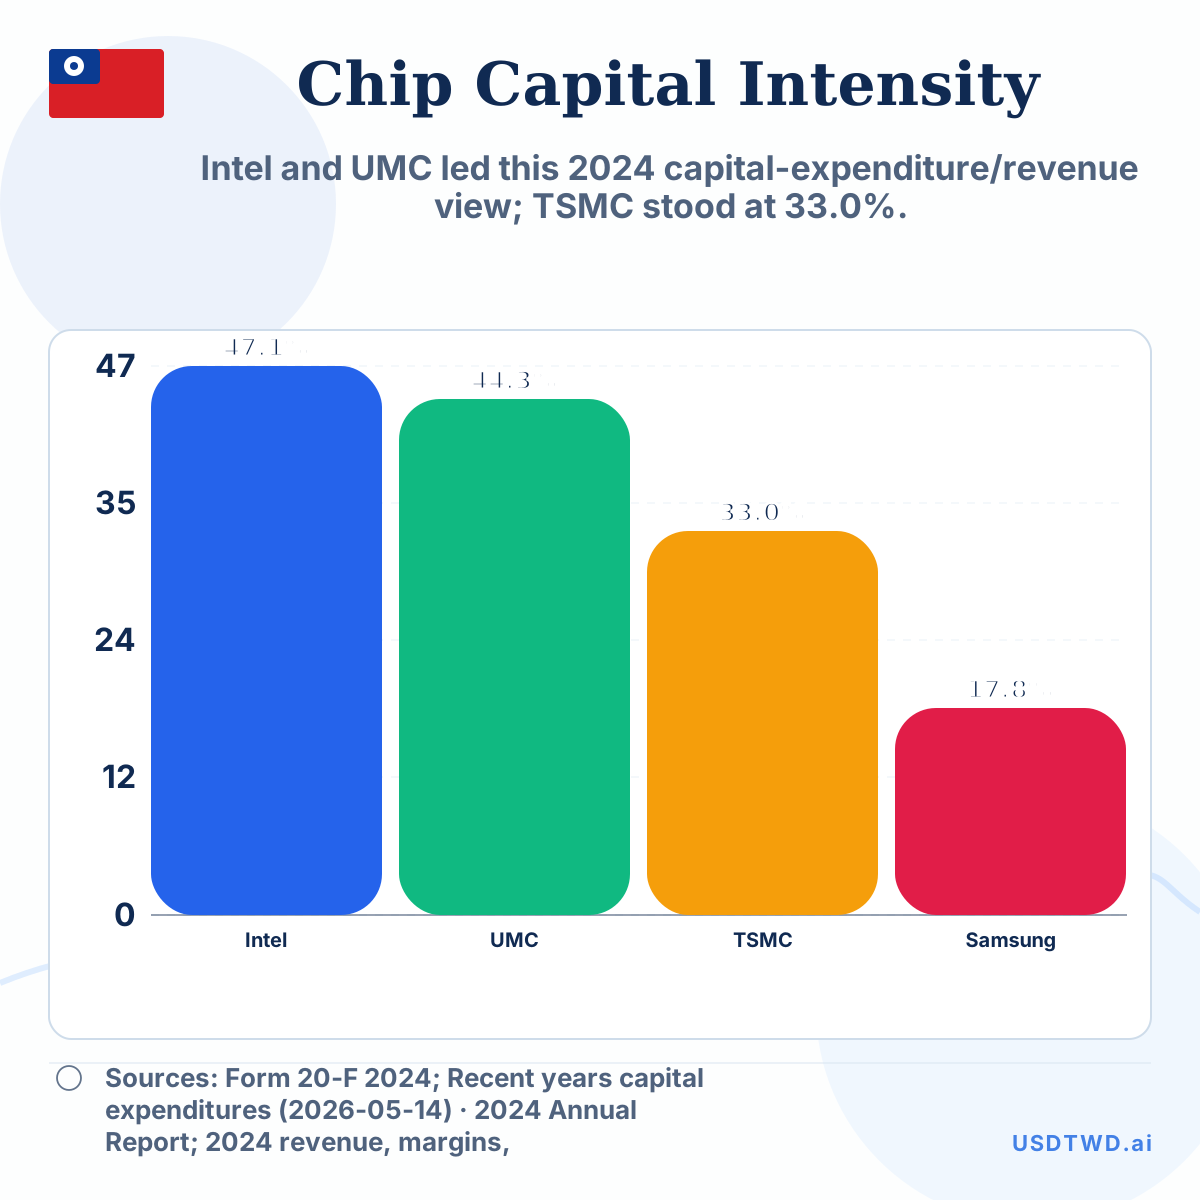 TSMC Capital-Expenditure Intensity vs Intel, Samsung and UMC
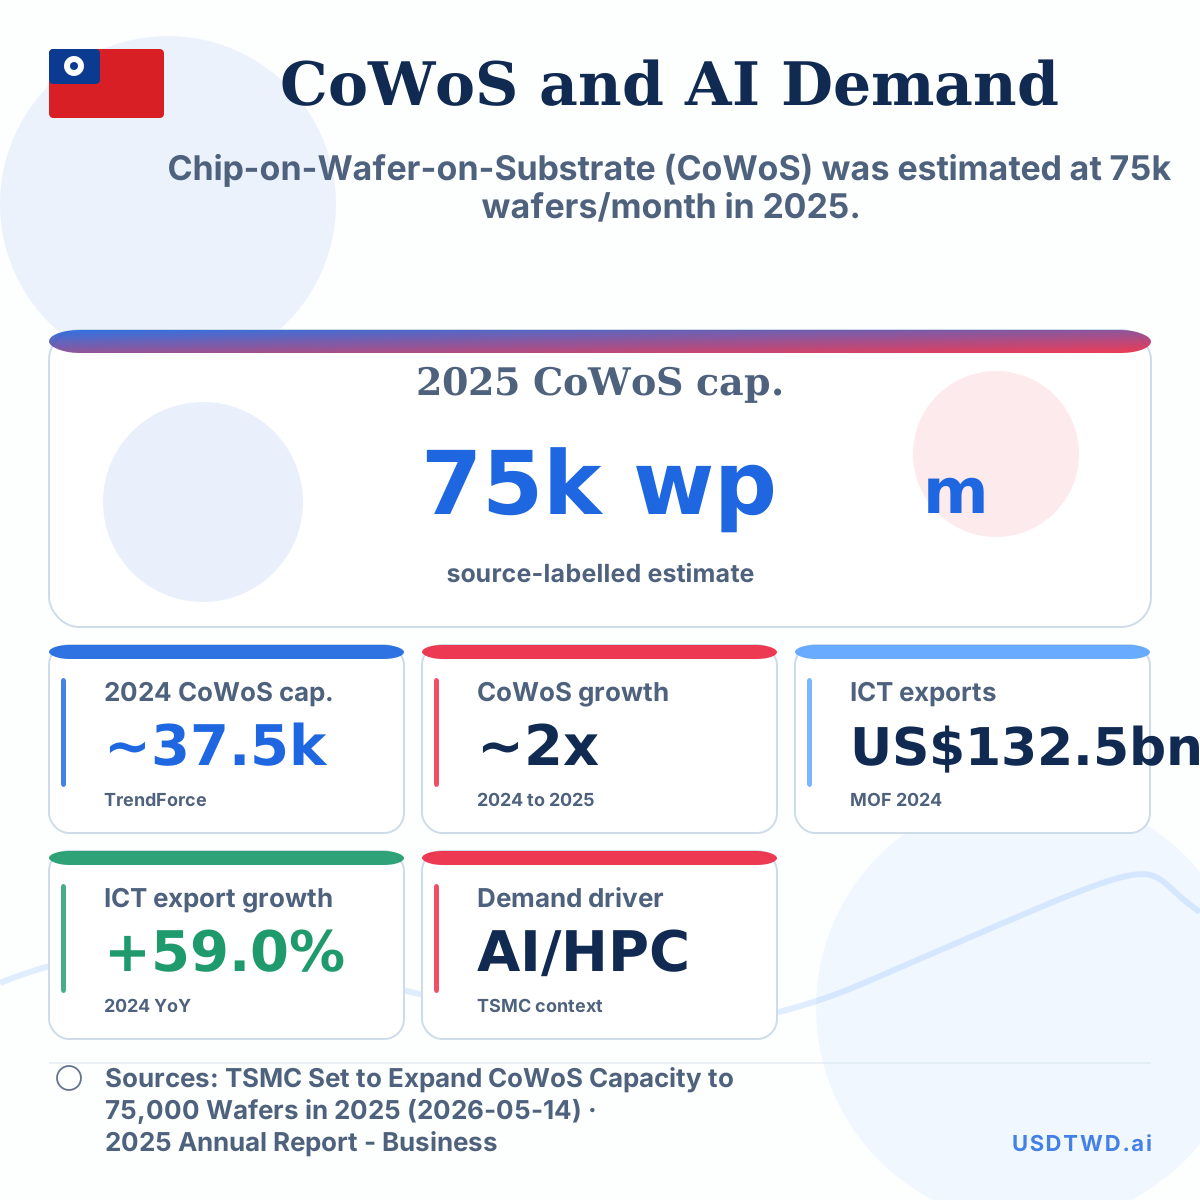 TSMC CoWoS Capacity Growth vs Taiwan AI Export Demand
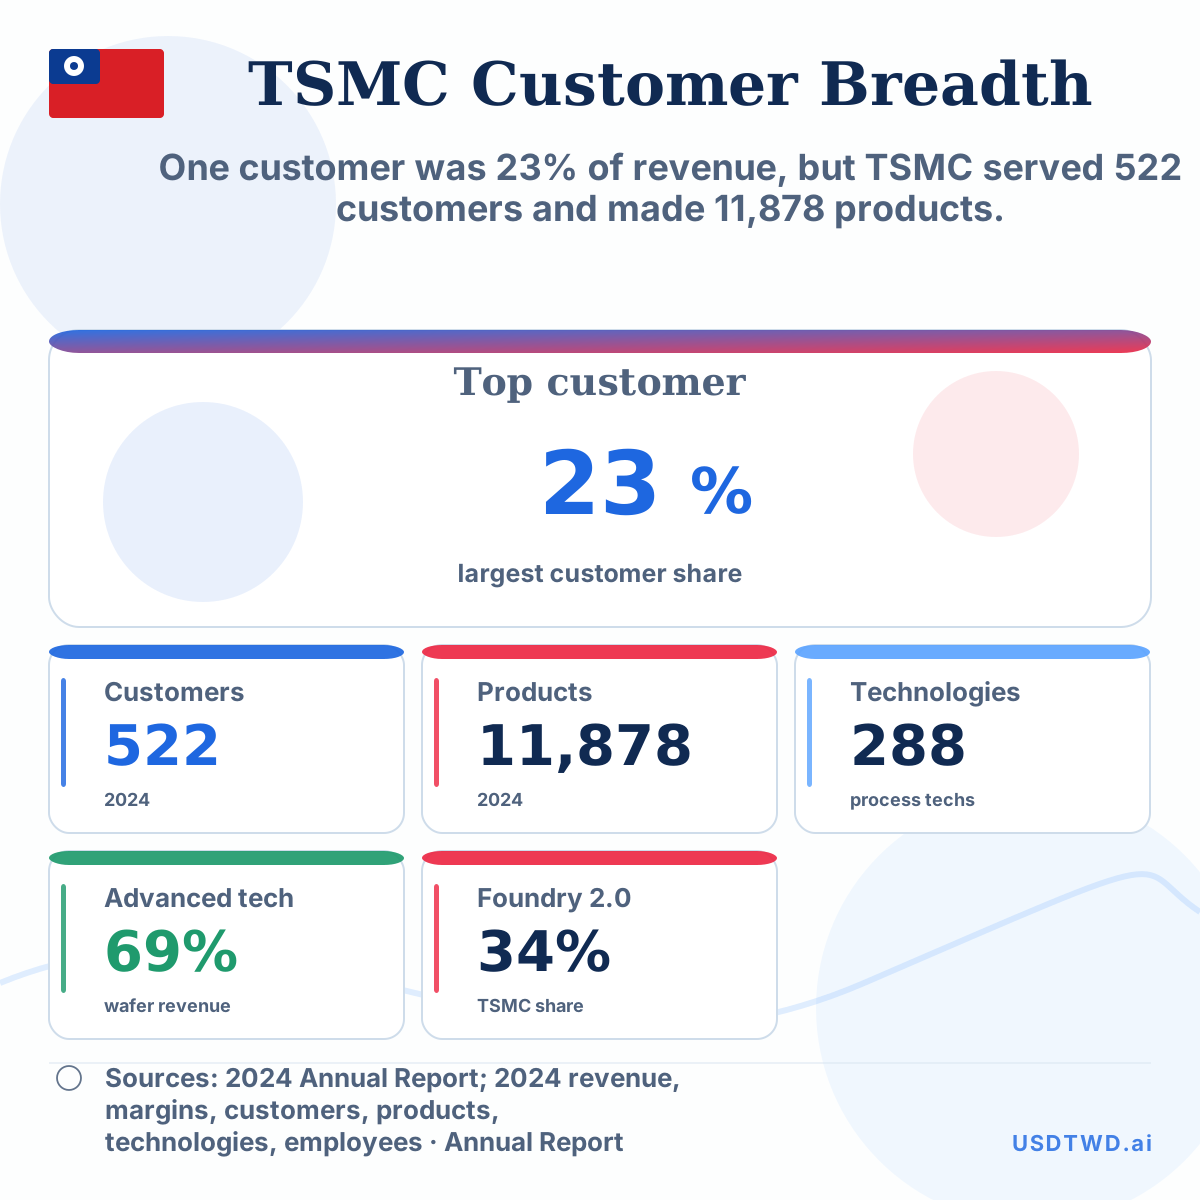 TSMC Top Customer Share vs Customer and Product Breadth