USDTWD.ai Taiwan Macro Atlas

Taiwan Household Disposable Income vs CPI and Rent Pressure, 2023

Per-capita disposable income rose 4.0%, ahead of CPI inflation and rent inflation in 2023.

What the Data Shows

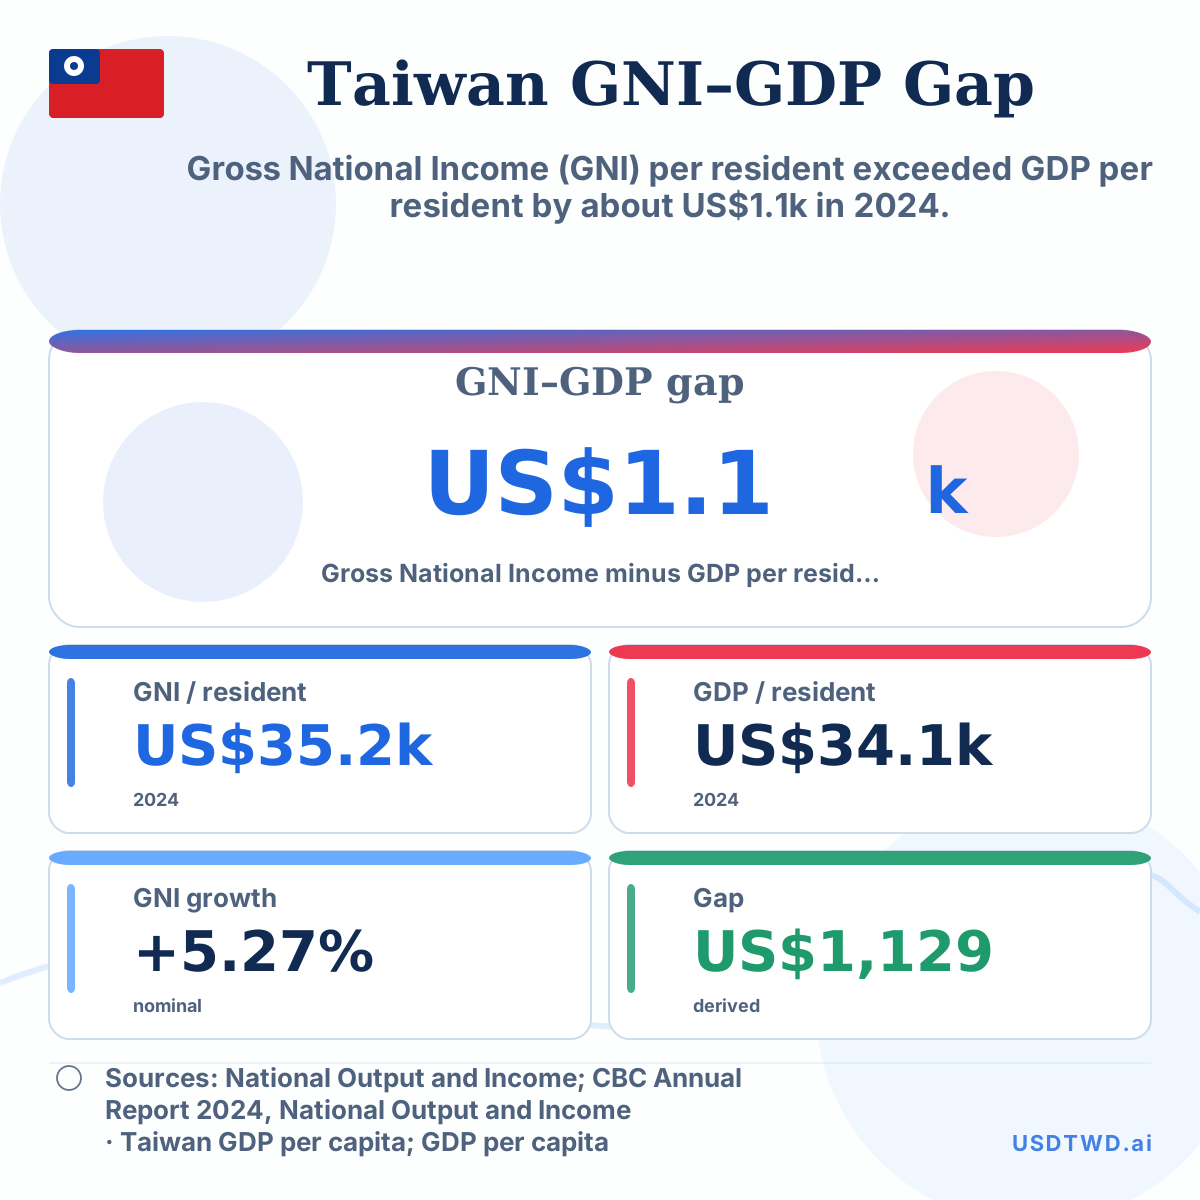
Household income data turns macro growth into living-standard movement. In 2023, per-capita disposable income rose faster than CPI and residential rent inflation, while median per-capita disposable income also grew. The comparison keeps income, broad inflation and housing-cost pressure visible in one compact graphic.
Data table

Per-cap DI 4.0% disposable inc.
Median DI 3.7% per capita
CPI 2.49% all items
Rent 2.16% residential

Data notes & caveats

Disposable-income values are survey-based and reported for 2023; CPI and rent are annual inflation measures. The income data is source-labelled because the exact percentage values were accessed through the official report path and official-reporting trail.

Methodology

Use DGBAS household-income survey values as reported from the official survey release path, and DGBAS CPI/rent inflation data. Values are annual percentage changes. The real-income gap is per-capita disposable-income growth minus CPI inflation.