
What the Data Shows
Taiwan’s household inequality ratio gives a compact reading of income distribution. In 2024, the highest household quintile held 40.46% of disposable income while the lowest held 6.59%, producing a 6.14× ratio and a 0.341 Gini coefficient. The same DGBAS table keeps the quintile shares and inequality indices on one survey basis.
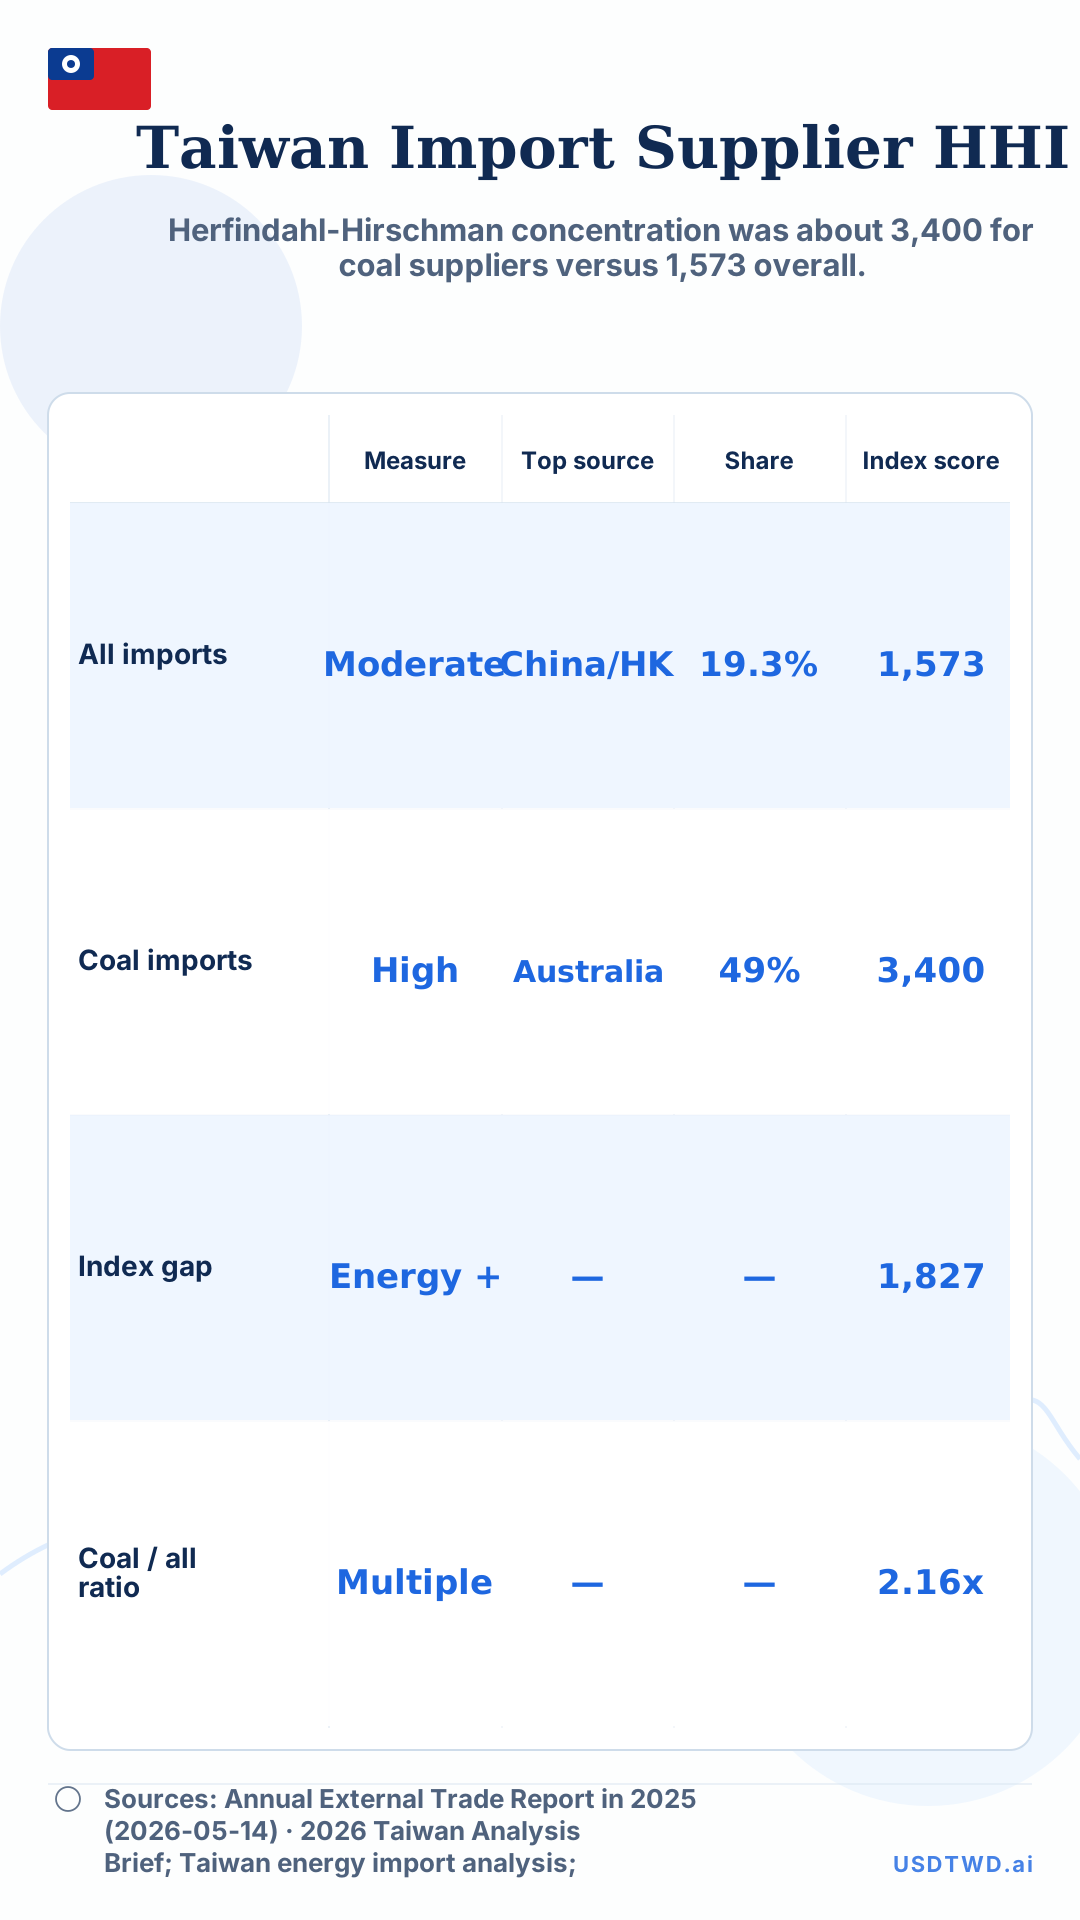 Taiwan import supplier HHI
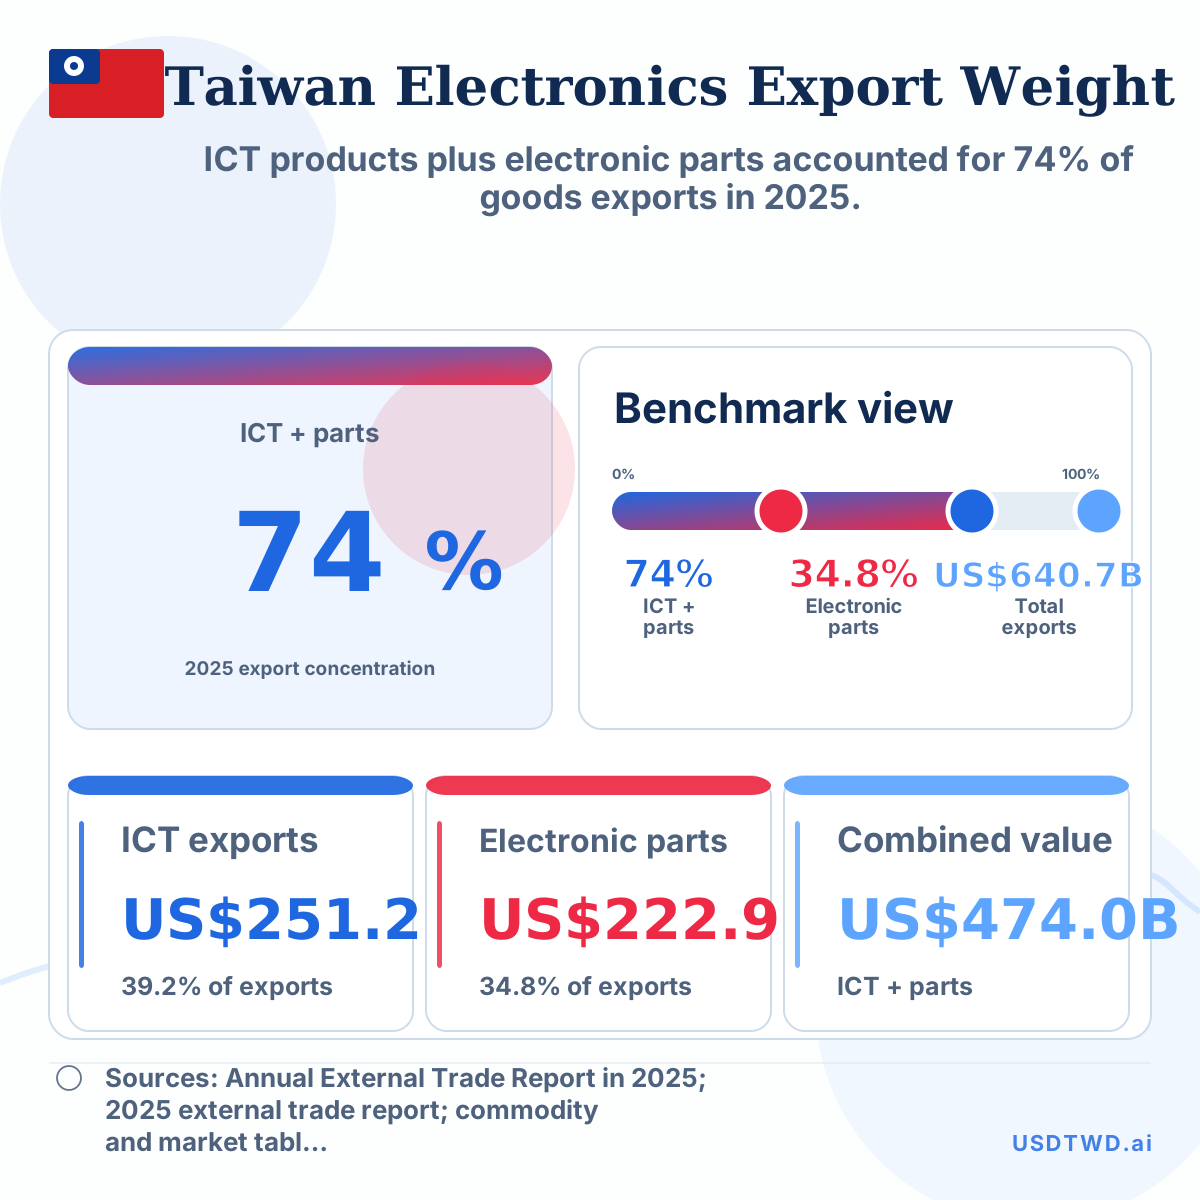 Taiwan electronics export concentration, 2025
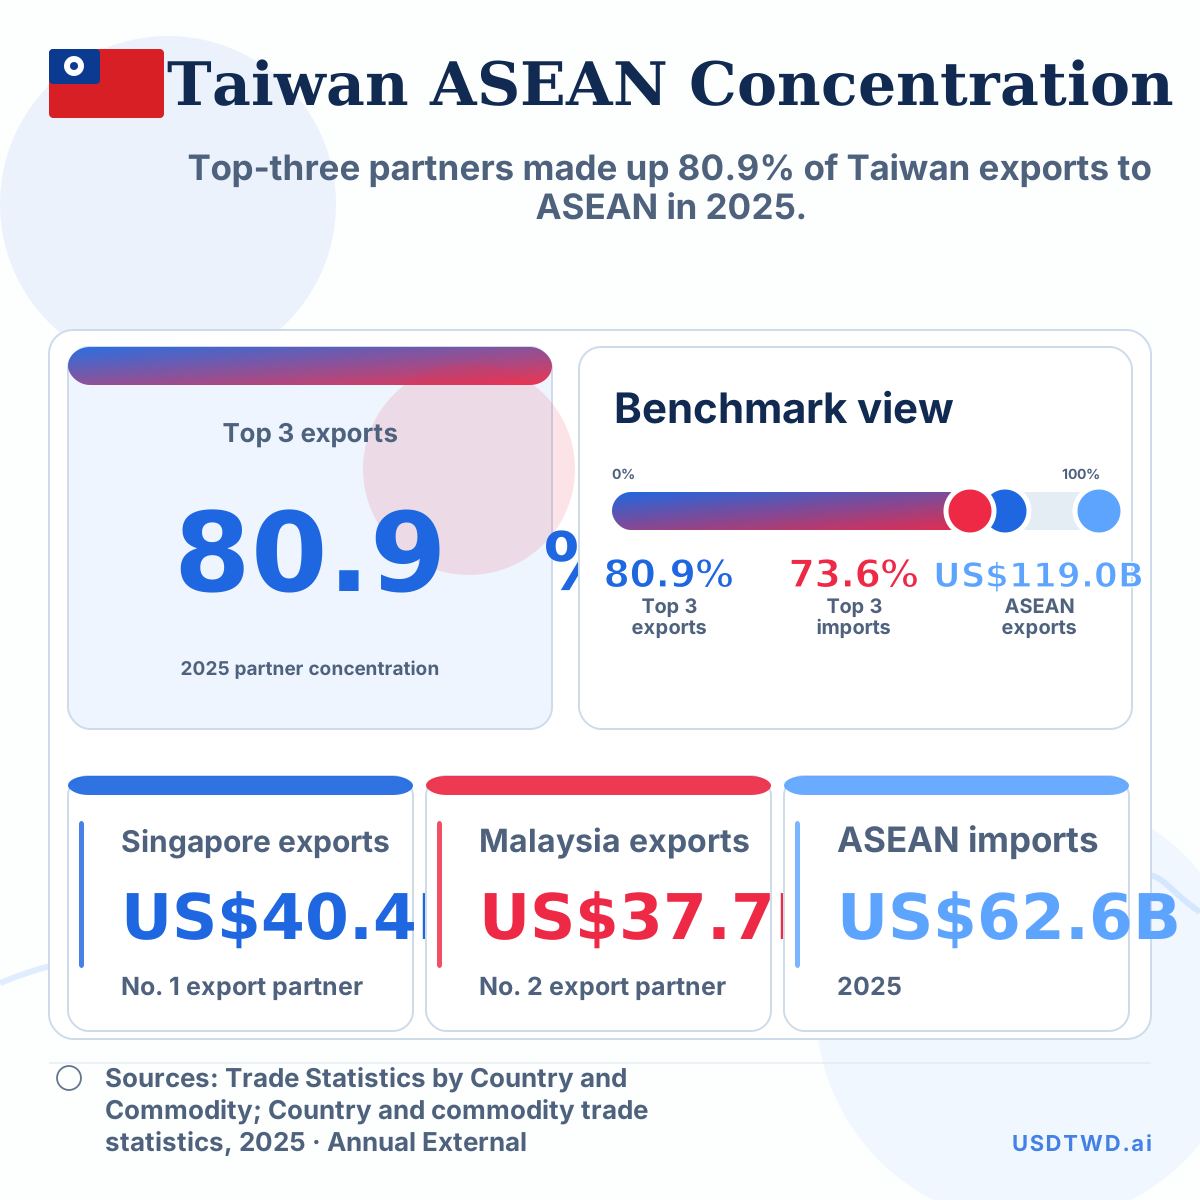 Taiwan ASEAN partner concentration, 2025