USDTWD.ai Taiwan Macro Atlas

Taiwan import input mix, 2025

Raw materials and capital goods dominated 2025 imports.

What the Data Shows

Raw materials accounted for about two-thirds of imports in 2025, while capital goods accounted for about 21.9%. Consumer goods were about 10.2%. The mix shows that Taiwan’s import boom was primarily production- and investment-linked rather than a simple consumer-demand surge.
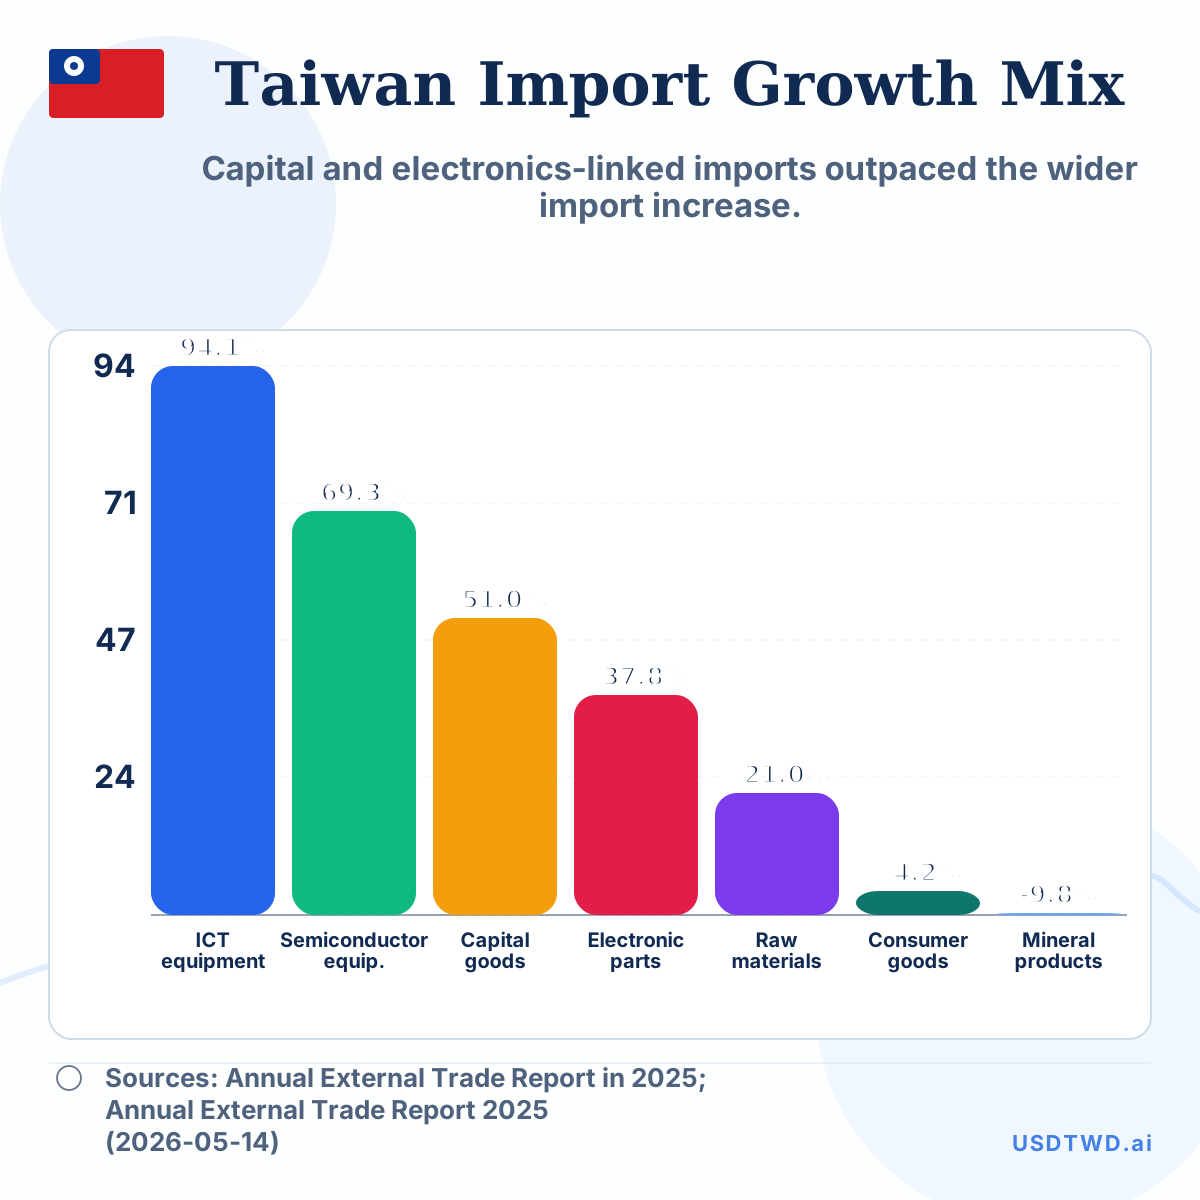
Data table

Raw materials US$321.5B 66.5% of imports
Capital goods US$105.7B 21.9% of imports
Consumer goods US$49.4B 10.2% of imports
Other US$7.0B 1.4% of imports

Sources

Source 1: Annual External Trade Report in 2025

Publisher: Ministry of Finance, R.O.C. (Taiwan)

Dataset/table: Annual External Trade Report 2025

Units: US$ billion; percent

Date checked: 2026-05-14

Evidence: Reports 2025 exports, imports, export commodity values, major export markets and import commodity values/growth rates.

Note: Reports 2025 exports, imports, export commodity values, major export markets and import commodity values/growth rates.

Data notes & caveats

Other is derived residually from total imports minus raw materials, capital goods and consumer goods.

Methodology

Compute category shares using MOF annual import category values and total imports.

Source consistency notes

All core values from MOF annual external trade report; other derived as residual.