Data table
Germany exports
US$7.37B
2025
Germany imports
US$14.28B
2025
Germany balance
-US$6.91B
exports-imports
Netherlands exports
US$8.33B
2025
Netherlands imports
US$8.47B
2025
Netherlands balance
-US$0.13B
exports-imports
Sources
Source 1: Trade Statistics by Country and Commodity
Publisher: International Trade Administration / Customs Administration, Ministry of Finance, R.O.C. (Taiwan)
Dataset/table: Country and commodity trade statistics, 2025
Units: US dollars; exports/imports
Date checked: 2026-05-14
Evidence: Official route for country-level exports/imports and commodity-by-country values; some country values use the supplied deep-research extraction from the MOF workbook.
Note: Official route for country-level exports/imports and commodity-by-country values; some country values use the supplied deep-research extraction from the MOF workbook.
Source 2: EU trade relations with Taiwan
Publisher: European Commission DG Trade
Dataset/table: EU-Taiwan goods trade 2025
Units: euro; goods trade; exports/imports/balance
Date checked: 2026-05-14
Evidence: Reports EU-Taiwan 2025 goods trade total, EU exports, EU imports and EU deficit.
Note: Reports EU-Taiwan 2025 goods trade total, EU exports, EU imports and EU deficit.
Source 3: International trade in goods - Statistics Explained
Publisher: Eurostat
Dataset/table: EU trade statistics methodology context
Units: methodology note
Date checked: 2026-05-14
Evidence: Explains the Rotterdam effect caveat relevant to Netherlands trade interpretation.
Note: Explains the Rotterdam effect caveat relevant to Netherlands trade interpretation.

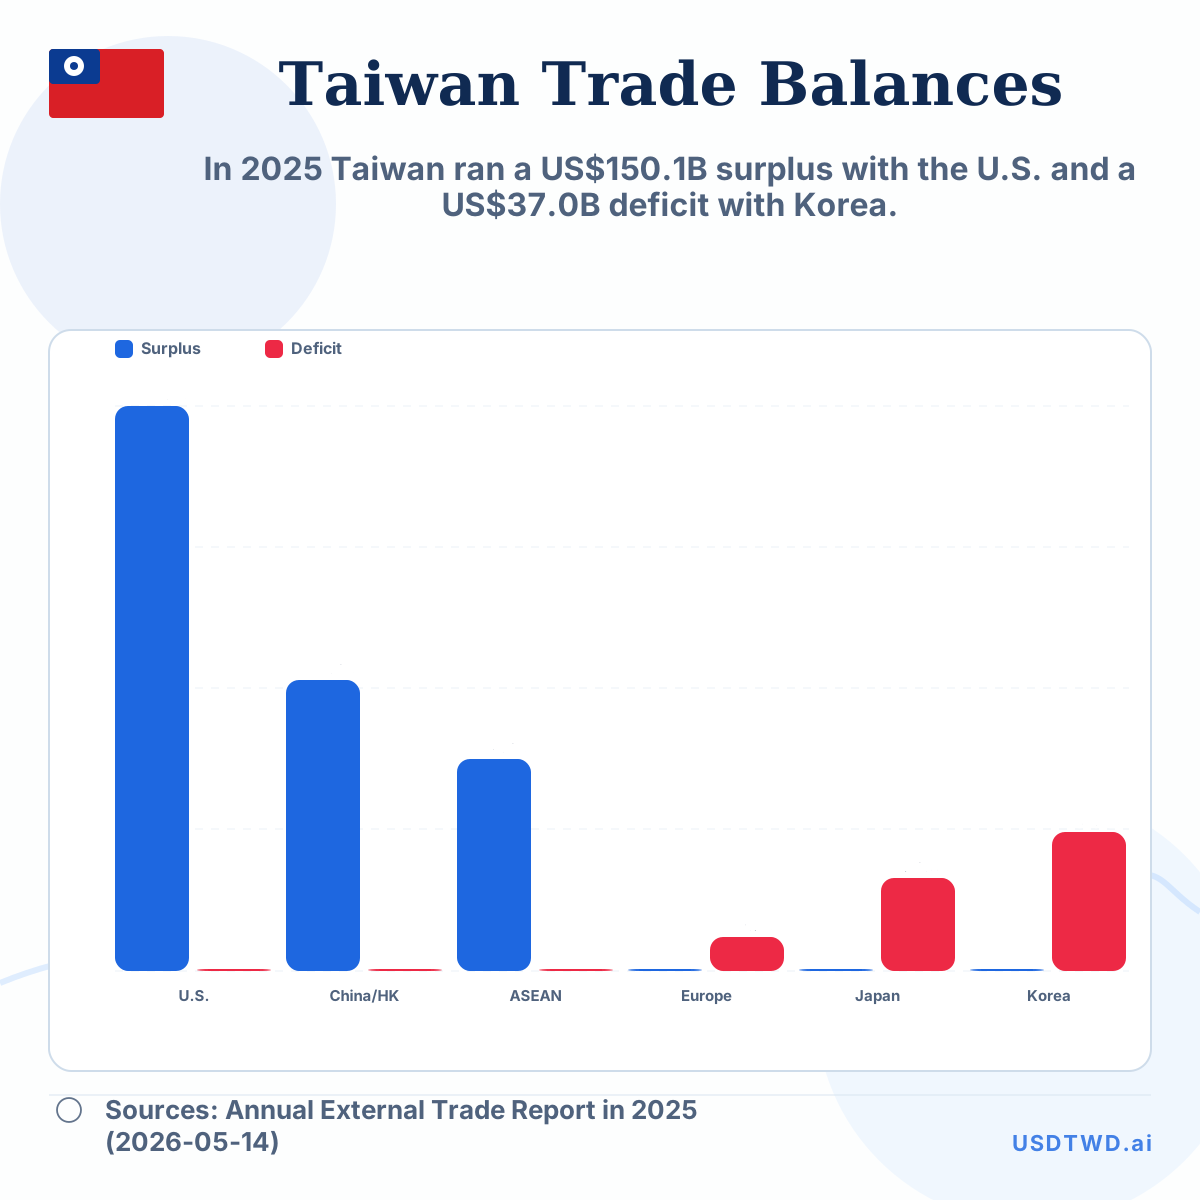 Taiwan top-country trade-balance map without map
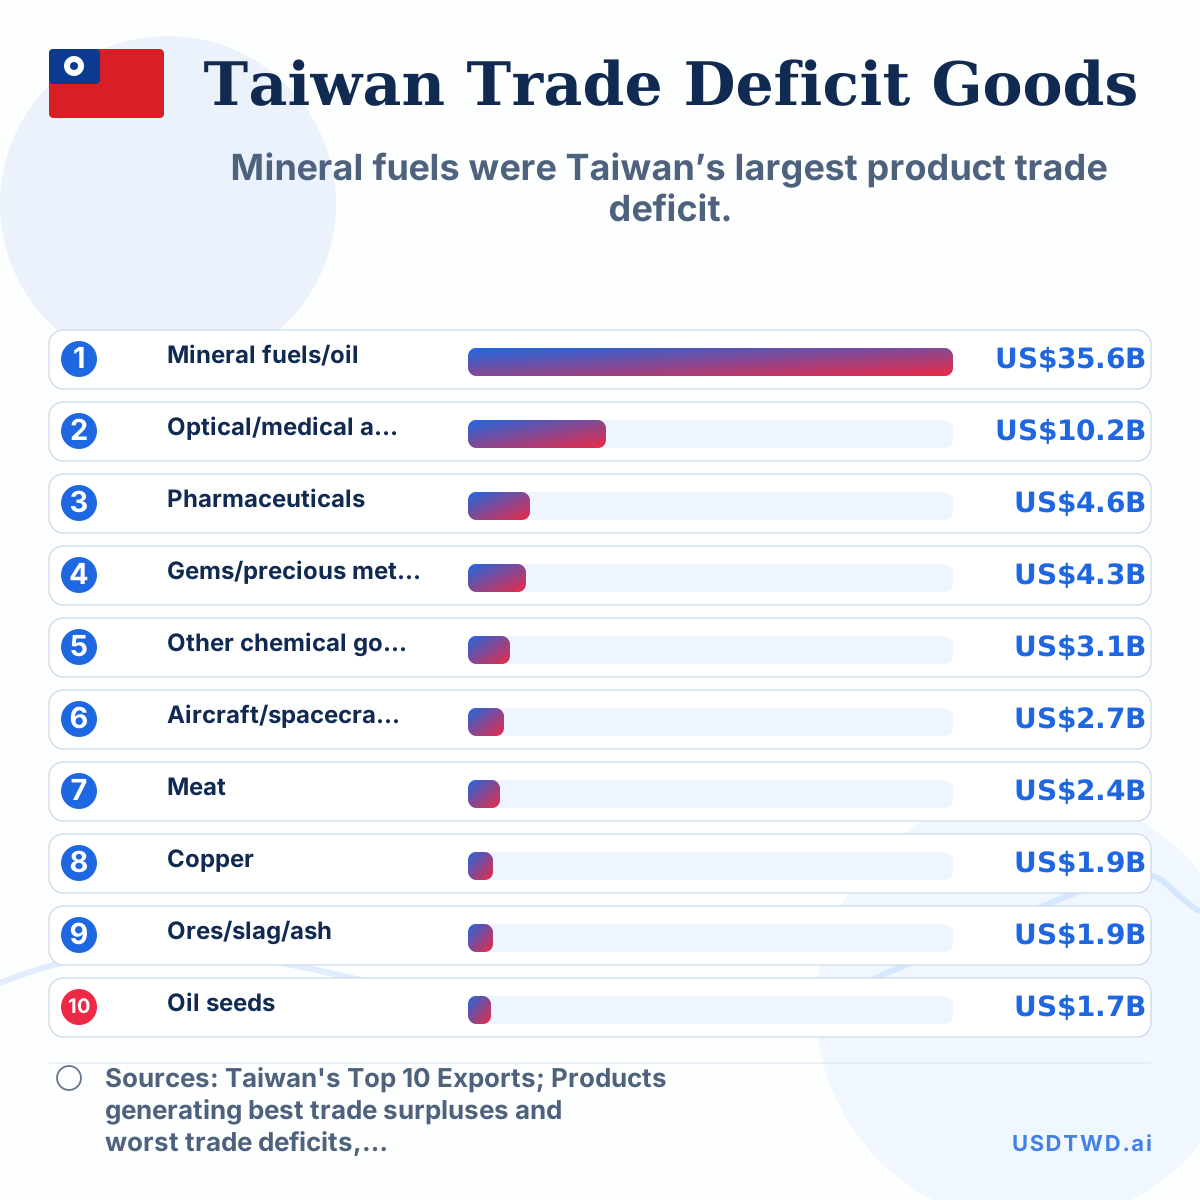 Taiwan goods trade-deficit categories, 2025
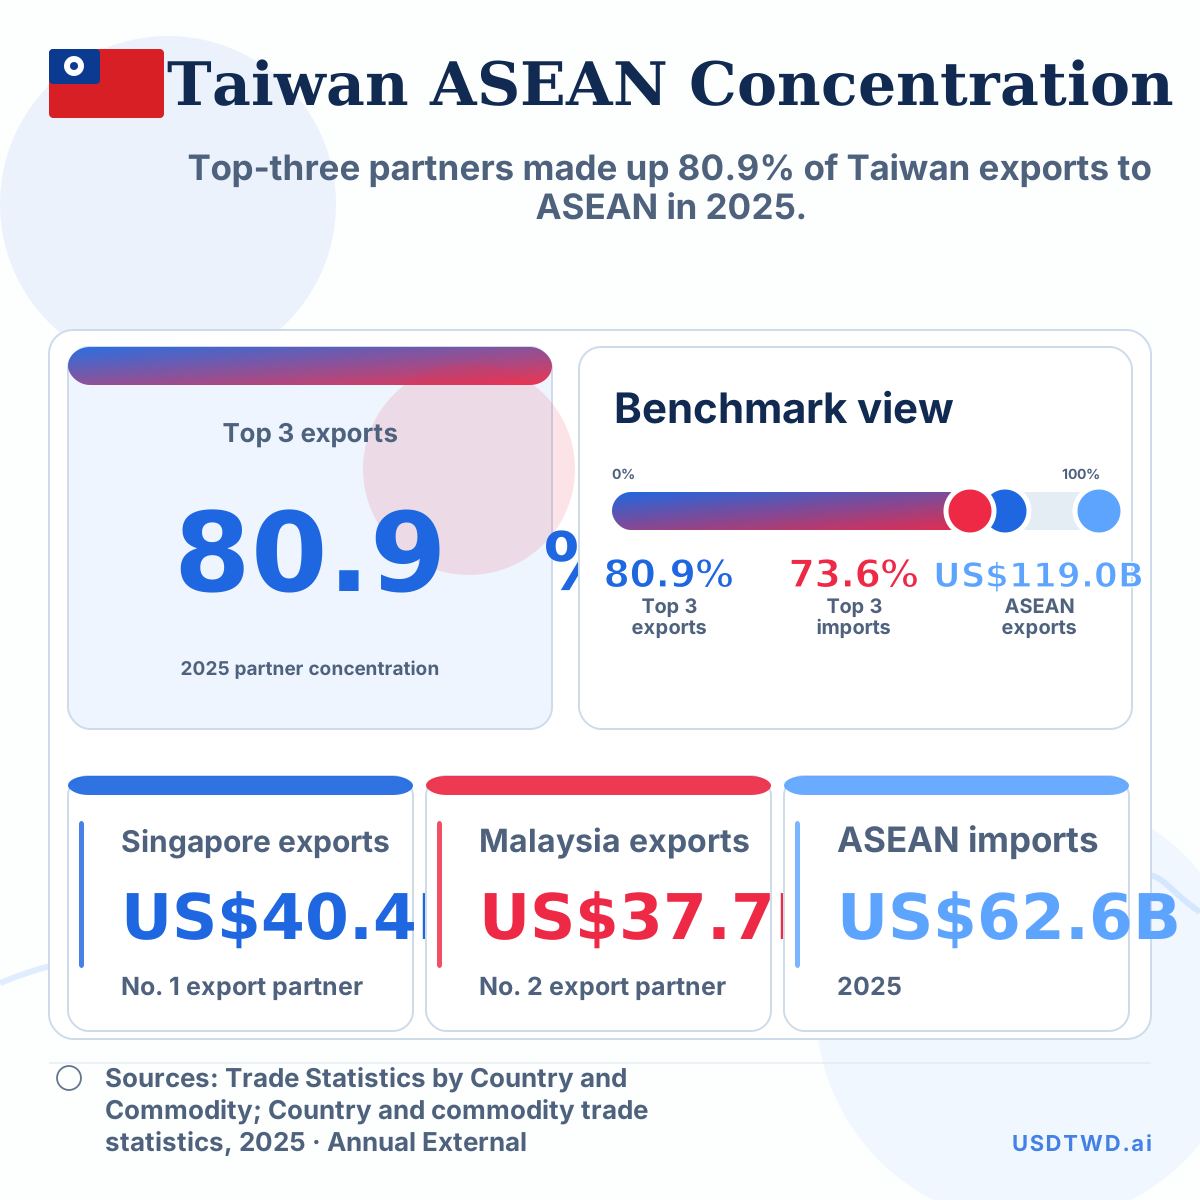 Taiwan ASEAN partner concentration, 2025