Sources
Source 1: Greenhouse Gas Emissions Comparison
Publisher: Climate Change Administration, Taiwan
Dataset/table: Carbon Intensity by Country: 2023 vs 2024
Units: tCO₂eq/kUSD GDP
Date checked: 2026-05-14
Evidence: Reports Taiwan 2024 carbon intensity of about 0.1856 tCO₂eq/kUSD and Japan at about 0.1861.
Note: Reports Taiwan 2024 carbon intensity of about 0.1856 tCO₂eq/kUSD and Japan at about 0.1861.
Source 2: South Korea Carbon intensity
Publisher: TheGlobalEconomy.com / World Bank
Dataset/table: Carbon intensity latest value 2024
Units: kg CO2 per dollar of GDP
Date checked: 2026-05-14
Evidence: Reports South Korea 2024 carbon intensity at 0.21 kg CO2 per dollar of GDP.
Note: Reports South Korea 2024 carbon intensity at 0.21 kg CO2 per dollar of GDP.
Source 3: Germany Carbon intensity
Publisher: TheGlobalEconomy.com / World Bank
Dataset/table: Carbon intensity latest value 2024
Units: kg CO2 per dollar of GDP
Date checked: 2026-05-14
Evidence: Reports Germany 2024 carbon intensity at 0.11 kg CO2 per dollar of GDP.
Note: Reports Germany 2024 carbon intensity at 0.11 kg CO2 per dollar of GDP.
Source 4: Carbon intensity: CO₂ emissions per dollar of GDP
Publisher: Our World in Data
Dataset/table: CO₂ emissions per dollar of GDP
Units: kg CO₂ per international-$
Date checked: 2026-05-14
Evidence: Defines territorial carbon intensity and documents the Global Carbon Budget/Maddison source basis.
Note: Defines territorial carbon intensity and documents the Global Carbon Budget/Maddison source basis.

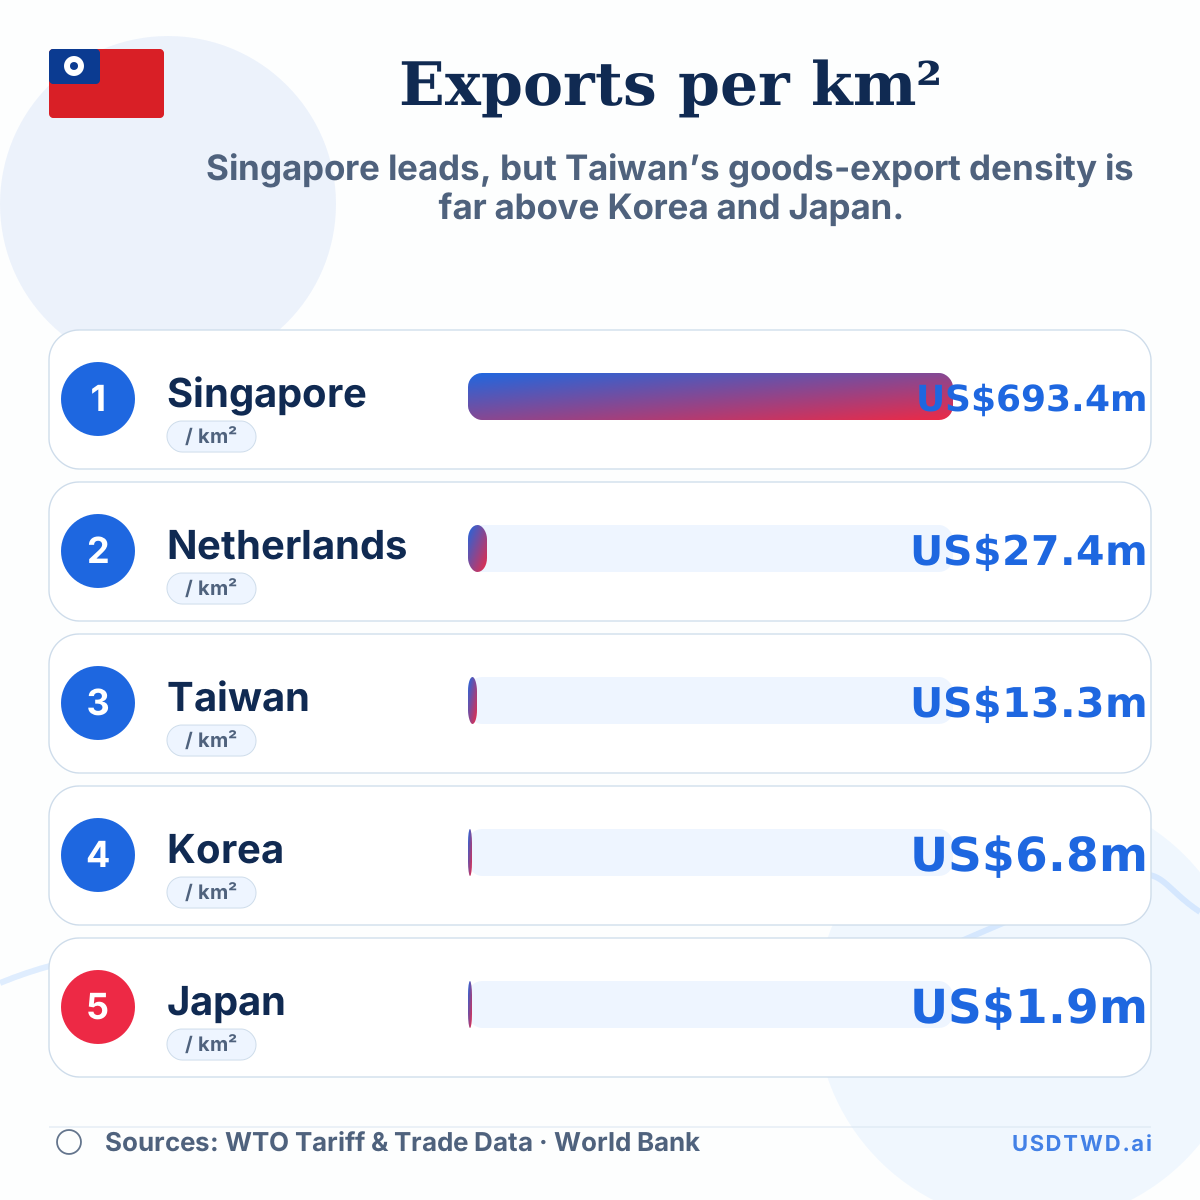 Exports per Square Kilometre: Taiwan vs Dense Export Economies
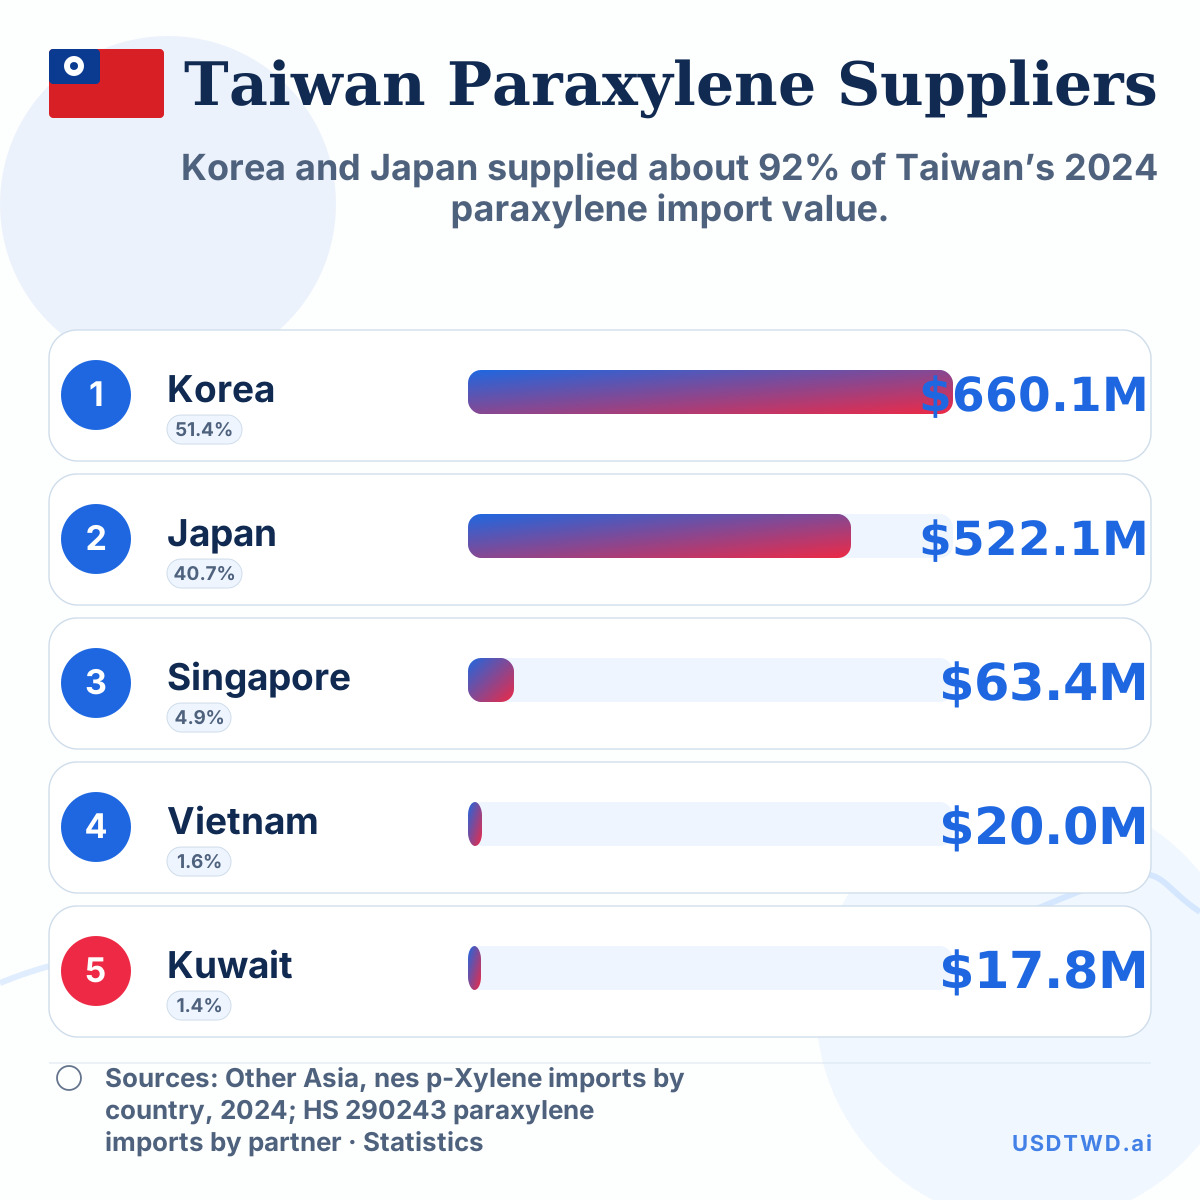 Taiwan’s 5 largest paraxylene suppliers
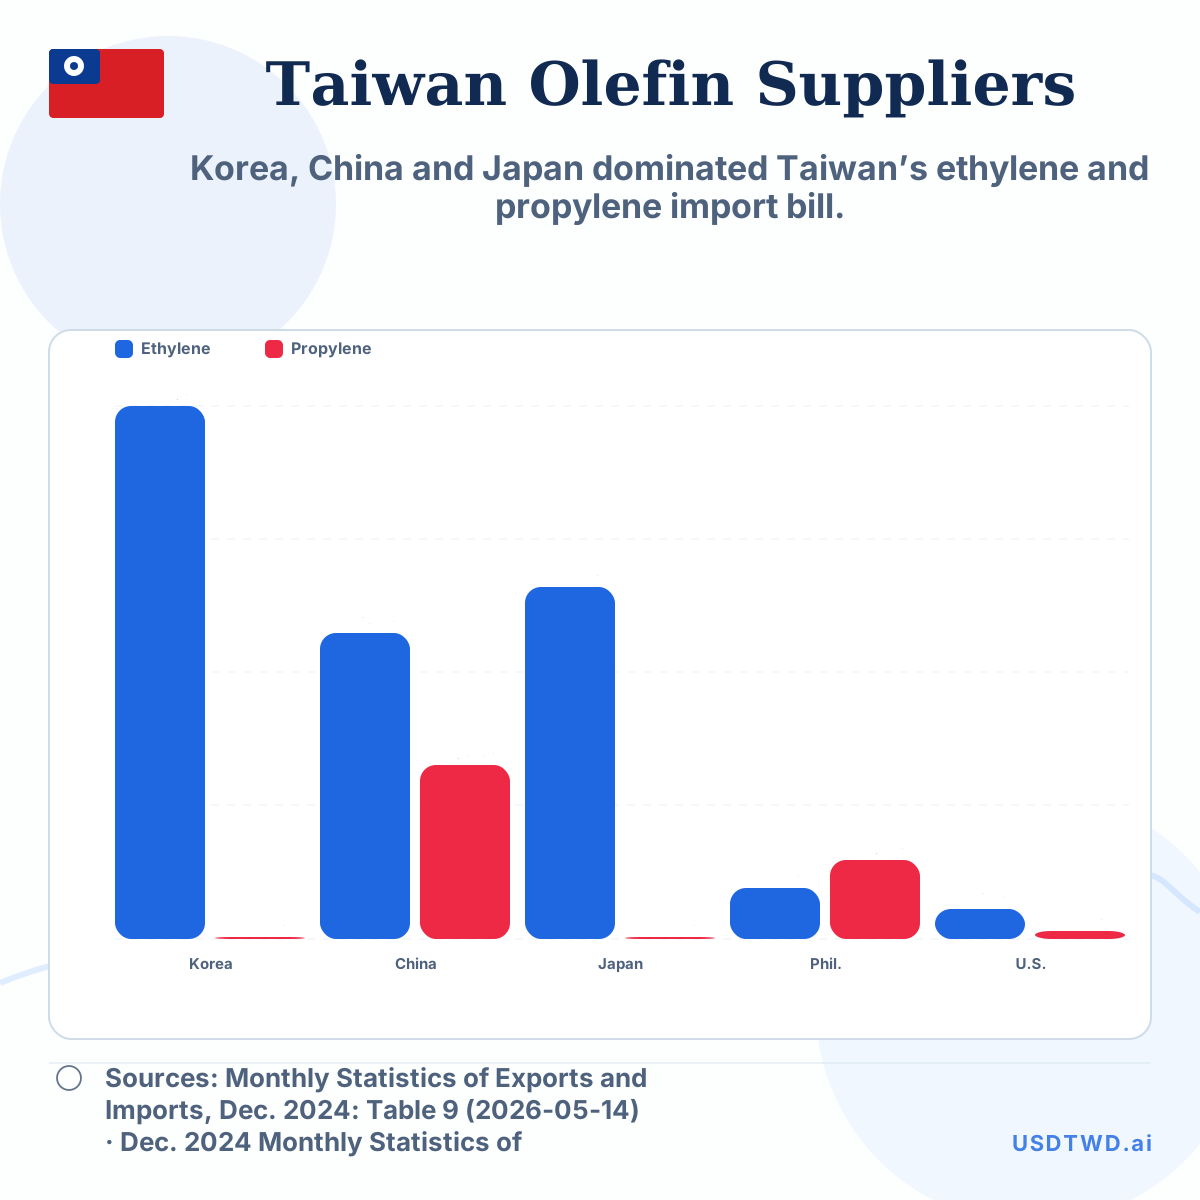 Taiwan’s Largest Ethylene and Propylene Suppliers, 2024