Sources
Source 1: Taiwan Dollars to U.S. Dollar Spot Exchange Rate
Publisher: FRED / Board of Governors of the Federal Reserve System
Dataset/table: AEXTAUS annual average
Units: Taiwan dollars per U.S. dollar
Date checked: 2026-05-07
Status: verified
Note: FRED reports TWD per USD annual averages of 27.9366 in 2021 and 32.1064 in 2024.
Source 2: Japanese Yen to U.S. Dollar Spot Exchange Rate
Publisher: FRED / Board of Governors of the Federal Reserve System
Dataset/table: AEXJPUS annual average
Units: Japanese yen per U.S. dollar
Date checked: 2026-05-07
Status: verified
Note: FRED reports JPY per USD annual averages of 109.8429 in 2021 and 151.4551 in 2024.
Source 3: South Korean Won to U.S. Dollar Spot Exchange Rate
Publisher: FRED / Board of Governors of the Federal Reserve System
Dataset/table: AEXKOUS annual average
Units: Korean won per U.S. dollar
Date checked: 2026-05-07
Status: verified
Note: FRED reports KRW per USD annual averages of 1,144.8911 in 2021 and 1,363.4381 in 2024.
Source 4: Chinese Yuan Renminbi to U.S. Dollar Spot Exchange Rate
Publisher: FRED / Board of Governors of the Federal Reserve System
Dataset/table: AEXCHUS annual average
Units: Chinese yuan per U.S. dollar
Date checked: 2026-05-07
Status: verified
Note: FRED reports CNY per USD annual averages of 6.4508 in 2021 and 7.1957 in 2024.
Data notes & caveats
This is exchange-rate movement against the U.S. dollar, not statistical volatility. Annual averages smooth daily swings.
FRED reports TWD per USD annual averages of 27.9366 in 2021 and 32.1064 in 2024.
FRED reports JPY per USD annual averages of 109.8429 in 2021 and 151.4551 in 2024.
FRED reports KRW per USD annual averages of 1,144.8911 in 2021 and 1,363.4381 in 2024.
FRED reports CNY per USD annual averages of 6.4508 in 2021 and 7.1957 in 2024.

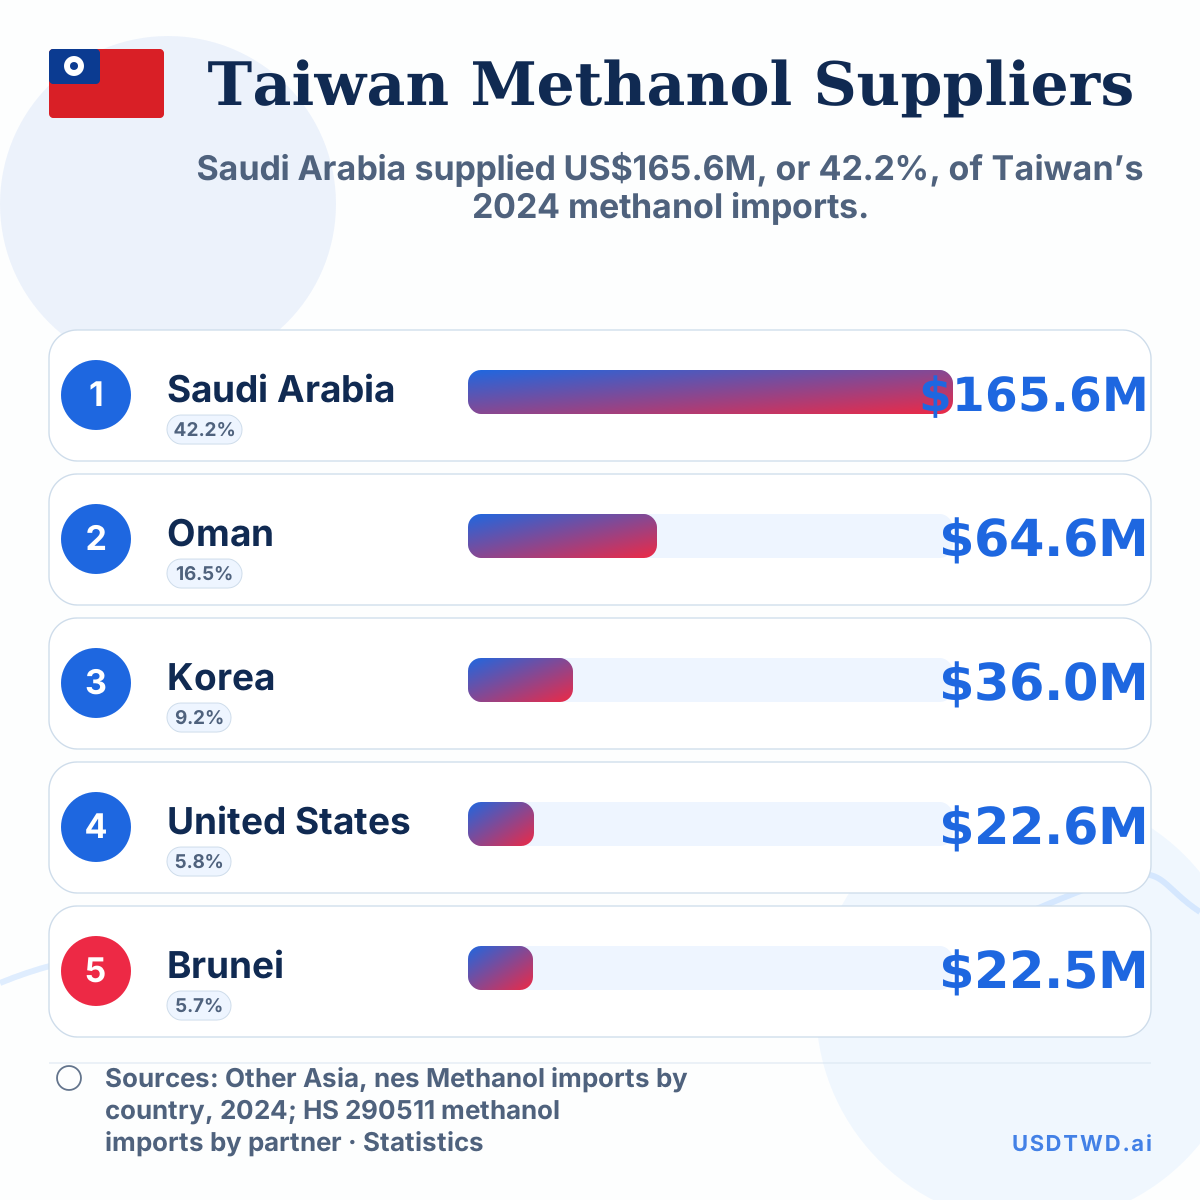 Taiwan’s 5 largest methanol suppliers
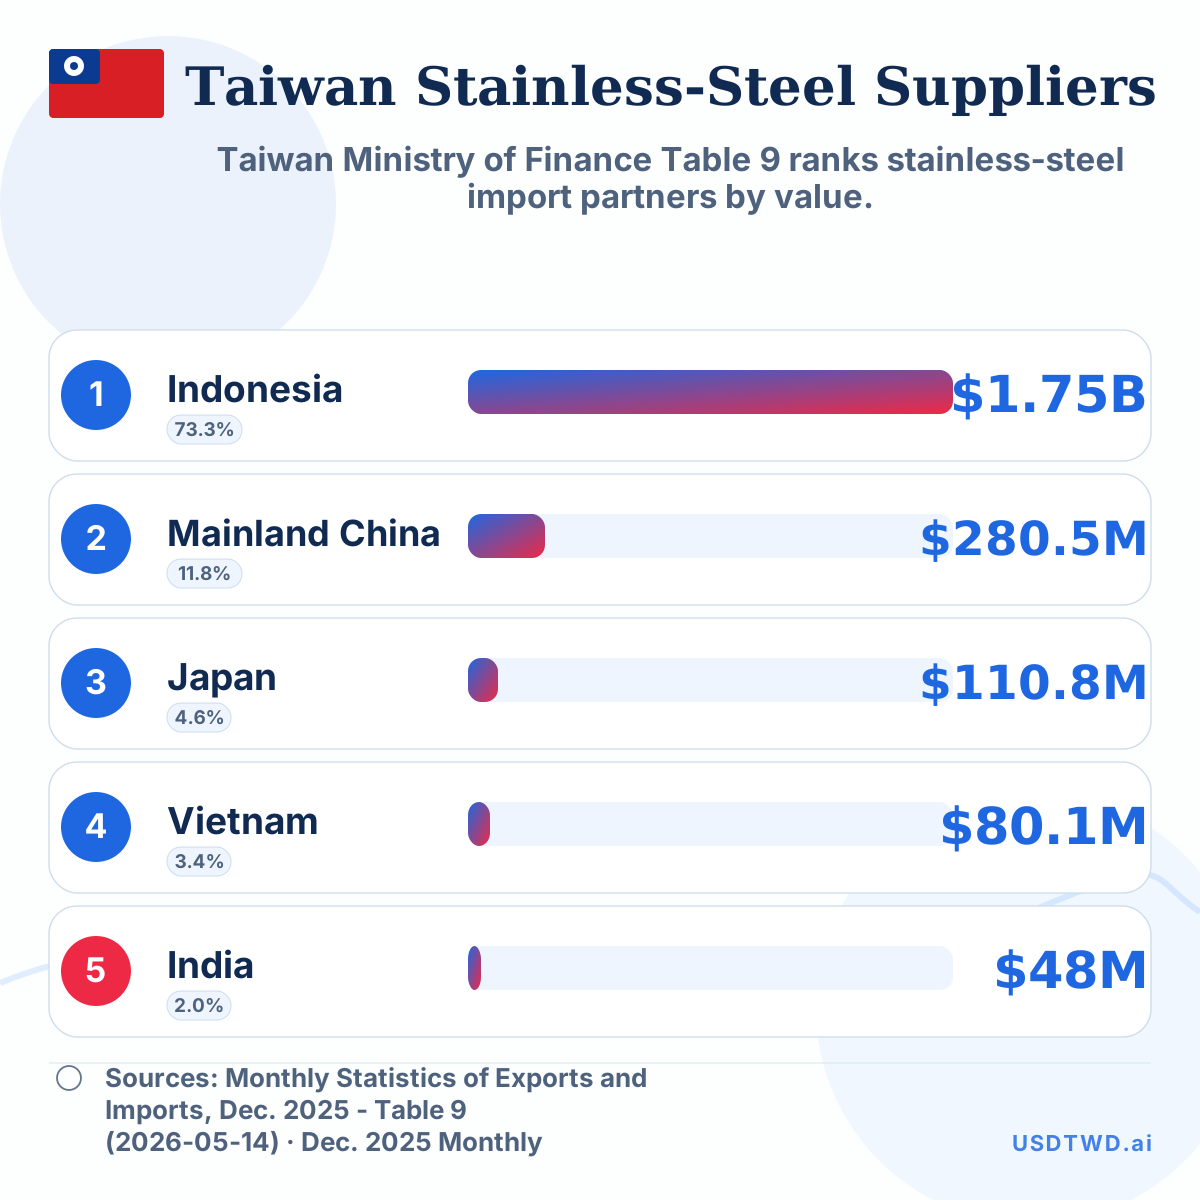 Taiwan’s Largest Stainless-Steel Import Suppliers, 2025
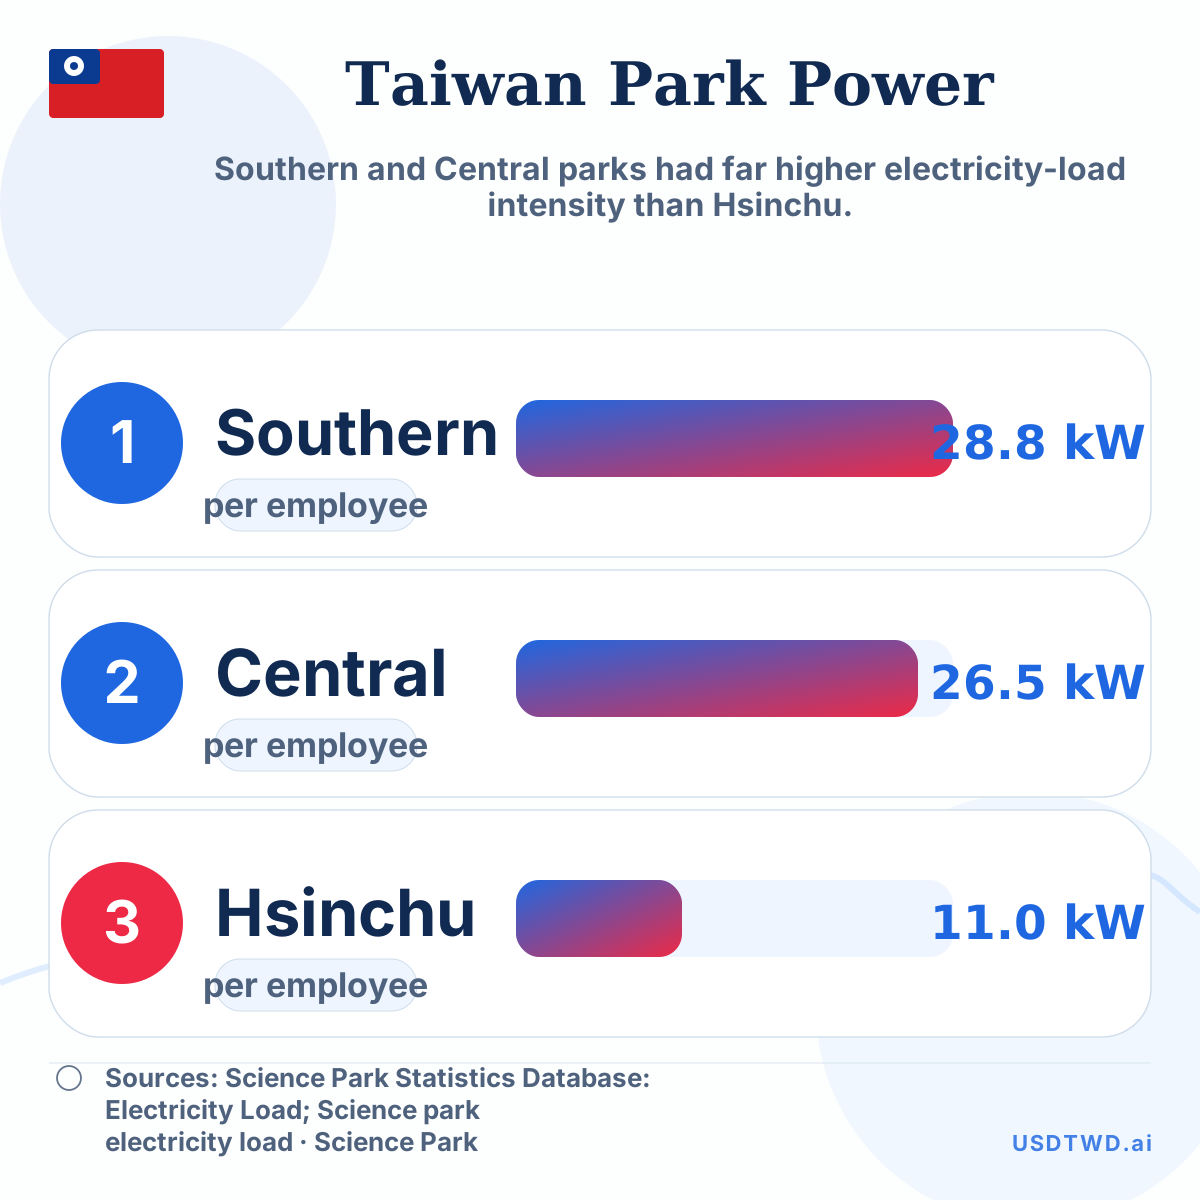 Taiwan Science Park Electricity Load per Employee