Data table
Oil-product exports
313k b/d
total flow
Diesel/gasoil
54%
share of 2025 flow
Gasoline/blend
30%
share of 2025 flow
Other
9%
share of 2025 flow
Fuel oil
7%
share of 2025 flow
Sources
Source 1: 2026 Taiwan Analysis Brief
Publisher: U.S. Energy Information Administration
Dataset/table: Taiwan country analysis brief, petroleum and other liquids section
Units: percent; barrels per day; short tons; billion cubic feet, depending figure
Date checked: 2026-05-14
Evidence: Supports Taiwan 2025 petroleum-product import and export product mix, sources and energy-import context.
Note: Supports Taiwan 2025 petroleum-product import and export product mix, sources and energy-import context.
Source 2: Figure 13 workbook: Taiwan petroleum-product exports by type, 2025
Publisher: U.S. Energy Information Administration
Dataset/table: Taiwan_CAB_Fig13.xlsx
Units: barrels per day; percent share
Date checked: 2026-05-14
Evidence: Supports the 2025 petroleum-product export mix by product type.
Note: Supports the 2025 petroleum-product export mix by product type.
Source 3: Statistics Database Query: Total Imports / Total Exports
Publisher: Customs Administration, Ministry of Finance, R.O.C.
Dataset/table: Commodity and partner-country import/export query
Units: USD; NTD; metric tons; kilograms; quantity for 11-digit commodity codes
Date checked: 2026-05-14
Evidence: Provides Taiwan's official route for detailed commodity-code checks by origin or destination country.
Note: Provides Taiwan's official route for detailed commodity-code checks by origin or destination country.

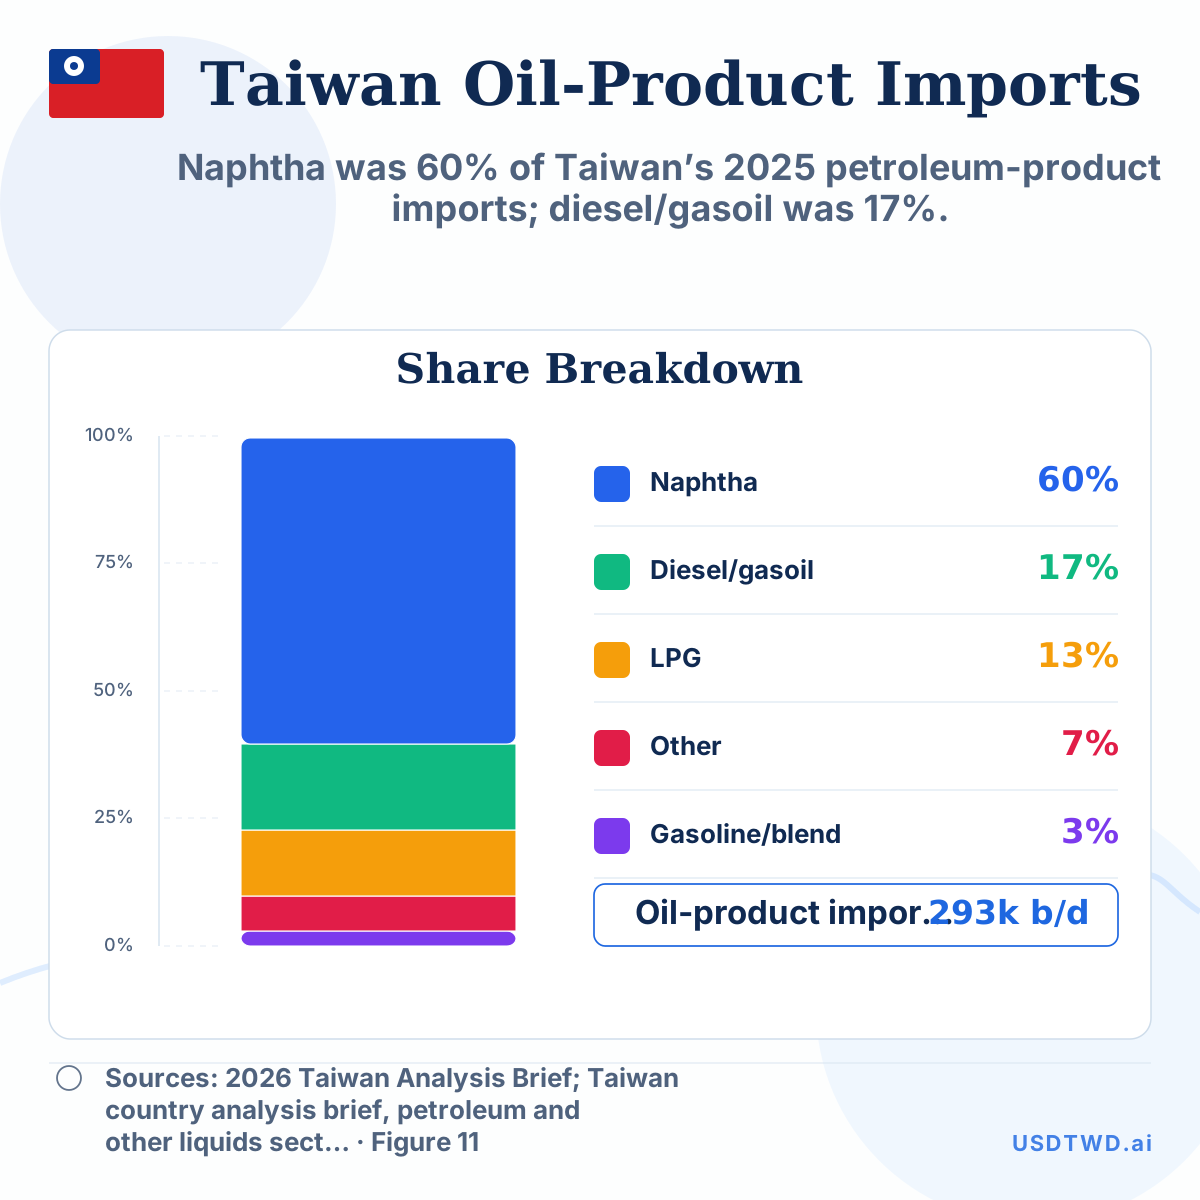 Taiwan petroleum-product import mix
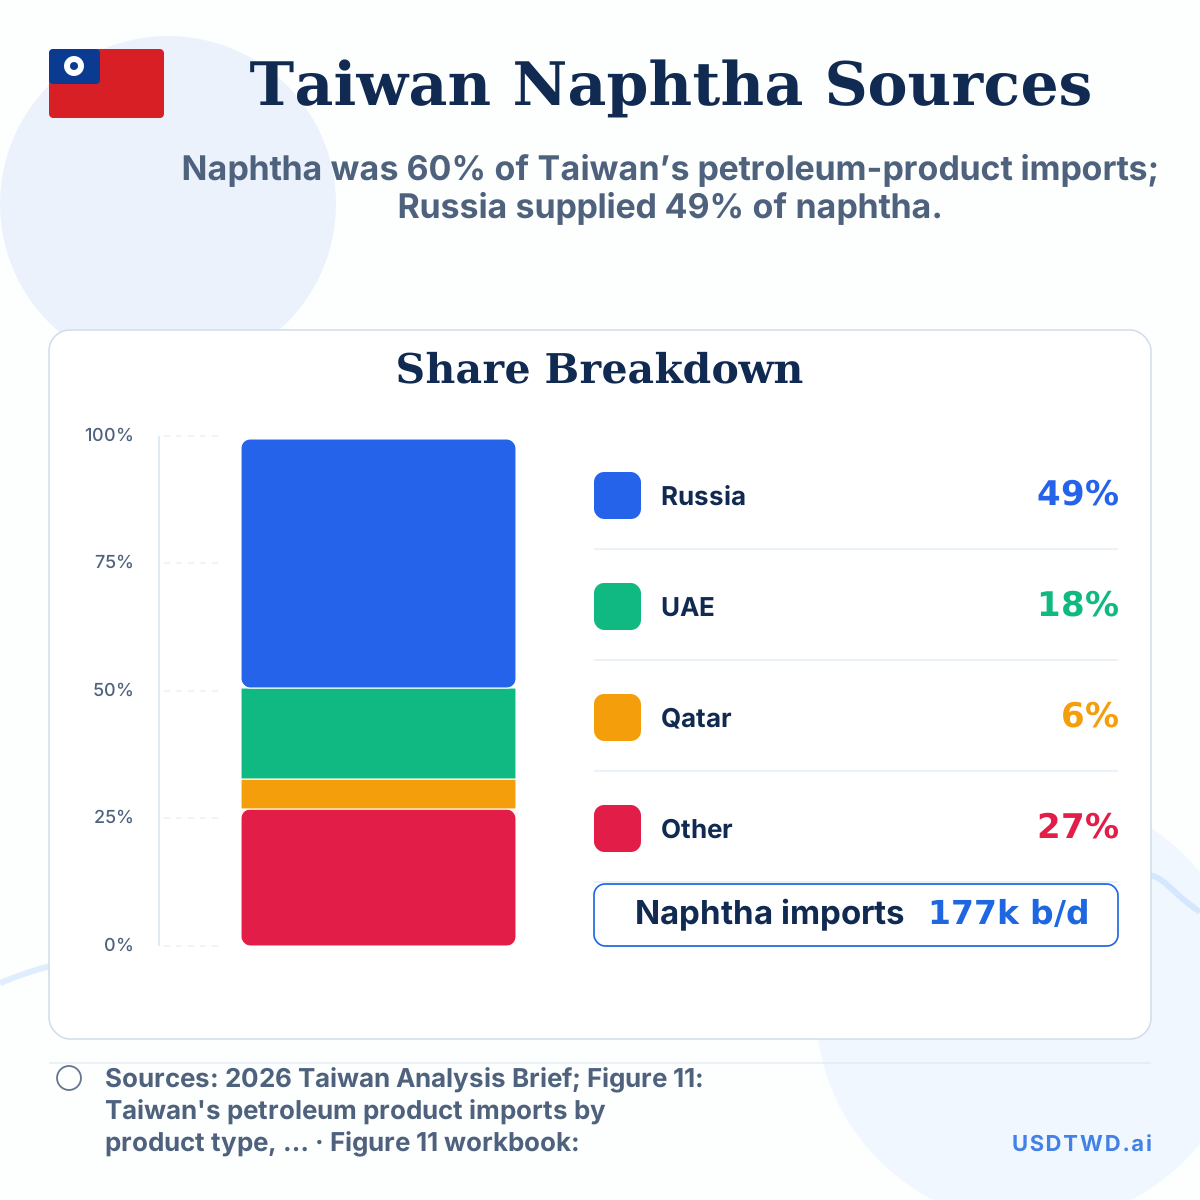 Taiwan’s largest naphtha import sources
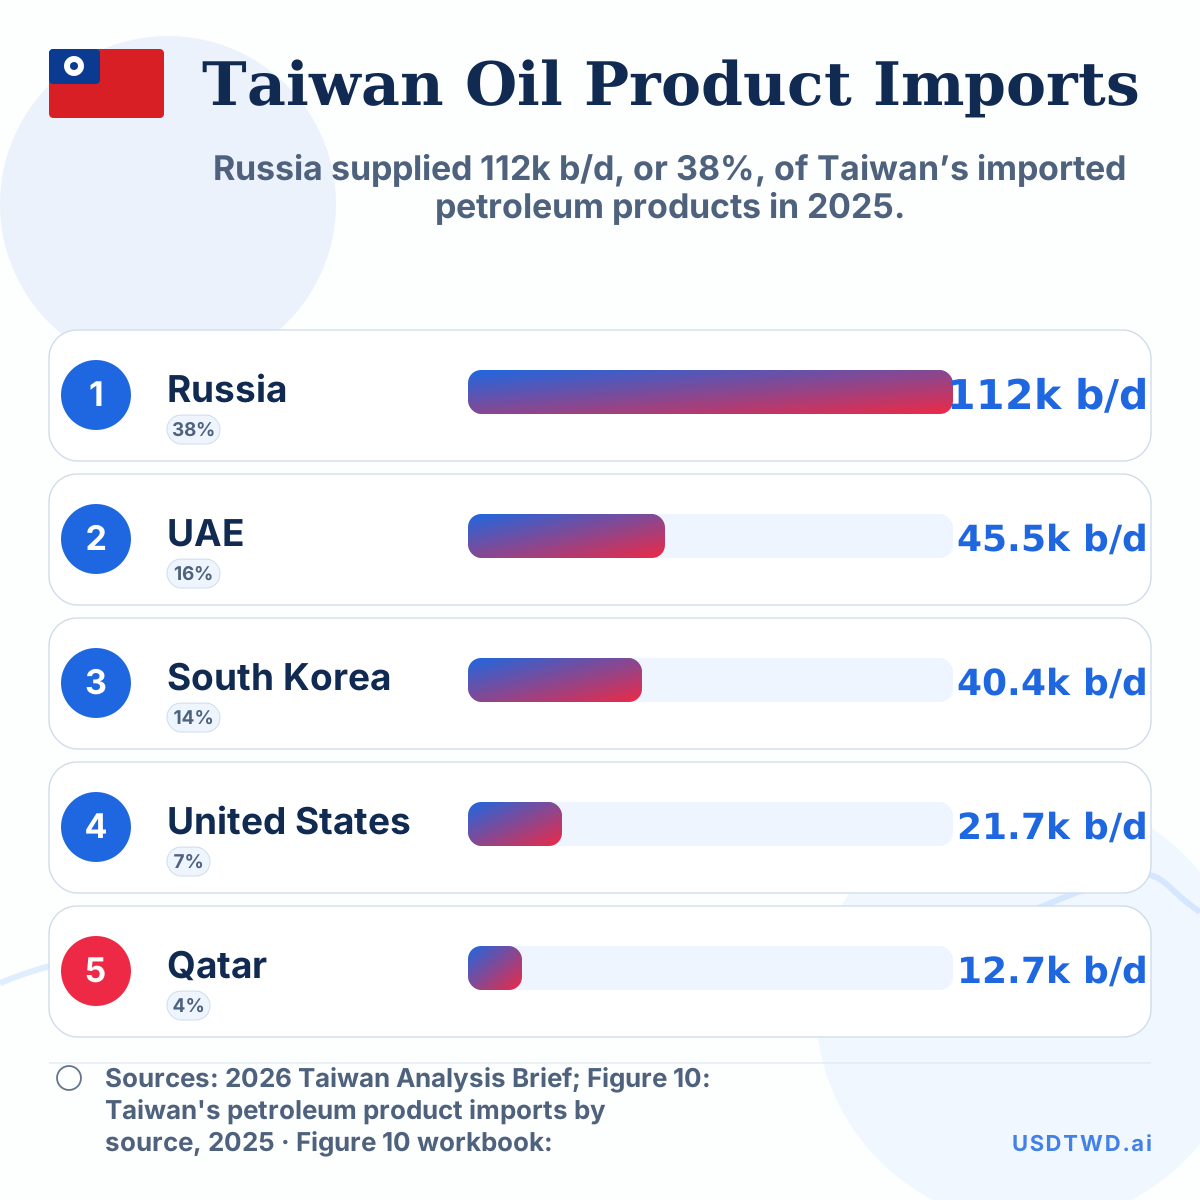 Taiwan’s 5 largest petroleum-product suppliers