Sources
Source 1: Other Asia, nes non-agglomerated iron ore imports, 2024
Publisher: World Bank WITS / UN Comtrade
Dataset/table: Other Asia, nes imports by partner, HS 260111, 2024
Units: US$ thousand and quantity
Date checked: 2026-05-14
Evidence: Reports the largest HS 2601 subheading, led by Australia and Brazil.
Note: Reports the largest HS 2601 subheading, led by Australia and Brazil.
Source 2: Other Asia, nes agglomerated iron ore imports, 2024
Publisher: World Bank WITS / UN Comtrade
Dataset/table: Other Asia, nes imports by partner, HS 260112, 2024
Units: US$ thousand and quantity
Date checked: 2026-05-14
Evidence: Reports agglomerated iron-ore imports, led by Canada and Brazil.
Note: Reports agglomerated iron-ore imports, led by Canada and Brazil.
Source 3: Other Asia, nes roasted iron pyrites imports, 2024
Publisher: World Bank WITS / UN Comtrade
Dataset/table: Other Asia, nes imports by partner, HS 260120, 2024
Units: US$ thousand and quantity
Date checked: 2026-05-14
Evidence: Reports the small HS 260120 input to the HS 2601 aggregation.
Note: Reports the small HS 260120 input to the HS 2601 aggregation.

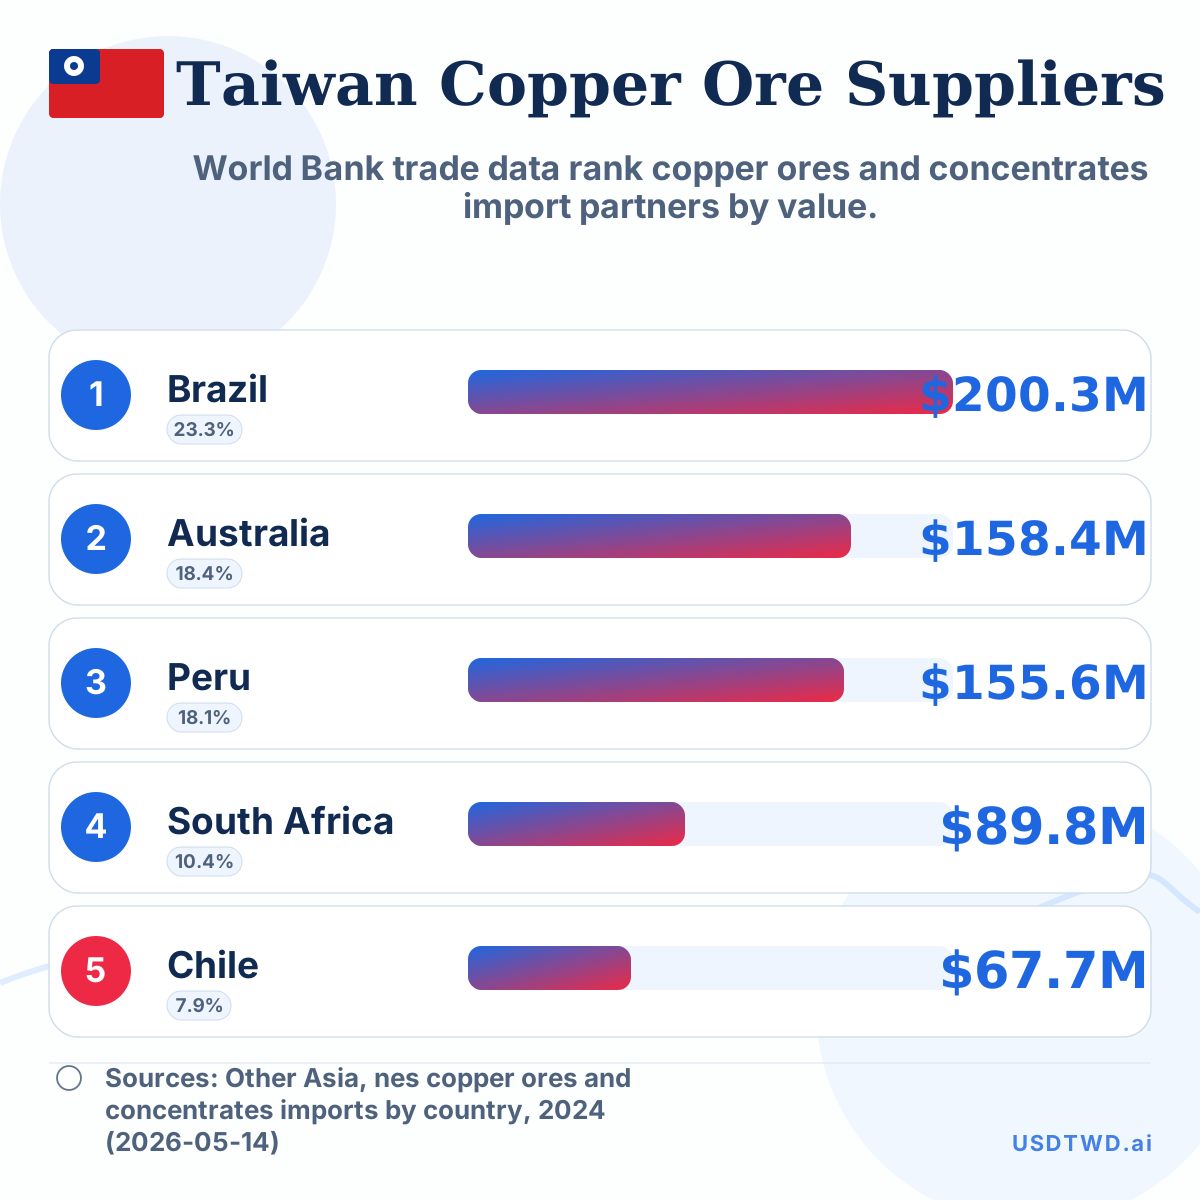 Taiwan’s Largest Copper-Ore Import Suppliers, 2024
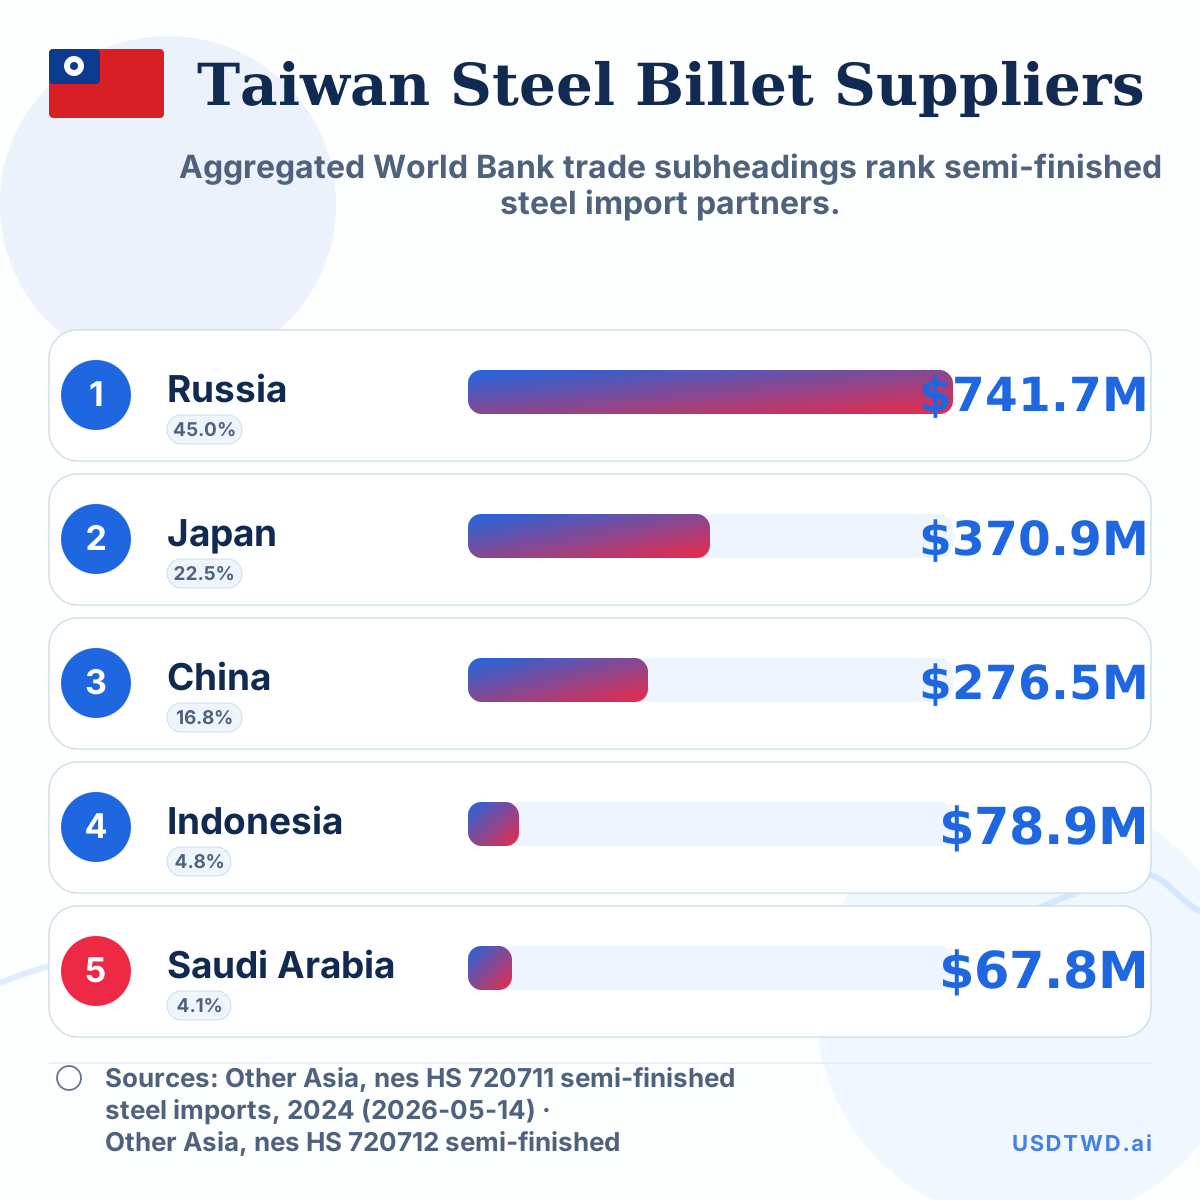 Taiwan’s Largest Semi-Finished Steel Suppliers, 2024
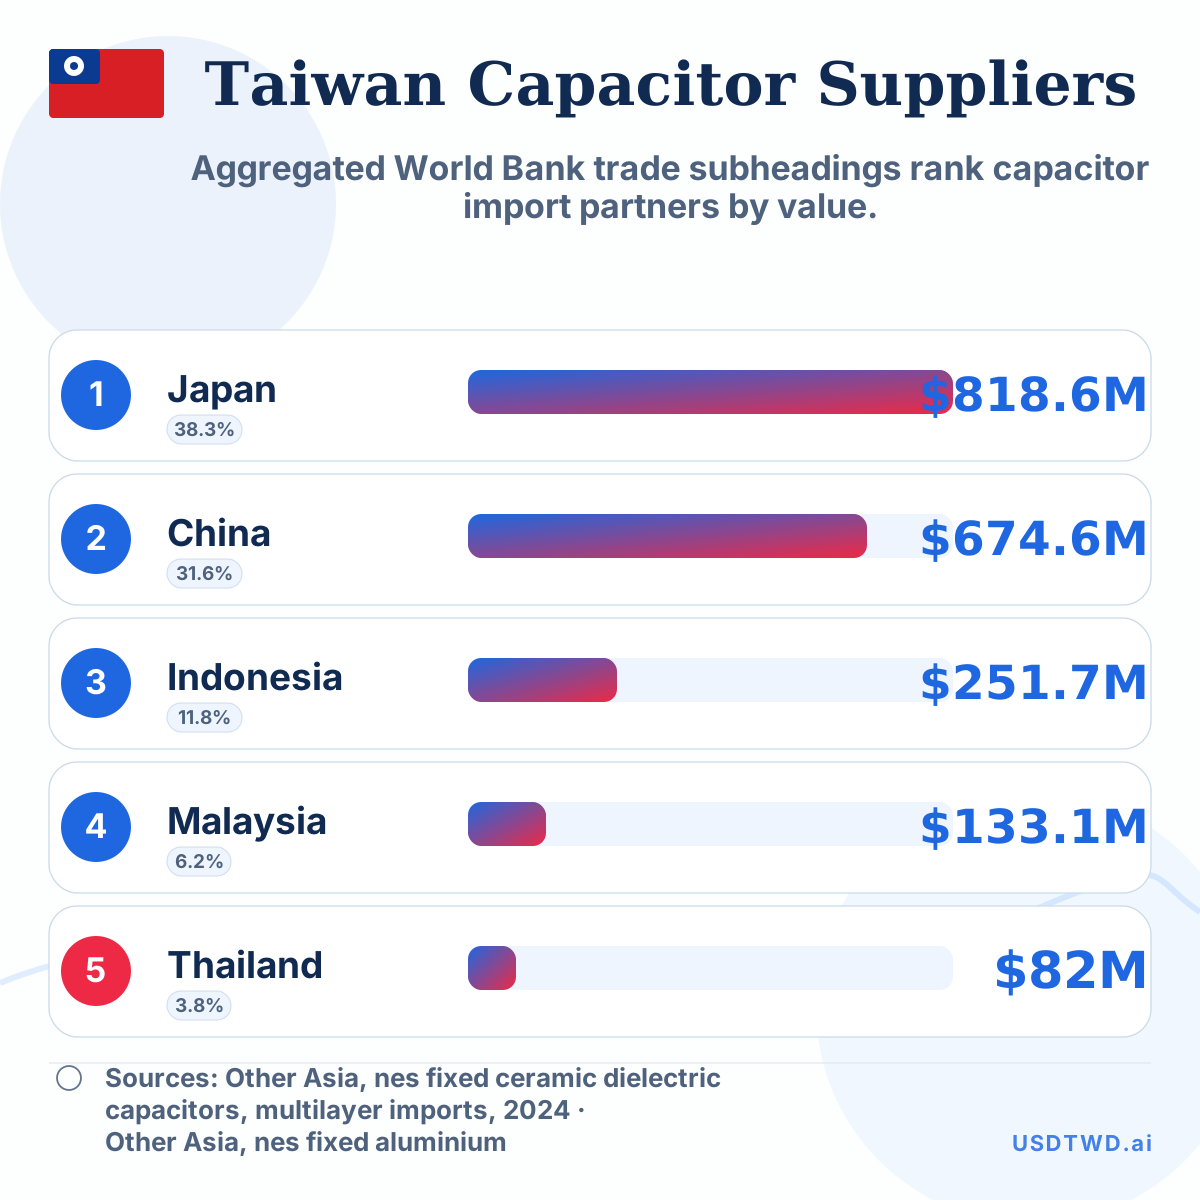 Taiwan’s Largest Capacitor Import Suppliers, 2024