USDTWD.ai Taiwan Macro Atlas

Taiwan’s Largest Wafer-fabrication Equipment Suppliers, 2024

Japan, the Netherlands and the U.S. led Taiwan’s wafer-fabrication tool imports.

What the Data Shows

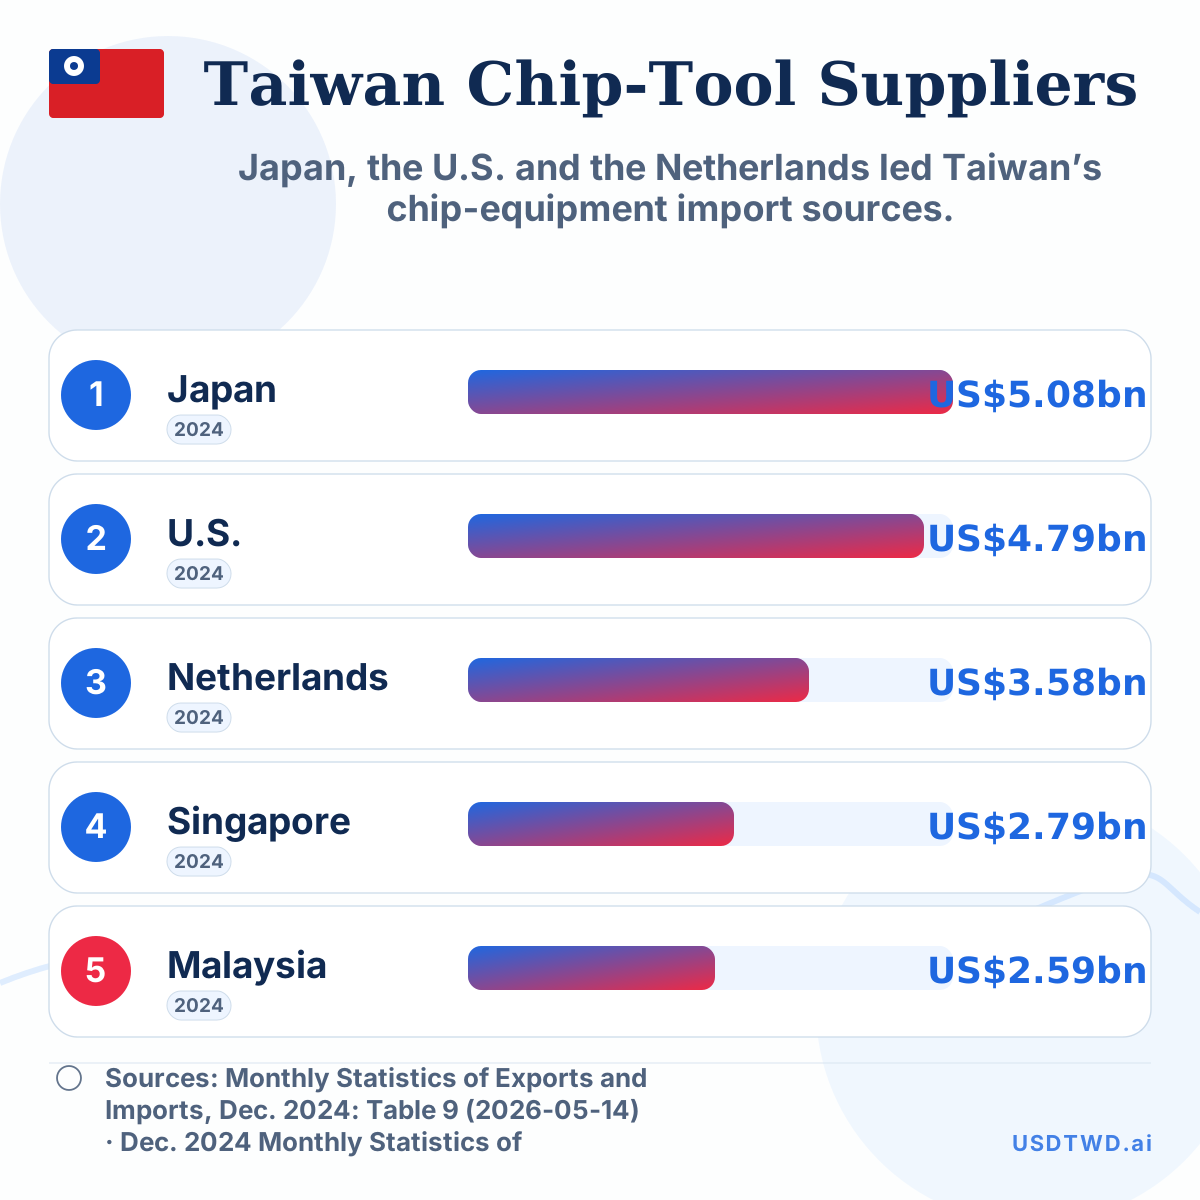
Wafer-fabrication equipment is a narrower slice of the semiconductor-tool chain. Taiwan’s 2024 import pattern shows high dependence on the same countries that dominate leading-edge lithography, deposition, etch and related factory tools. The ranking makes the capital-equipment dependency visible without mixing it with broader electronics imports.

Data table

Japan US$4.53bn 2024
Netherlands US$3.53bn 2024
United States US$3.30bn 2024
Singapore US$2.05bn 2024
Malaysia US$943.6m 2024
Total imports US$17.57bn Total source-backed value
Top-five share 81.7% Share of total import value

Sources

Source 1: Monthly Statistics of Exports and Imports, Dec. 2024: Table 9

Publisher: Ministry of Finance, R.O.C. (Taiwan)

Dataset/table: Table 9 Imports by Selected Commodity and Country

Units: US$ thousand

Date checked: 2026-05-14

Evidence: The workbook gives 2024 import values by selected commodity and country of origin.

Note: The workbook gives 2024 import values by selected commodity and country of origin.

Source 2: Dec. 2024 Monthly Statistics of Exports and Imports e-book page

Publisher: Ministry of Finance, R.O.C. (Taiwan)

Dataset/table: E-books page for Dec. 2024 external trade tables

Units: metadata / links

Date checked: 2026-05-14

Evidence: The page documents the Dec. 2024 monthly trade publication and Table 9 download path.

Note: The page documents the Dec. 2024 monthly trade publication and Table 9 download path.

Data notes & caveats

This official commodity line is deeper than the broad semiconductor-equipment line, but it remains a selected customs grouping rather than a single public HS code in the page copy.

Methodology

Values use Taiwan MOF Table 9, “Machines and Apparatus for the Manufacture of Semiconductor Boules or Wafers, Semiconductor Devices, Electronic Integrated Circuits or Flat Panel Displays.” Values are 2024 cumulative imports in US$ million.

Source consistency notes

All visible ranking values use the same 2024 source table unless otherwise noted in data_notes and research_warnings.