Sources
Source 1: Form 20-F 2024
Publisher: Taiwan Semiconductor Manufacturing Company
Dataset/table: Recent years capital expenditures
Units: NT$ million; US$ million
Date checked: 2026-05-14
Evidence: TSMC reports capital expenditures for 2022, 2023 and 2024.
Note: TSMC reports capital expenditures for 2022, 2023 and 2024.
Source 2: 2024 Annual Report
Publisher: Taiwan Semiconductor Manufacturing Company
Dataset/table: 2024 revenue, margins, customers, products, technologies, employees
Units: NT$; US$; percent; people
Date checked: 2026-05-14
Evidence: TSMC reports 2024 revenue, margins, customer/product breadth and employee scale.
Note: TSMC reports 2024 revenue, margins, customer/product breadth and employee scale.
Source 3: Samsung Electronics Announces Fourth Quarter and FY 2024 Results
Publisher: Samsung Electronics
Dataset/table: FY2024 revenue and operating profit
Units: KRW trillion
Date checked: 2026-05-14
Evidence: Samsung reports 2024 revenue of KRW 300.9tn and operating profit of KRW 32.7tn.
Note: Samsung reports 2024 revenue of KRW 300.9tn and operating profit of KRW 32.7tn.
Source 4: 2025 Sustainability Report
Publisher: Samsung Electronics
Dataset/table: 2024 R&D and facility investment context
Units: KRW trillion
Date checked: 2026-05-14
Evidence: Samsung sustainability reporting identifies 2024 R&D spending and facility investment scale.
Note: Samsung sustainability reporting identifies 2024 R&D spending and facility investment scale.
Source 5: Intel Reports Fourth-Quarter and Full-Year 2024 Financial Results
Publisher: Intel Corporation
Dataset/table: FY2024 revenue and 2025 capital-spending guide
Units: US$ billion
Date checked: 2026-05-14
Evidence: Intel reports full-year 2024 revenue and capital-spending guidance context.
Note: Intel reports full-year 2024 revenue and capital-spending guidance context.
Source 6: Intel Q3 2024 Earnings Release
Publisher: Intel Corporation / SEC
Dataset/table: 2024 gross capital expenditure guide
Units: US$ billion
Date checked: 2026-05-14
Evidence: Intel’s SEC-filed release gives 2024 gross capital expenditures of about US$25bn.
Note: Intel’s SEC-filed release gives 2024 gross capital expenditures of about US$25bn.
Source 7: UMC Board Approves 2024 Business Report and Financial Statements
Publisher: United Microelectronics Corporation
Dataset/table: 2024 consolidated revenue and net income
Units: NT$ million
Date checked: 2026-05-14
Evidence: UMC reports 2024 consolidated revenue of NT$232.303bn and net income attributable to shareholders.
Note: UMC reports 2024 consolidated revenue of NT$232.303bn and net income attributable to shareholders.
Source 8: UMC Reports Second Quarter 2024 Results
Publisher: United Microelectronics Corporation
Dataset/table: 2024 cash-based capex budget
Units: US$ billion
Date checked: 2026-05-14
Evidence: UMC reported a 2024 cash-based CAPEX budget of US$3.3bn.
Note: UMC reported a 2024 cash-based CAPEX budget of US$3.3bn.
Source 9: 2024 New Taiwan Dollar Exchange Rates
Publisher: Central Bank of the Republic of China (Taiwan)
Dataset/table: NTD/USD daily exchange rates
Units: NT$ per US$
Date checked: 2026-05-14
Evidence: CBC provides official 2024 NTD/USD interbank spot closing-rate data.
Note: CBC provides official 2024 NTD/USD interbank spot closing-rate data.

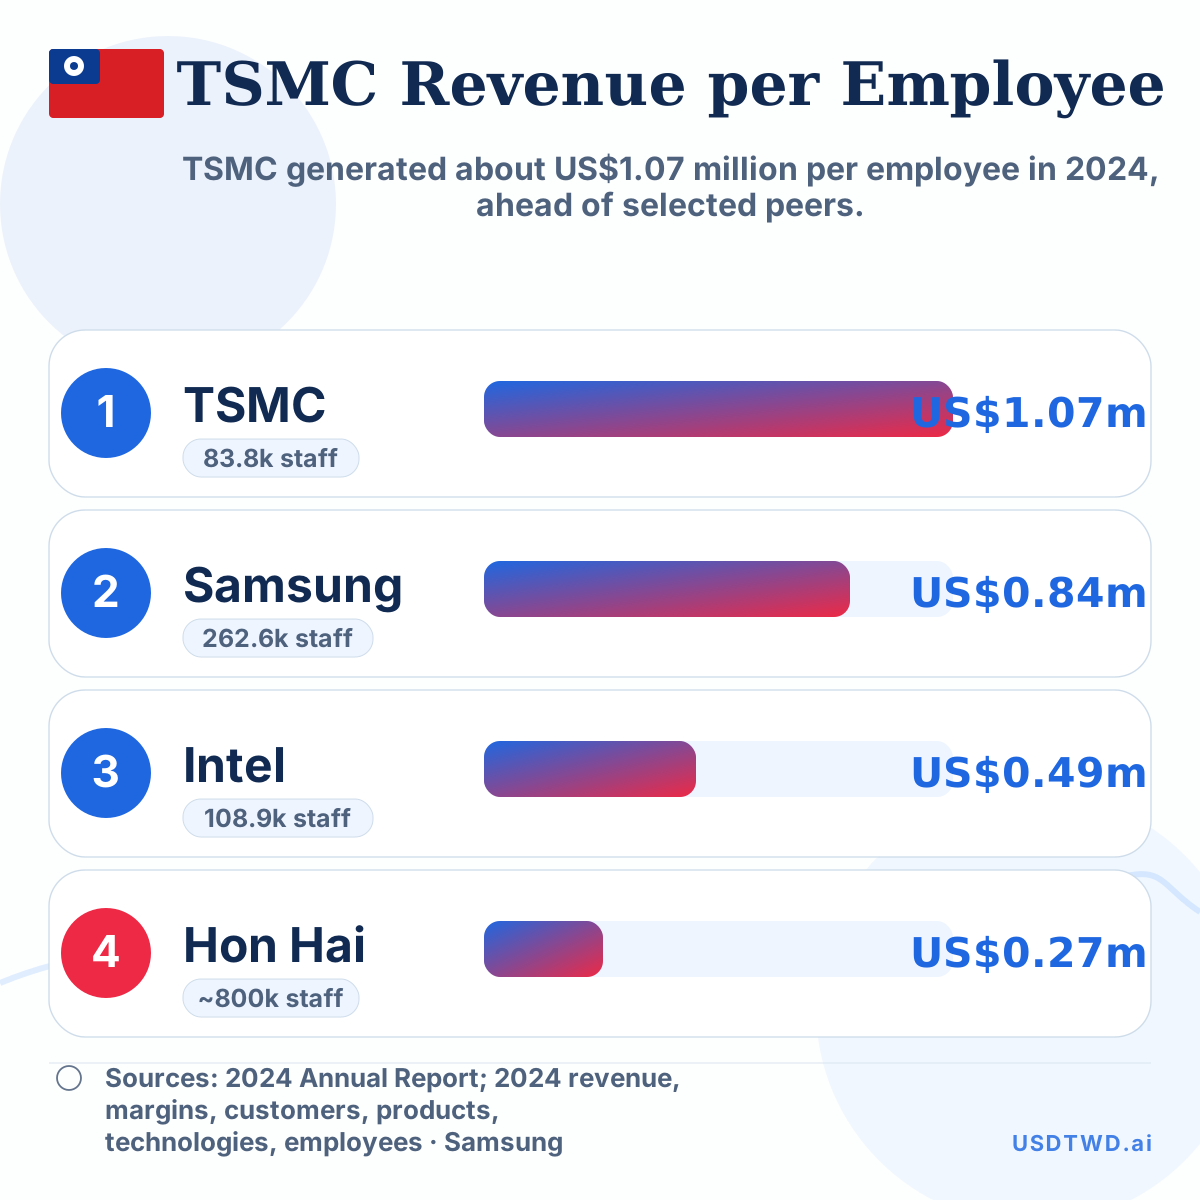 TSMC Revenue per Employee Versus Samsung, Intel and Hon Hai
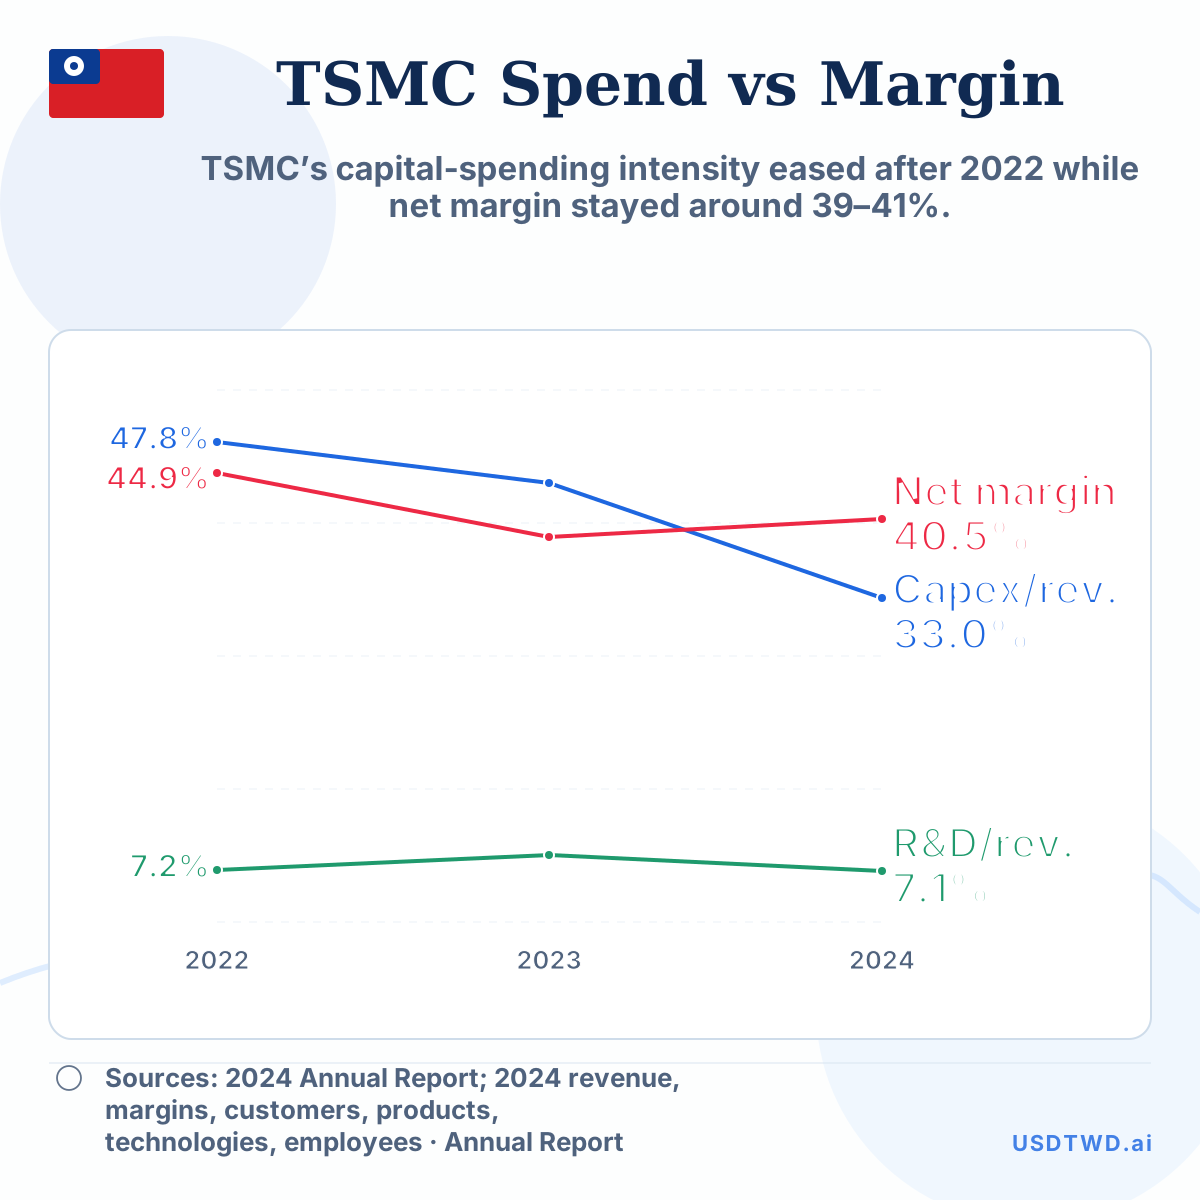 TSMC Research and Development, Capital Spending and Net Margin
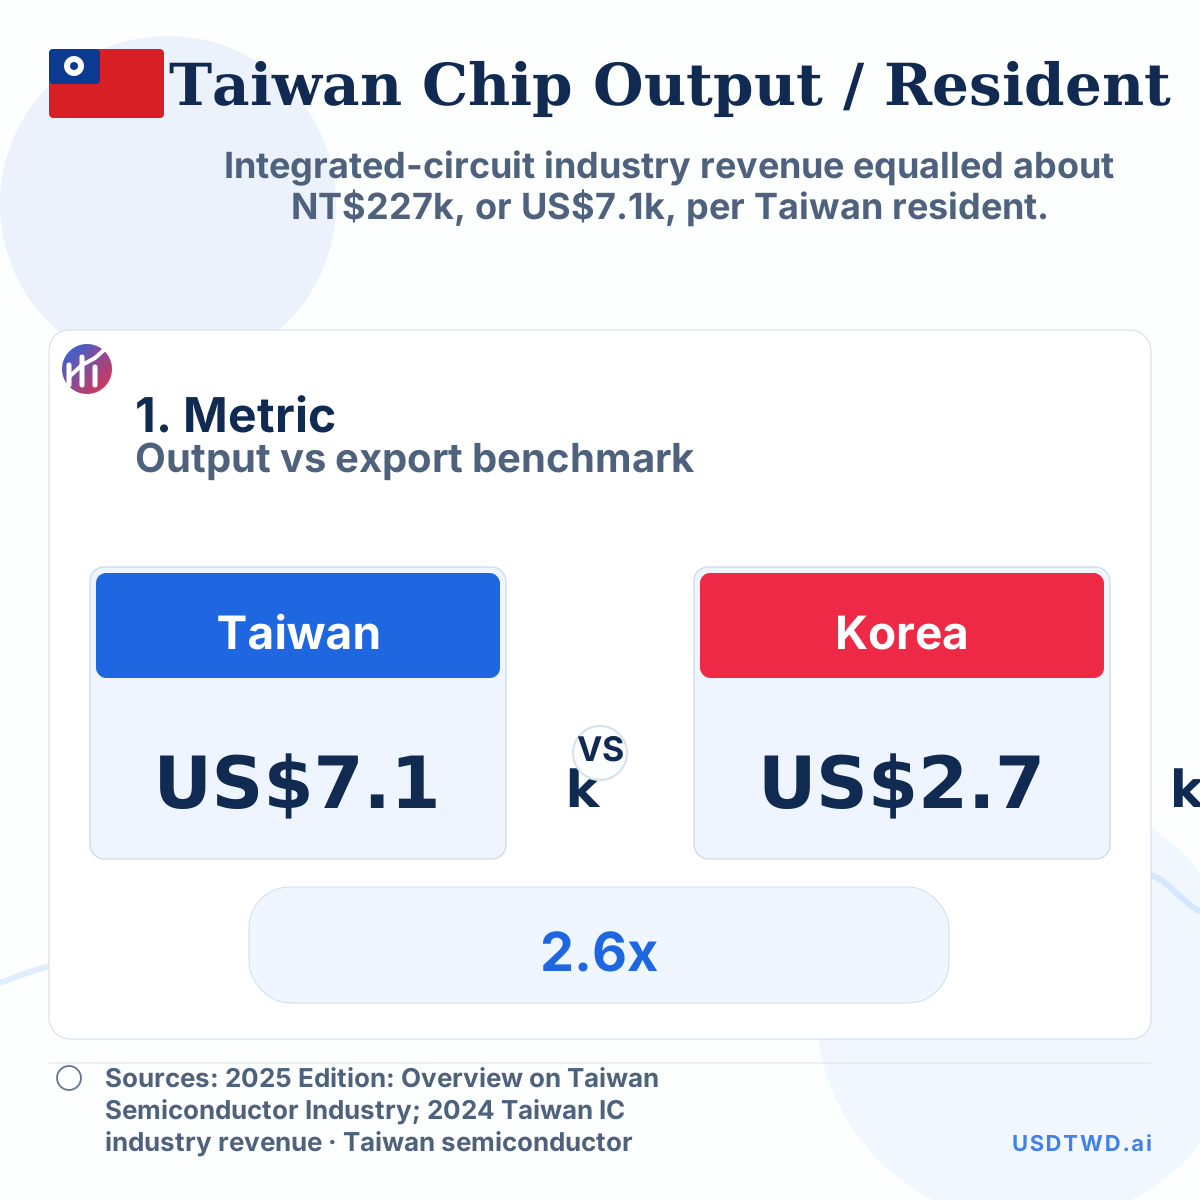 Taiwan Semiconductor Output per Resident vs Korea Export Intensity